2014 CIVIL WORKS PROGRAMS
CUSTOMER SATISFACTION
SURVEY
This report prepared by:
US Army Engineer District, Mobile
CESAM-PM-I
109 ST Joseph St
Mobile, AL 36602
Phone (251) 694-3848
CONTENTS Page
Executive Summary --- 1
Section 1: Introduction 1.1 Background --- 3
1.2 Survey Methodology --- 5
Section 2: Results of 2014 Survey 2.1 Customer Demographics --- 6
2.2 Survey Items and Scales --- 13
2.3 Customer Comments --- 16
Section 3: Comparison of Ratings by Customer Subgroups 3.1 Ratings by Respondent Classification--- 21
3.2 Ratings by Business Line--- 23
3.3 Ratings by Project Phase --- 25
3.4 Ratings By Survey Year --- 27
Section 4: Summary --- 34
Tables & Figures Table 1: Corps Divisions --- 7
Table 2: Corps Districts --- 8
Table 3: Respondent Classification --- 9
Table 4: Primary Business Lines --- 11
Table 5: ‘Other’ Business Lines --- 11
Table 6: Project Phases --- 12
Table 7: Survey Scales --- 14
Table 8: Item Ratings --- 15
Table 9: Item Comments --- 17
Table 10: Additional Comments --- 18
Table 11: Ratings by Respondent Classification --- 22
Table 12: Ratings by Business Line & Year --- 24
Table 13: Ratings by Project Phase --- 25
Table 14: Customers by Business Line & Year --- Table 15: Customers by MSC & Year --- Table 16: Ratings by Survey Year --- 27 27 28 Figure 1: Corps Divisions --- 7
Figure 2: Primary Business Lines --- 10
Figure 3: Ratings by Respondent Classification --- 22
Figure 4: Ratings by Business Line --- 24
Figure 5: Ratings by Project Phase --- 26 Figure 6: Ratings By Survey Year --- 29-33
CONTENTS cont'
Page
APPENDIXA: Survey Instrument --- A-1
B: Statistical Details
Table B-1: Survey Items – Mean Scores--- B-1 Table B-2: Survey Items – Detailed Ratings--- B-2 Table B-3: Scale & Item Scores by Respondent Classification- B-3 Table B-4: Scale Scores by Business Line--- B-5 Table B-5: Scale Scores by Phase --- B-5 Table B-6: Customers by District by Year --- B-6 Table B-7: Scale Scores by Survey Year --- B-7 Table B-8: Item Scores by Survey Year --- B-8 C: Customer Agencies by District --- C-1 – C-27
USACE Organization Symbols
1Division
Division Name
District
District Name
LRD
Great Lakes/Ohio River
LRB
Buffalo
LRC
Chicago
LRE
Detroit
LRH
Huntington
LRL
Louisville
LRN
Nashville
LRP
Pittsburgh
MVD
Mississippi Valley
MVK
Vicksburg
MVM
Memphis
MVN
New Orleans
MVP
St Paul
MVR
Rock Island
MVS
St Louis
NAD
North Atlantic
NAB
Baltimore
NAE
New England
NAN
New York
NAO
Norfolk
NAP
Philadelphia
NAU
Europe
NWD
North West
NWK
Kansas City
NWO
Omaha
NWP
Portland
NWS
Seattle
NWW
Walla Walla
POD
Pacific Ocean
POA
Alaska
POF
Far East
POH
Honolulu
POJ
Japan
SAD
South Atlantic
SAC
Charleston
SAJ
Jacksonville
SAM
Mobile
SAS
Savannah
SAW
Wilmington
SPD
South Pacific
SPA
Albuquerque
SPK
Sacramento
SPL
Los Angeles
SPN
San Francisco
SWD
South West
SWF
Fort Worth
SWG
Galveston
SWL
Little Rock
SWT
Tulsa
TAD
Transatlantic
TAM
Middle East
TAA
Transatlantic Afghanistan
EXECUTIVE SUMMARY
The ninth annual Civil Works Programs Customer Satisfaction Survey has been completed. A
total of 1,318 responses were received in the 2014 survey. The Corps-wide response rate was
47 percent. Just over one third of customers can be classified as ‘stakeholders’.
Flood Risk Management customers comprise the largest proportion of the 2014 sample at 26
percent followed by Environmental (23%), Navigation (19%) and Emergency Management,
Recreation and ‘Multiple Business Lines’ (7% each). The proportion of customers in the other
business lines was five percent or less each. Sixteen of the 62 responses categorized as ‘Other’
were International and Interagency Support (IIS) Program customers and eleven had projects
under the ‘Planning Assistance to States’ program. Eight were ‘Real Estate’ customers and five
fell under the ‘Continuing Authorities (CAP) Program.
Civil Works customers include primarily city and county governments and various governmental
departments charged with the management of infrastructure relating to water resources.
Navigation customers included local port authorities and waterway user groups. Customers also
include state agencies charged with the management of natural resources and emergency
response.
Customers are asked to rate Corps district performance in general service areas such as quality
of products and services, timeliness, cost, etc. The 24 survey items are grouped into one of
eight scales: ‘Attitude’, ‘Products and Services’, ‘Corps Staff’, ‘Timely Service’, ‘Cost’,
‘Communication’, ‘Problem Solving’ and ‘Overall Satisfaction’. In addition a Composite Index
score was calculated for each respondent.
All scale means this year were ‘Green’ (mean score ≥ 4.00). The mean Composite score was
4.35
2. The highest rated area was Staff services at 4.51. The highest rated items were ‘Technical
Competency’ at 95 percent high ratings and ‘Listening to My Needs’ and ‘Treats Me as an
Important Team Member’ and ‘Responsiveness’ at 92 percent high ratings each. The items that
elicited the greatest proportion of low ratings were ‘Cost of Services’ and ‘Timely Services’ at
eight percent low ratings each and ‘Meets My Schedule’ at seven percent low ratings. Three
items are ‘bottom line’ indicators of customer satisfaction. They are ‘Your Overall Customer
Satisfaction’, ‘Would Recommend the Corps’ and ‘Would be Your Choice for Future Services’.
These items received at least 83% satisfactory ratings while only four percent of customers
provided low ratings. Thirteen percent were ‘Neutral’ on ‘Would be Your Choice for Future
Services’.
Customers may provide comments on each service area as well as provide general comments
concerning Corps services. The survey item that received the greatest number of positive
comments was ‘Responsiveness’ (127 customers) followed by ‘Customer Focus’ (93 customers).
2
The two items that received the largest number of negative comments concerned cost and
timeliness: ‘Timely Service’ (84), ‘Meets My Schedule’ (73 customers).
The most frequent positive general comments were ‘Compliments to individuals/staff’ (239
customers). A large number of positive comments concerned the relationship/partnership
between the customer and district staff (105 customers). There were also a significant number
of positive comments about the professionalism and personal commitment of Corps staff. The
issue that received the greatest number of negative comments concerned Corps ‘bureaucracy’
or policy/requirements and the negative impact on project cost, timeliness, district flexibility, or
overall project execution (49 customers). A total of 36 customers stated that lack of federal
funding impacted their projects. Project delays were often due to lack of federal funding and
Corps ‘bureaucracy’.
Comparative analyses of ratings by customer classification revealed that stakeholder and
traditional customers were equally well satisfied in all service areas (Staff, Timeliness & Overall
Satisfaction) and the Composite Index. Furthermore, no mean scores fell below ‘Green’ for
either subgroup.
The comparisons of ratings by business line were very definitive. Emergency Management
customers were consistently the least satisfied while Navigation, Recreation and Multi-Business
Line customers tended to be more satisfied. Although several significant differences in ratings
were found, there were only two instances where any mean score fell below ‘Green’. The first
was in ‘Timeliness’ where the Water Quality/Supply mean rating was ‘Amber’; the second in
‘Cost’ where the Emergency Management mean score was ‘Amber’. Many subgroup mean
scores are very close to ‘Amber’ in the areas of cost and timeliness.
Comparisons of ratings by Project Phase revealed customers whose projects were in Recon and
O&M phases were significantly more satisfied. Feasibility, Construction and Multiple Phase
customers were significantly less satisfied.
Analyses of trends in ratings from 2007 to 2014 showed that Ratings were found to be
significantly higher in 2013 and 2014 compared to 2007 and 2008. And ratings for 2013-14 were
in many instances higher than those received during the entire 2007-2010 survey periods.
Corporately Civil Works Program customers are largely satisfied with Corps’ services. Costs and
timeliness are the two greatest sources of Civil Works customer dissatisfaction. These issues
appear to be closely tied to persistent customer dissatisfaction with Corps requirements,
policies and Corps bureaucracy as well as the Federal funding process. The numbers of
complaints on these issues has increased significantly since 2007. These are clearly systemic
problems reaching across all districts and business lines. Measures of staff services and
relationship dynamics (collaboration) received the highest ratings. This illustrates the strong
relationships that exist between Corps staff and their customers as does the number of
compliments paid to Corps staff.
§1. INTRODUCTION
§1.1 BACKGROUND
The original impetus for the survey was a Clinton administration Executive Order 12862
(Setting Customer Service Standards), issued on September 11, 1993. This Order
required agencies that provide significant services directly to the public identify and
survey their customers, establish service standards, track performance against those
standards and benchmark customer service performance against the best in business.
This Executive Order was reinforced by a Presidential Memorandum for the Heads of
Executive Departments and Agencies issued on March 22, 1995 (Improving Customer
Service) and a further Presidential Memorandum issued on March 3, 1998 (Conducting
‘Conversations with America’ to Further Improve Customer Service).
The Obama administration issued an Executive Order in April 2011 (Streamlining Service
Delivery and Improving Customer Service) again requiring government agencies to
establishing mechanisms to solicit customer feedback on Government services and
using such feedback regularly to make service improvements.
This report summarizes the results of the Corps of Engineers Civil Works Programs Directorate
Customer Satisfaction Survey. HQUSACE is the coordinating office for the Corps' survey and has
appointed Mobile District to perform the administration, statistical analysis and reporting of
results of the survey. A memorandum from Mr. Steven Stockton, Director of Civil and
Emergency Operations Directorate (CECW), was transmitted to all Major Subordinate
Commands (MSCs) on 4 February 2015. The memo contained guidance for administration of
the 2014 Survey within all districts having a CW mission. Districts were to complete
administration of their customer survey by 16 April 2014.
Each District was required to develop their customer list as a comprehensive enumeration of all
organizations served by the district during calendar year 2013. Districts are responsible for
integrating the survey process into ongoing management activities involving its customers.
Individual components were encouraged to perform their own analyses and take action as
necessary in response to customer feedback. Districts were asked to publicize their results
among district and MSC staff including the District benchmark report received from HQ, their
analyses and summary of customer comments.
The basic definition of a Civil Works (CW) ‘customer’ is any organizational representative who
participated in the planning or execution of a CW project within the targeted calendar year.
These are external agents with whom Corps staff has had significant interaction who can
potentially impact or influence the successful execution of a Corps CW project. This includes
‘traditional customers’ i.e., representatives of agencies that are direct recipients of Corps
services who directly or indirectly provide a source of income for the District. In addition to
traditional customers as defined below, the CECW Survey population was expanded in 2010 to
include stakeholder agencies. The purpose for this modification is to address one of our 2010
Campaign Plan Objectives (2b) to improve collaboration among project participants.
Stakeholder agencies are not direct recipients of Corps services but participate in the project
execution process. Their staff interacts with Corps staff and participates in a significant degree
in project planning, oversight and/or execution.
Traditional customers may include the following:
a. All cost share sponsors & International or Inter-Agency Support (IIS) customers not
included in Corps of Engineers Military Programs (CEMP) Survey, even in cases where the
local cost-share is supported by in-kind services.
b. Likely Sponsors for CW Reconnaissance for whom a reconnaissance study has been or is
being undertaken. (Even though these sponsors may not provide actual funding, they are
recipients of Corps’ services.)
c. Sponsors for construction that received no Federal funding last year (the project is in the
middle of construction).
d. Miscellaneous General Investigations (GI) partners, Planning Assistance to States (PAS)
and Floodplain Management Services (FPMS) partners, tribes.
e. Likely Sponsors for not-yet-Appropriated Reconnaissance (i.e., project is authorized and
we have ‘sufficient interaction’ with said customer).
Stakeholders to be included on the customer list may include:
a. State or local environmental and natural resource management agencies (e.g. state
departments of natural resources, local water use agencies, Nature Conservancy, etc.)
b. Federal regulatory agencies (e.g. USFWS, EPA)
c. Navigation interests (e.g. user boards, port authorities)
d. Local associations (e.g. Property owners associations, chambers of commerce etc).
The following should generally be excluded from the survey:
a. Regulatory customers, i.e., Section 404 permit requestors (UNLESS they are a funding
sponsor for a Federal participation project).
b.
Firms with recreation contracts on Corps project sites/dams
c. Recreation visitation customers.
d. Congressional interests.
e. USACE staff.
§1.2. SURVEY METHODOLOGY
Each District and MSC appointed an individual Customer Survey Manager (CSM) to act as
primary point of contact to CECW for the execution of the survey. Each CSM is responsible for
overseeing the administration of the survey within their organization. District CSMs are charged
with monitoring the feedback provided by their customers to ensure reliability of the CECW
database and to respond to any urgent issues surfaced by their customers. Districts were
instructed to send each customer an e-mail invitation from their District commander containing
a URL link to the survey and instructions on completing the survey. In order to ensure a high
response rate and minimize sampling error the CSMs were instructed to send a series of two
reminder messages to all non-respondents. Furthermore each PM is asked to personally
contact their customers to emphasize the importance of the survey and to encourage their
participation.
The 2014 survey instrument consists of two sections. Section one solicits customer
demographic information (customer name, organization, project name and district evaluated).
Section two contains 24 satisfaction questions in a structured response format in which
customer satisfaction is measured on a 5-point Likert scale as follows: ‘Very Dissatisfied’ (1),
‘Dissatisfied’ (2), ‘Neutral’ (3), ‘Satisfied’ (4) and ‘Very Satisfied’ (5). A text field solicits customer
comments in each service area. Items are grouped within eight categories of services or scales.
The scales include ‘Attitude’, ‘Products and Services’, ‘Corps Staff’, ‘Timely Service’, ‘Cost and
Affordability’, ‘Communication’, ‘Problem Solving’ and ‘Overall Satisfaction’. The survey also
solicits general customer comments. A copy of the survey instrument may be viewed in
Appendix A or by ‘CTRL-clicking’ on the following link:
§2. RESULTS OF 2014 SURVEY
§2.1 CUSTOMER DEMOGRAPHICS
The USACE Civil Works Program customer base included 2,760 customers; an eight percent
decrease compared to last year. There was notable variability among district population sizes.
Population sizes ranged from as few as N=17 for Honolulu District to a high of N=193 for Walla
Walla District.
A total of 1,303 unique customers participated in the 2014 survey. Many customers have
multiple projects within a district. A few of these elected to submit more than one survey
response to evaluate projects separately. Hence, the database used in these analyses contains
1,318 records.
The number of unique customer responses was used to calculate response rates. The
Corps-wide response rate was 47 percent for an estimated sampling error of 1.6 percent. Response
rates varied among districts, ranging from 15 percent for Philadelphia District to as high as 100
percent for Kansas City District. The average response rate was 51 percent for larger (Tier I)
districts and 46 percent for smaller (Tier II) districts. Classification of districts as Tier I or II is
based on actual FY14 district program size ($).Tier I districts had a program size of at least $100
million while Tier II districts had program sizes less than $100 million in FY14.
The importance of obtaining an unbiased representative sample cannot be overstated. In order
to increase the reliability of the data collected and corresponding confidence in the conclusions
drawn, it is critical for districts to survey their comprehensive CW customer population and to
strive for as high a response rate as possible. The sampling error associated with a small sample
taken from a small population can be surprisingly high, calling into question conclusions drawn
from that data. At the corporate level we can have a great deal of confidence in our conclusions
since our sampling error is very low. When the database is disaggregated into districts it is
important to be cognizant of whether the district successfully obtained a representative sample
of their customer base as indicated by their district sampling error. For example Memphis
District’s population size was 96. Their response rate of 33 percent resulted in a sampling error
of 11 percent. Clearly conclusions must be drawn more cautiously than if they had had a higher
response rate.
The survey included all Civil Works Districts. These districts work within the eight CONUS Corps
Divisions. The districts within TransAtlantic Division as well as Europe, Far East and Japan
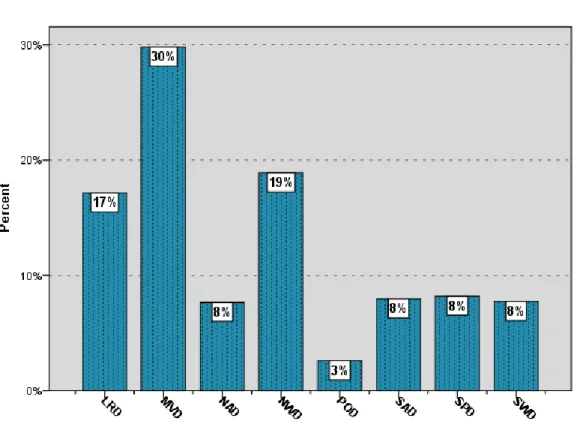
Districts did not participate as they do not have a Civil Works mission. The greatest proportion
of responses was received from customers served by the Mississippi Valley Divisions (MVD) at
30 percent followed by Northwest Division (NWD) at 19 percent and Great Lakes-Ohio River
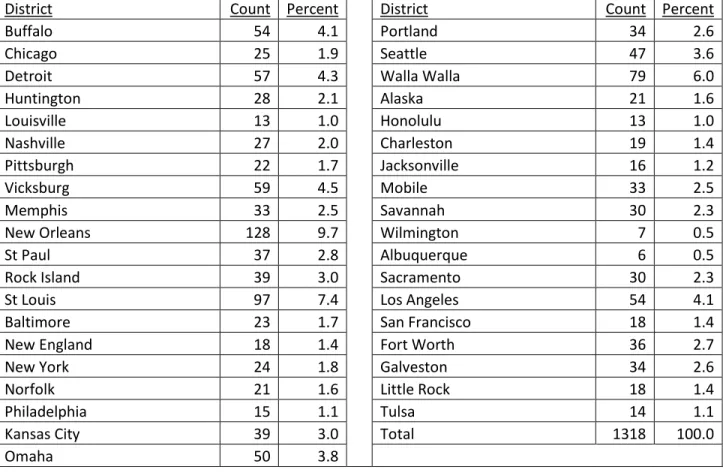
(LRD) at 17 percent. New Orleans District had the highest number of responses among districts
at ten percent of the Corps-wide sample followed by St. Louis at seven percent.
Figure 1: Corps Divisions
Table 1: Corps Divisions
Division
Count Percent
Great Lakes / Ohio River (LRD)
226
17.1
Mississippi Valley (MVD)
393
29.8
North Atlantic (NAD)
101
7.7
North West (NWD)
249
18.9
Pacific Ocean (POD)
34
2.6
South Atlantic (SAD)
105
8.0
South Pacific (SPD)
108
8.2
South West (SWD)
102
7.7
Total
1318
100.0
Table 2: Corps Districts
District
Count Percent
District
Count Percent
Buffalo
54
4.1
Portland
34
2.6
Chicago
25
1.9
Seattle
47
3.6
Detroit
57
4.3
Walla Walla
79
6.0
Huntington
28
2.1
Alaska
21
1.6
Louisville
13
1.0
Honolulu
13
1.0
Nashville
27
2.0
Charleston
19
1.4
Pittsburgh
22
1.7
Jacksonville
16
1.2
Vicksburg
59
4.5
Mobile
33
2.5
Memphis
33
2.5
Savannah
30
2.3
New Orleans
128
9.7
Wilmington
7
0.5
St Paul
37
2.8
Albuquerque
6
0.5
Rock Island
39
3.0
Sacramento
30
2.3
St Louis
97
7.4
Los Angeles
54
4.1
Baltimore
23
1.7
San Francisco
18
1.4
New England
18
1.4
Fort Worth
36
2.7
New York
24
1.8
Galveston
34
2.6
Norfolk
21
1.6
Little Rock
18
1.4
Philadelphia
15
1.1
Tulsa
14
1.1
Kansas City
39
3.0
Total
1318
100.0
Omaha
50
3.8
An important consideration every year is whether each district included their entire customer
base in the survey. If their list of invitees was not complete, then the data obtained cannot be
used to characterize the level of satisfaction of their entire customer population. This was
particularly well illustrated with respect to the inclusion of stakeholders for the first time in the
2010 survey. Many districts did not include all stakeholders with whom they worked in 2010.
The level of compliance with this requirement has since greatly improved. Again this year all
MSC’s appear to have been very thorough in identifying their stakeholder population with the
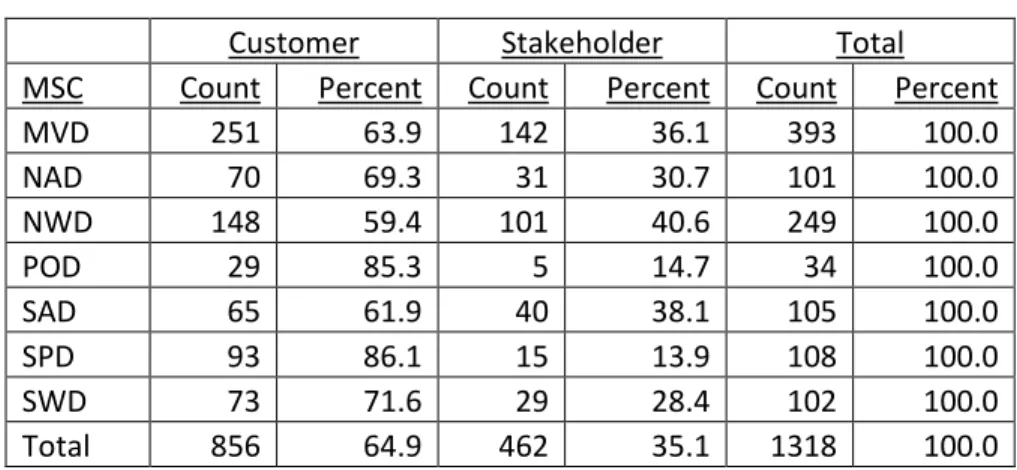
possible exception of SPD. Stakeholders generally comprise just over one third of the Civil
Works customer base. The following table displays the classification of respondents as
traditional customers versus stakeholders by MSC.
Table 3: Respondent Classification
Customer
Stakeholder
Total
MSC
Count
Percent
Count
Percent
Count
Percent
MVD
251
63.9
142
36.1
393
100.0
NAD
70
69.3
31
30.7
101
100.0
NWD
148
59.4
101
40.6
249
100.0
POD
29
85.3
5
14.7
34
100.0
SAD
65
61.9
40
38.1
105
100.0
SPD
93
86.1
15
13.9
108
100.0
SWD
73
71.6
29
28.4
102
100.0
Total
856
64.9
462
35.1
1318
100.0
USACE Civil Works customers are categorized by their
primary
category of service aligned to
the Civil Works Program business lines. Civil Works business lines include: Emergency
Management, Environmental, Flood Risk Management, Hydropower, Navigation, Recreation,
Regulatory and Water Quality/Supply. A significant number of customers had multiple projects
underway at their district and could not be classified under a single business line. An additional
category was created to accommodate the ‘Multiple Business Line’ customers.
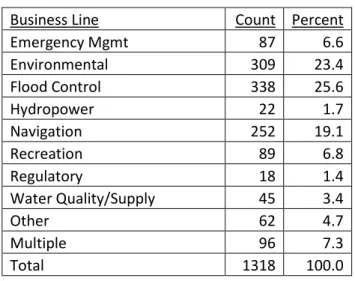
Flood Risk Management customers comprise the largest proportion of the 2014 sample at 26
percent followed by Environmental (23%), Navigation (19%) and Emergency Management,
Recreation and ‘Multiple Business Lines’ (7% each). The proportion of customers in the other
business lines was five percent or less each. Sixteen of the 62 responses categorized as ‘Other’
were International and Interagency Support (IIS) Program customers and eleven had projects
under the ‘Planning Assistance to States’ program. Eight were ‘Real Estate’ customers and five
fell under the ‘Continuing Authorities (CAP) Program. Specific project types for these customers
are displayed in Table 5. The ‘Other’ slice of the following pie chart shows ‘Regulatory’,
Table 4: Primary Business Lines
Business Line
Count Percent
Emergency Mgmt
87
6.6
Environmental
309
23.4
Flood Control
338
25.6
Hydropower
22
1.7
Navigation
252
19.1
Recreation
89
6.8
Regulatory
18
1.4
Water Quality/Supply
45
3.4
Other
62
4.7
Multiple
96
7.3
Total
1318
100.0
Table 5: ‘Other’ Business Lines
Business Line - Other
Count Percent
Agriculture
1
1.6
CAP
5
8.1
Environmental/Regulatory
2
3.2
Everglades Restoration
1
1.6
Grant
1
1.6
IIS
10
16.1
IIS, Transportation
1
1.6
IIS, Environmental
5
8.1
Irrigation
1
1.6
PAS
11
17.7
Real Estate
8
12.9
Road Repair
1
1.6
Sec 111 CAP/Regulatory
1
1.6
Section 202
1
1.6
Section 594
1
1.6
Silver Jackets
3
4.8
Technical Services (Sec 22)
1
1.6
Technical Svcs (MS4 outfall survey)
1
1.6
Transfer Recipient
1
1.6
Transportation
2
3.2
Watershed Study
4
6.5
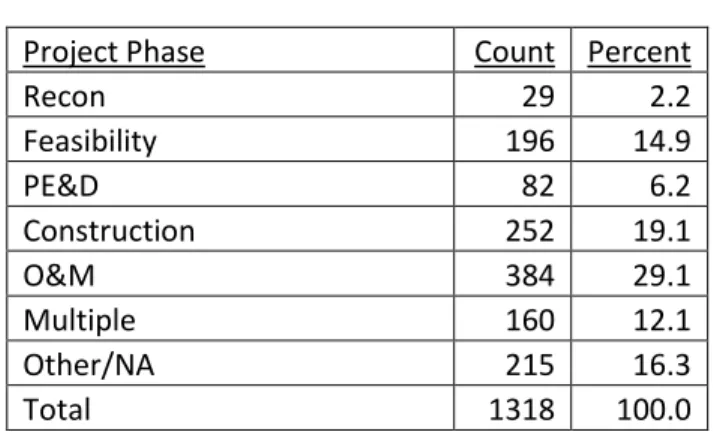
Project Managers were asked to identify the phase of their projects. The largest proportion of
Corps Civil Works projects were in O&M phase (29%), followed by Construction (19%), and
Feasibility (15%). Six percent was in Planning, Engineering & Design (PE&D) and only two
percent in the Reconnaissance phase. The remainder were either ‘multiple project customers’
or their project did not conform to standard Corps Civil Works project phases.
Table 6: Project Phases
Project Phase
Count Percent
Recon
29
2.2
Feasibility
196
14.9
PE&D
82
6.2
Construction
252
19.1
O&M
384
29.1
Multiple
160
12.1
Other/NA
215
16.3
Total
1318
100.0
Civil Works customers are comprised of a wide variety of state and local agencies. The vast
majority are City and county governments and various governmental departments charged with
the management of infrastructure relating to water resources. For example, there were
numerous departments of public works, water management districts, water and sewer
authorities and departments of parks and recreation. Navigation customers included local port
authorities and waterway user groups. There were also a number of state agencies charged
with the management of natural resources and emergency response. Several districts included
Interagency International Support customers (IIS) such as Coast Guard and other federal
agencies. A complete listing of specific customer organizations for each district is provided as
Appendix C.
§2.2 SURVEY ITEMS AND SCALES
The Corp Civil Works Program encompasses numerous types of projects. Civil Works projects
include construction as well as O&M services. Environmental projects may range from habitat
restoration to storm-water infrastructure improvement. Other Civil Works projects include
municipal or regional water supply, hydropower, flood control and emergency management
services.
Because of this wide range of services it is not possible to assess specific services in a
comprehensive survey such as this. Instead customers are asked to rate Corps district
performance in general service areas such as quality of products and services, timeliness, cost,
communications, staff performance and problem solving. A number of these items assess the
quality of collaboration between the customers and Corps staff.
There are 24 questionnaire items which measure general areas of customer satisfaction. Items
are rated on a scale from 1-5
3. The items are grouped into eight scales: ‘Attitude’, ‘Products and
Services’, ‘Corps Staff’, ‘Timely Service’, ‘Cost and Affordability’, ‘Communication’, ‘Problem
Solving’ and ‘Overall Satisfaction’. The ‘Problem Solving’ scale was newly added to the 2007
survey. In addition a Composite Index score was calculated for each respondent. This value is a
simple unweighted average of the 24 satisfaction indicators.
All data summary tables in this report show the number of valid responses for each survey item
i.e., the percentage of responses of all participants who answered the question. Since
customers can elect to skip survey items or select ‘NA’, the totals for each item summary may
not be the same as the total number of survey participants.
The per-item response rate was very high, i.e., few customers left items blank. In fact, all but
three items received ratings from at least 89 percent of the sample of 1,318 respondents. The
exceptions to this were in the area of cost/financial services where 26-27% of customers did
not provide ratings. All item and scale means can be evaluated based on the classification
scheme:
Mean ≥ 4.00: Green
3.00 ≤ Mean ≤ 3.99: Amber
Mean < 3.00: Red
All scale means this year were ‘Green’. The mean Composite score was high at 4.35. The highest
rated service area was Staff services at 4.51. The following table depicts mean scores for each
customer satisfaction scale. Mean scores for individual items can be found in Appendix B Table
B-1.
3
Table 7: Survey Scales
Survey Scales
USACE Avg
Attitude
4.41
Services
4.35
Staff
4.51
Timeliness
4.14
Cost
4.12
Communication
4.40
Problem Resolution
4.29
Overall
4.36
Composite Index
4.35
For purposes of the following discussion, response categories ‘1’ (‘Very Dissatisfied’) and ‘2’
(‘Dissatisfied’) will be collapsed together and referred to as the ‘Low’ category representing
negative responses. Similarly, categories ‘4’ (‘Satisfied’) and ‘5’ (‘Very Satisfied’) will be
collapsed and designated the ‘High’ category, representing positive responses. A score of ‘3’
labeled ‘Neutral’ in the survey may be interpreted as mid-range or noncommittal. Table 8
displays the distribution of responses for each individual survey item. The first column beneath
each response category represents the frequency or number of responses and the second
column shows the percentage of valid responses
4. Detailed responses to these indicators
(before collapsing categories) are displayed in Table B-1 of Appendix B so extreme responses
can be identified (‘Very Low’ or ‘Very High’).
The majority of responses (72 percent or more) were positive for all survey questions. The
services that received the highest proportion of positive ratings in this year’s survey were
Three of the items in the survey serve as ‘bottom line’ indicators of customer satisfaction. They
are Items S22: ‘Your Overall Level of Customer Satisfaction’, S23: ‘I Would Recommend the
Corps’ and S24: ‘Would be Your Choice for Future Services’. These items received at least 83
percent satisfactory ratings while only four percent of customers provided low ratings. Notably,
13 percent of customers fell in the ‘Neutral’ category for S24: ‘Would Choose the Corps for
Future Work’. These noncommittal customers represent a critical subgroup of customers that
warrant attention. Customers may migrate to either the satisfied or dissatisfied category
depending on their future experiences with the Corps organization serving them. These bottom
line indicators are relatively unchanged compared to last year.
4
If customers select NA or fail to rate an item, the number of valid responses will be less than the total number of respondents (1,318).
Table 8: Item Ratings
Survey Items
Low
Mid-range
High
Total
Attitude
#
%
#
%
#
%
#
%
S1
Customer Focus
54
4.1
65
5.0 1187 90.9 1306 100.0
S2
Listening to My Needs
48
3.7
54
4.1 1201 92.2 1303 100.0
S3
Reliability
71
5.4
93
7.1 1139 87.4 1303 100.0
S4
Treats Me as Team Member
43
3.3
67
5.2 1182 91.5 1292 100.0
S5
Flexible to My Needs
76
5.9
103
8.0 1111 86.1 1290 100.0
Services
S6
Quality Products
44
3.5
83
6.7 1116 89.8 1243 100.0
S7
Satisfying My Requirements
54
4.5
114
9.5 1033 86.0 1201 100.0
Staff
S8
Responsiveness
44
3.4
60
4.6 1198 92.0 1302 100.0
S9
Technical Competency
16
1.2
51
3.9 1226 94.8 1293 100.0
S10
Managing Effectively
61
4.8
95
7.4 1120 87.8 1276 100.0
Timeliness
S11
Timely Service
99
7.7
151
11.8 1035 80.5 1285 100.0
S12
Meets My Schedule
87
6.9
181
14.3
996 78.8 1264 100.0
Cost
S13
Financial Info
36
3.7
136
14.1
790 82.1
962 100.0
S14
Cost of Services
79
8.3
188
19.6
690 72.1
957 100.0
S15
Focus on My Budget
58
5.9
153
15.6
769 78.5
980 100.0
Communication
S16
Keeps Me Informed
49
3.8
117
9.0 1130 87.2 1296 100.0
S17
Corps' Documents
29
2.3
79
6.3 1153 91.4 1261 100.0
S18
Corps' Correspondence
30
2.3
87
6.8 1167 90.9 1284 100.0
Problem-Solving
S19
Notifies Me of Problems
47
3.8
100
8.0 1101 88.2 1248 100.0
S20
Timeliness Addressing
Problems
74
5.9
124
9.8 1062 84.3 1260 100.0
S21
Problem Resolution
73
5.8
127
10.1 1059 84.1 1259 100.0
Overall
S22
Overall Satisfaction
54
4.2
71
5.5 1171 90.4 1296 100.0
S23
I Recommend the Corps
45
3.6
122
9.9 1069 86.5 1236 100.0
S24
My Choice for Future Work
51
4.3
148
12.6
978 83.1 1177 100.0
Green: Greatest Proportion of High Ratings
§2.3 CUSTOMER COMMENTS
The survey instrument includes a blank ‘explanation’ field for each item. Customers can use this
field to elaborate on their ratings. They were particularly encouraged to explain any low ratings
(‘Dissatisfied’ or ‘Very Dissatisfied’). In addition customers had the opportunity to provide
general comments or suggestions concerning Corps services at the end of the survey. All
comments should be reviewed carefully for two reasons. First, survey participants rarely take
the time to offer comments and when they do, they feel strongly about the issue they are
addressing. And secondly, customers often provide very detailed and useful information on
how Corps services can be improved.
A very large number of respondents submitted comments (768 of 1318 or 58%). Many
customers addressed individual survey items as well as providing comments in the General
Comments section at the end of the survey. Each respondent’s entire set of comments was
evaluated for its overall tenor. Of the 768 customers who provided comments 67 percent (513)
provided overall favorable comments, 123 (16%) made negative comments and 89 (12%)
customers’ comments contained mixed information (positive and negative statements). A small
number of customer comments (43 customers) were neither positive nor negative but were
informational in nature only (e.g. description of project details).
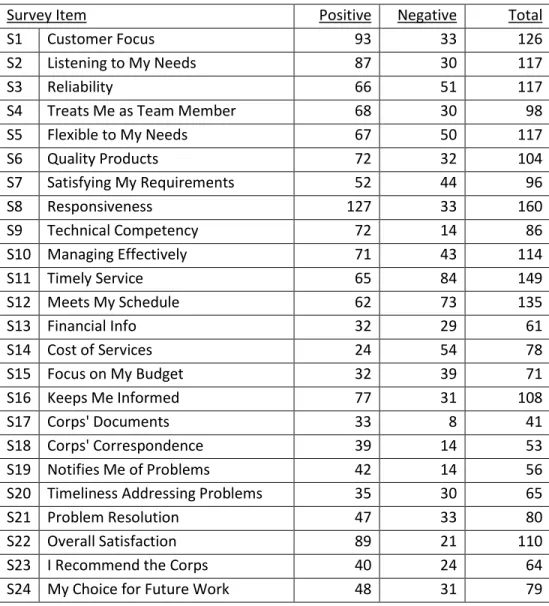
The survey item that received the greatest number of positive comments was ‘Responsiveness’
(127 customers) followed by ‘Customer Focus’ (93 customers). The two items that received the
largest number of negative comments concerned cost and timeliness: ‘Timely Service’ (84),
‘Meets My Schedule’ (73 customers). A similar pattern is seen in the ‘General Comments’
submitted by customers.
The most frequent positive general comments were ‘Compliments to individuals/staff’ (239
customers). A large number of positive comments concerned the relationship/partnership
between the customer and district staff (105 customers). There were also a significant number
of positive comments about the professionalism and personal commitment of Corps staff.
The issue that received the greatest number of negative comments concerned Corps
‘bureaucracy’ or policy/requirements and the negative impact on project cost, timeliness,
district flexibility, or overall project execution (49 customers). A total of 36 customers stated
that lack of federal funding impacted their projects. Project delays were often due to lack of
federal funding and Corps ‘bureaucracy’. These were the most common issues last year as well.
A total of twelve customers expressed concern over ‘staff continuity or turnover’ and likely
related effects on communication. This issue was first raised in 2010 and continues to be of
concern to Civil Works customers through the current survey period. A summary of all
comments is shown below. Note that the total number of comments exceeds 768 as most
customers mentioned several issues.
Table 9: Item Comments
Survey Item
Positive
Negative
Total
S1
Customer Focus
93
33
126
S2
Listening to My Needs
87
30
117
S3
Reliability
66
51
117
S4
Treats Me as Team Member
68
30
98
S5
Flexible to My Needs
67
50
117
S6
Quality Products
72
32
104
S7
Satisfying My Requirements
52
44
96
S8
Responsiveness
127
33
160
S9
Technical Competency
72
14
86
S10
Managing Effectively
71
43
114
S11
Timely Service
65
84
149
S12
Meets My Schedule
62
73
135
S13
Financial Info
32
29
61
S14
Cost of Services
24
54
78
S15
Focus on My Budget
32
39
71
S16
Keeps Me Informed
77
31
108
S17
Corps' Documents
33
8
41
S18
Corps' Correspondence
39
14
53
S19
Notifies Me of Problems
42
14
56
S20
Timeliness Addressing Problems
35
30
65
S21
Problem Resolution
47
33
80
S22
Overall Satisfaction
89
21
110
S23
I Recommend the Corps
40
24
64
S24
My Choice for Future Work
48
31
79
Table 10: Additional Comments
Additional Comments
Positive Negative
Staff
239
1
Relationship / Partnership
105
7
Professionalism
54
0
Communications
29
16
Field Office Support
15
0
Navigation Services
13
9
Dredging Services
11
4
Emergency Management
11
1
Improvement in Services
11
1
FRM Services
11
0
Silver Jackets
10
0
Regulatory Services/ Permits
8
16
Dredge Material Disposal Process / Sites
8
7
Planning Services
8
3
Collaboration
8
2
Recreation Facilities
6
0
Inter-Agency Coordination (Project partners)
5
2
Levee Inspection
5
1
Proactive
4
7
Operations Services
4
3
Status Reports
3
3
Water Supply Projects
3
2
Construction Services
3
1
Environmental Services
3
1
PDT Meetings / Teleconferences
3
0
Staff Continuity / Turnover
2
12
Ecosystem Restoration
2
3
Civil Works Transformation/Smart Planning
2
2
Cultural resources
2
2
Salmon Recovery Activities
2
2
Bridge Project
2
1
Beach Nourishment Services
2
1
District Support
2
1
Feasibility Study Process
2
1
Community Satisfaction
2
0
H&H
2
0
Additional Comments
Positive Negative
Reservoir / Water Level Mgmt
2
0
Shore protection
2
0
Sr Mgmt Support
2
0
HQ Support
1
8
Real Estate Services
1
8
Project Closeout / Punch-list Items
1
2
CECW Customer Survey
1
1
Technical Knowledge
1
1
Cost Estimating
1
0
Flood fight
1
0
PAS Program
1
0
Section 106 Program
1
0
Site Inspection
1
0
Waste Water Needs
1
0
COE Bureaucracy - Impact on Project
0
49
Federal Funding / Process
0
36
Review Process
0
10
Workload Management
0
8
Corps Policy / Requirements
0
6
Project Progress
0
6
408 Process
0
5
A/E (Contractor) Services
0
4
Contracting Process (esp Bidding)
0
4
Accountability
0
3
Cost sharing issues
0
3
Financial actions (Invoicing, reimbursement)
0
3
LERRD's
0
3
OH Charges
0
3
Acronyms / Corps-speak
0
2
INTRA-Agency Coordination (w/in district)
0
2
Levee maintenance
0
2
PPA Model
0
2
CAP Program
0
1
Congressional support
0
1
Corps Process
0
1
DrChecks
0
1
FPMS
0
1
Legal Services
0
1
Mitigation Costs
0
1
Additional Comments
Positive Negative
Section 214
0
1
Section 206 Program
0
1
Section 592 Program
0
1
Section 219 Program
0
1
Small Project Work
0
1
§3.0 Comparisons of Ratings by Customer Subgroups
Consistency in delivery of services is an important strategic goal. To assess the extent to which
we accomplish this goal we should determine whether we provide quality services across
various customer subgroups. These subgroup breakdowns include respondent classification
(customer vs stakeholder), business lines and project phases. Comparative analyses were
conducted to detect whether there were any specific customer subgroups that might be more
or less satisfied than others so that management may directly target the source of good or poor
performance. These analyses can reveal any hidden pockets of very satisfied or dissatisfied
customers that may be obscured in the aggregation of Corps-wide ratings.
§3.1 Ratings by Respondent Classification
The first analysis compares customer satisfaction ratings by respondent classification. Many
district staff expressed that they expected to receive lower ratings from stakeholders than
customers. This expectation was again not supported by the data. Ratings for all items, scales
and the Composite Index were examined. Fewer differences in rating were found in 2014
compared to 2012-13. In fact, there were no statistically significant differences in ratings for
any of the eight satisfaction scales or the Composite Index. Furthermore, no mean scores fell
below ‘Green’ for either subgroup.
Similarly unlike 2013 the comparison of item ratings revealed no statistically significant
differences in ratings for any services area. And mean subgroup scores were green for all survey
items except one. ‘Cost of Services’ was ‘Amber’ for both respondent classes. Detailed tables
presenting mean ratings and sample sizes by Respondent class is located in Appendix B, Table
B-2.
Table 11: Ratings by Respondent Classification
Scale
Statistically Significant Differences
Attitude
None
Services
None
Staff
None
Timeliness
None
Cost
None
Communication
None
Problem Solving
None
Overall
None
Composite Index
None
§3.2 Ratings by Business Line
The second analysis compares customer satisfaction ratings by Civil Works business lines.
Originally there were eight business line categories plus an ‘Other’ and a ‘Multiple’ category.
Since some business line categories contain relatively few customers it was necessary to
combine categories to perform statistical comparisons. Hydropower, Regulatory and ‘Other’
were combined into one category designated ‘Other’. Hence, the categories for comparative
analyses are: Environmental (Env), Flood Risk Management (FRM), Navigation (Nav), Recreation
(Rec), Water Quality/Supply (WQual), Multiple Business Lines (Mult) and ‘Other’. Recall
customers who selected ‘Other’ specified projects under the Planning Assistance to States
program, IIS support or received atypical or specialized services.
Ratings for all scales and the Composite Index were examined. Statistically significant
differences
5in ratings were found for four of the eight satisfaction scales. They included
‘Services, ‘Staff’, ‘Cost’ and ‘Composite Index’. The pattern of the comparisons this year was
definitive. Emergency Management customers were consistently the least satisfied while
Navigation, Recreation and Multi-Business Line customers tended to be more satisfied. With
respect to ‘Products and Services’, Environmental, Flood Risk Management, Navigation,
Recreation and Multi-Business Line customers were significantly more satisfied than Emergency
Management customers. Regarding ‘Staff Competency’, Flood Risk Management, Navigation,
Recreation and Multi-Business Line customers were significantly more satisfied than Emergency
Management customers. As far as ‘Cost’, customers in every business line except Water
Quality/Supply were more satisfied Emergency Management customers. ‘Other’ customers’
ratings of ‘Cost’ exceeded Environmental as well. Finally, the analysis of the Composite Index
revealed that ‘Navigation’, ‘Recreation’ and ‘Multi-Business Line’ were more satisfied than
Emergency Management customers.
The implications of these results regarding Emergency Management and ‘Multiple Project’
customers are important. On the positive side ‘Multiple business line’ customers are typically
key customers who have significant financial impact and long standing relationships with the
district. Hence it is a positive outcome that these customers are among the most satisfied. On
the other hand, the fact that Emergency Management customers are less satisfied may be of
concern as their projects tend to be high profile and may affect public perceptions about the
Corps.
It is important to note that, although a number of significant differences in ratings were found,
there were only two instances where any mean score fell below ‘Green’. The first was in
‘Timeliness’ where the Water Quality/Supply mean rating was ‘Amber’; the second in ‘Cost’
where the Emergency Management mean score was ‘Amber’. A detailed table presenting mean
ratings and sample sizes by business line is located in Appendix Table B-3. An examination of
this table demonstrates that there are many subgroup scores that are very close to ‘Amber’ in
the areas of cost and timeliness.
5
Table 12: Ratings by Business Line
Scale
Statistically Significant Differences
Services
Env, FRM, Nav, Rec & Multi > EM
Staff
FRM, Nav, Rec & Multi > EM
Cost
Env, FRM, Nav, Rec, Other & Multi > EM
Composite
Nav, Rec & Multi > EM
§3.3 Ratings by Project Phase
Comparisons of mean scale scores by project phase were performed to assess the impact of
customers’ project phase on ratings. Project phases included Reconnaissance, Feasibility,
Planning Engineering and Design (PE&D), Construction, Operations and Maintenance (O&M)
and ‘Multiple Phases’. Unlike previous years, statistically significant differences in ratings were
found for only three scales. Customers whose projects were in Recon and O&M phases were
significantly more satisfied. Feasibility, Construction and Multiple Phase customers were
significantly less satisfied. Recon and O&M customers are consistently the most satisfied while
Feasibility and Construction customers consistently the least satisfied year to year.
There was only one instance where a subgroup mean fell below ‘Green’. Multiple-phase
customers mean score was Amber for Timeliness. Additionally ‘Construction’ customers’ score
was very close to Amber for ‘Timeliness’. Subgroup mean scores were close to Amber in the
‘Cost’ area for all phases except Recon and O&M as well. Table B-4 in Appendix B displays mean
subgroup scores and sample sizes by project phase.
Table 13: Ratings by Project Phase
Scale
Statistically Significant Differences
Timeliness
Recon > Feas, Constr & Multi
O&M > Constr & Multi
Overall
Recon > Feas, Constr & Multi
O&M > Feas, Constr & Multi
Recon > Constr & Multi
§3.4 Comparisons of Ratings by Year
The CECW Survey has been conducted since 2006. The current form of the survey has been in
use since 2007. Tables 14 and 15 display the distribution of responses by business line and MSC
for each year since 2007. The distribution of responses by district is shown in Appendix B, Table
B-5.
Table 14: Customers by Business Line and Year
2007 2008 2009 2010 2011 2012 2013 2014 Business Line # % # % # % # % # % # % # % # % EM 17 1.6 35 2.4 56 3.5 99 4.9 142 7.7 76 4.4 116 7.8 87 6.6 Env 303 28.6 338 23.3 477 29.6 600 29.5 502 27.4 464 26.7 344 23.0 309 23.4 FRM 328 31.0 498 34.3 445 27.6 524 25.7 468 25.5 433 24.9 411 27.5 338 25.6 Hydro 16 1.5 19 1.3 13 0.8 23 1.1 22 1.2 26 1.5 23 1.5 22 1.7 Nav 189 17.9 263 18.1 298 18.5 343 16.9 293 16.0 319 18.3 259 17.3 252 19.1 Re 22 2.1 21 1.4 57 3.5 104 5.1 92 5.0 93 5.3 104 7.0 89 6.8 Reg 10 0.9 7 0.5 3 0.2 9 0.4 10 0.5 11 0.6 12 0.8 18 1.4 WaterQual 87 8.2 159 10.9 120 7.4 112 5.5 110 6.0 114 6.5 66 4.4 45 3.4 Other 86 8.1 64 4.4 58 3.6 122 6.0 101 5.5 115 6.6 80 5.3 62 4.7 Multiple 0 0.0 49 3.4 84 5.2 99 4.9 95 5.2 90 5.2 81 5.4 96 7.3 Total 1058 100.0 1453 100.0 1611 100.0 2035 100.0 1835 100.0 1741 100.0 1496 100.0 1318 100.0
Table 15: Customers by MSC and Year
2007 2008 2009 2010 2011 2012 2013 2014 MSC # % # % # % # % # % # % # % # % LRD 238 22.5 225 15.4 301 18.6 318 15.5 264 14.4 297 17.1 228 15.2 226 17.1 MVD 169 15.9 448 30.7 526 32.6 821 40.1 564 30.7 491 28.2 408 27.3 393 29.8 NAD 94 8.9 127 8.7 125 7.7 117 5.7 150 8.2 128 7.4 126 8.4 101 7.7 NWD 120 11.3 129 8.8 183 11.3 320 15.6 387 21.1 367 21.1 292 19.5 249 18.9 POD 27 2.5 32 2.2 38 2.4 30 1.5 54 2.9 47 2.7 35 2.3 34 2.6 SAD 204 19.2 206 14.1 185 11.5 178 8.7 151 8.2 151 8.7 161 10.8 105 8.0 SPD 113 10.7 165 11.3 155 9.6 160 7.8 150 8.2 148 8.5 140 9.4 108 8.2 SWD 95 9.0 127 8.7 101 6.3 102 5.0 115 6.3 112 6.4 106 7.1 102 7.7 Total 1060 100.0 1459 100.0 1614 100.0 2046 100.0 1835 100.0 1741 100.0 1496 100.0 1318 100.0
This year’s trend analyses assess the change in ratings from 2007 to 2014. Survey scales and
individual items were examined. These analyses revealed that current ratings have improved
for almost all scales and individual items since 2007. Customer ratings showed the greatest
improvement in the area of Timeliness; moving from ‘Amber’ to ‘Green’. There were
statistically significant differences in mean scores for every scale except ‘Attitude’. Ratings were
found to be consistently significantly higher in 2013 and 2014 compared to 2007 and 2008
6.
And ratings for 2013 -14 were in many instances higher than those received during the entire
2007-1010 survey periods.
There were twenty instances of significant differences among the 24 individual survey items. In
almost all cases ratings during 2013 and 2014 had improved over 2007 and 2008 ratings. Again
in many cases ratings for the previous two years were often higher than the 2007-2010 survey
periods as well. The graphic below displays scale comparisons. Tables B-6 and B-7 in Appendix B
displays mean scale and item scores by survey year.
Table 16: Ratings by Survey Year
Scale
Statistically Significant Differences
Attitude
None
Services
2013 > 2007-09
2014 > 2008
Staff
2013 > 2007, 08
2014 > 2007, 08, 10
Timeliness
2013 > 2007-09
2014 > 2007-10
Cost
2013 & 2014 > 2007-10
Communication
2013 & 2014 > 2007, 08, 10
Problem Solving
2013 > 2007, 08, 10
2014 > 2007, 08
Overall
2013 > 2007-08
2014 > 2007-10
INDEX
2013 & 2014 > 2007-10
6
§4. SUMMARY
This report summarizes the results of the Corps of Engineers Civil Works Programs Directorate
Customer Satisfaction Survey for calendar year 2014. The CECW Survey population was
expanded in 2010 to include stakeholder agencies in addition to ‘traditional’ customers. The
purpose for this modification was to improve collaboration among all project participants.
Stakeholder agencies are not direct recipients of Corps services but participate in the project
execution process (e.g. state& federal regulatory agencies, municipal water resource offices
etc.). Their staff interacts with Corps staff and participates to a significant degree in project
planning, oversight and execution.
The standardized 2014 Civil Works Programs Customer Survey instrument consists of two
sections. The first section solicits customer demographic information (customer name,
organization, project name and district evaluated). Section two contains 24 satisfaction
questions in a structured response format in which customer satisfaction is measured on a
5-point Likert scale: ‘Very Dissatisfied’ (1), ‘Dissatisfied’ (2), ‘Neutral’ (3), ‘Satisfied’ (4) and ‘Very
Satisfied’ (5). A blank explanation field solicits customer comments in each service area. The
final portion of the survey solicits general customer comments.
The Corps of Engineers Civil Works Program customer base included 2,760 customers; an eight
percent decrease compared to last year. There was notable variability among district
population sizes. Population sizes ranged from as few as N=17 for Honolulu District to a high of
N=193 for Walla Walla District.
A total of 1,303 unique customers participated in the 2014 survey. Many customers have
multiple projects within a district. A few of these elected to submit more than one survey
response to evaluate projects separately. Hence, the database used in these analyses contains
1,318 records.
The number of unique customer responses was used to calculate response rates. The
Corps-wide response rate was 47 percent for an estimated sampling error of 1.6 percent. Response
rates varied among districts, ranging from 15 percent for Philadelphia District to as high as 100
percent for Kansas City District. The average response rate was 51 percent for larger (Tier I)
districts and 46 percent for smaller (Tier II) districts. Classification of districts as Tier I or II is
based on actual FY14 district program size ($).Tier I districts had a program size of at least $100
million while Tier II districts had program sizes less than $100 million in FY14.
The survey included all Civil Works Districts. These districts work within the eight CONUS Corps
Divisions. The districts within TransAtlantic Division as well as Europe, Far East and Japan
Districts did not participate as they do not have a Civil Works mission. The greatest proportion
of responses was received from customers served by the Mississippi Valley Divisions (MVD) at
30 percent followed by Northwest Division (NWD) at 19 percent and Great Lakes-Ohio River
(LRD) at 17 percent. New Orleans District had the highest number of responses among districts
at ten percent of the Corps-wide sample followed by St. Louis at seven percent.
USACE Civil Works customers are categorized by their
primary
category of service aligned to
the Civil Works Program business lines. Civil Works business lines include: Emergency
Management, Environmental, Flood Risk Management, Hydropower, Navigation, Recreation,
Regulatory and Water Quality/Supply. A significant number of customers had multiple projects
underway at their district and could not be classified under a single business line. An additional
category was created to accommodate the ‘Multiple Business Line’ customers.
Flood Risk Management customers comprise the largest proportion of the 2014 sample at 26
percent followed by Environmental (23%), Navigation (19%) and Emergency Management,
Recreation and ‘Multiple Business Lines’ (7% each). The proportion of customers in the other
business lines was five percent or less each. Sixteen of the 62 responses categorized as ‘Other’
were International and Interagency Support (IIS) Program customers and eleven had projects
under the ‘Planning Assistance to States’ program. Eight were ‘Real Estate’ customers and five
fell under the ‘Continuing Authorities (CAP)
Project Managers were asked to identify the phase of their projects. The largest proportion of
Corps Civil Works projects were in O&M phase (29%), followed by Construction (19%), and
Feasibility (15%). Six percent was in Planning, Engineering & Design (PE&D) and only two
percent in the Reconnaissance phase. The remainder were either ‘multiple project customers’
or their project did not conform to standard Corps Civil Works project phases.
Civil Works customers are comprised of a wide variety of state and local agencies. The majority
include City and county governments and various governmental departments charged with the
management of infrastructure relating to water resources. For example, there were numerous
departments of public works, water management districts, water and sewer authorities and
departments of parks and recreation. Navigation customers included local port authorities and
waterway user groups. There were also a number of state agencies charged with the
management of natural resources and emergency response. Several districts included
Interagency International Support customers (IIS) such as Coast Guard and other federal
agencies.
The Corp Civil Works Program encompasses numerous types of projects. Civil Works projects
include construction as well as O&M services. Environmental projects may range from habitat
restoration to storm-water infrastructure improvement. Other Civil Works projects include
municipal or regional water supply, hydropower, flood risk management and emergency
management services. Because of this wide range of services it is not possible to assess specific
services in a comprehensive survey such as this. Instead customers are asked to rate Corps
district performance in general service areas such as quality of products and services,
timeliness, cost, communications, staff performance and problem solving. A number of these
items assess the quality of collaboration between the customers and Corps staff.
There are 24 questionnaire items which measure general areas of customer satisfaction. Items
are rated on a scale from 1-5
7. The items are grouped into eight scales: ‘Attitude’, ‘Products and
Services’, ‘Corps Staff’, ‘Timely Service’, ‘Cost and Affordability’, ‘Communication’, ‘Problem
Solving’ and ‘Overall Satisfaction’. The ‘Problem Solving’ scale was newly added to the 2007
survey. In addition a Composite Index score was calculated for each respondent. This value is a
simple unweighted average of the 24 satisfaction indicators.
The per-item response rate was very high, i.e., few customers left items blank. In fact, all but
three items received ratings from at least 89 percent of the sample of 1,318 respondents. The
exceptions to this were in the area of cost/financial services where 26-27% of customers did
not provide ratings. All item and scale means can be evaluated based on the classification
scheme:
Mean ≥ 4.00: Green
3.00 ≤ Mean ≤ 3.99: Amber
Mean < 3.00: Red
All scale means this year were ‘Green’. The mean Composite score was high at 4.35. The highest
rated service area was Staff services at 4.51. The following table depicts mean scores for each
customer satisfaction scale.
The majority of responses (72 percent or more) were positive for all survey questions. The
services that received the highest proportion of positive ratings in this year’s survey were
‘Technical Competency’ at 95 percent high ratings and ‘Listening to My Needs’ and ‘Treats Me
as an Important Team Member’ and ‘Responsiveness’ at 92 percent high ratings each. The
items that elicited the greatest proportion of low ratings were ‘Cost of Services’ and ‘Timely
Services’ at eight percent low ratings each and ‘Meets My Schedule’ at seven percent low
ratings.
Three of the items in the survey serve as ‘bottom line’ indicators of customer satisfaction. They
are Items ‘Your Overall Level of Customer Satisfaction’, ‘I Would Recommend the Corps’ and
‘Would be Your Choice for Future Services’. These items received at least 83 percent
satisfactory ratings while only four percent of customers provided low ratings. Notably, 13
percent of customers fell in the ‘Neutral’ category for ‘Would Choose the Corps for Future
Work’. These noncommittal customers represent a critical subgroup of customers that warrant
attention. Customers may migrate to either the satisfied or dissatisfied category depending on
their future experiences with the Corps organization serving them. These bottom line indicators
are relatively unchanged compared to last year.
The survey instrument includes a blank ‘explanation’ field for each item. Customers can use this
field to elaborate on their ratings. They were particularly encouraged to explain any low ratings
(‘Dissatisfied’ or ‘Very Dissatisfied’). In addition customers had the opportunity to provide
7
general comments or suggestions concerning Corps services at the end of the survey. All
comments should be reviewed carefully for two reasons. First, survey participants rarely take
the time to offer comments and when they do, they feel strongly about the issue they are
addressing. And secondly, customers often provide very detailed and useful information on
how Corps services can be improved.
A very large number of respondents submitted comments (768 of 1318 or 58%). Many
customers addressed individual survey items as well as providing comments in the General
Comments section at the end of the survey. Each respondent’s entire set of comments was
evaluated for its overall tenor. Of the 768 customers who provided comments 67 percent (513)
provided overall favorable comments, 123 (16%) made negative comments and 89 (12%)
customers’ comments contained mixed information (positive and negative statements). A small
number of customer comments (43 customers) were neither positive nor negative but were
informational in nature only (e.g. description of project details).
The survey item that received the greatest number of positive comments was ‘Responsiveness’
(127 customers) followed by ‘Customer Focus’ (93 customers). The two items that received the
largest number of negative comments concerned cost and timeliness: ‘Timely Service’ (84),
‘Meets My Schedule’ (73 customers). A similar pattern is seen in the ‘General Comments’