A Research Note On The Issue
Of Non-Articulation And The Method Used
To Calculate Net Operating Cash Flow
Terry J. Ward, Middle Tennessee State University, USA Jon Woodroof, University of Tennessee, USA Benjamin P. Foster, University of Louisville, USA
ABSTRACT
Using a proxy for nonarticulation, prior researchers found evidence that many companies using the indirect method of reporting net cash flow from operations have a significant level of nonarticulation. The purpose of this study is to determine if companies using the direct method of reporting net cash flow from operations experience significantly lower levels of nonarticulation than companies that use the indirect method of reporting net cash flow from operations. Results show that companies using the direct method have significantly less nonarticulation than companies using the indirect method. This finding suggests that the Financial Accounting Standards Board (FASB) should consider requiring companies to use the direct method of preparing the Statement of Cash Flows.
Keywords: nonarticulation, direct method, indirect method, difference between estimated and reported net operating cash flows as a measure of nonarticulation (DIFF)
1. INTRODUCTION AND PURPOSE OF PAPER
ahnson et al. (1996) found that the amount reported as net operating cash flow on the cash flow statement could not be accurately calculated by applying an indirect approach to published balance sheet and income statement information (adjusting reported net income for non-cash income items and changes in balance sheet items). They concluded that many companies had weak articulation between the published financial statements and that the Financial Accounting Standards Board (FASB) should require companies to use the direct approach in preparing the operating section of the Statement of Cash Flows. This suggestion implies that companies can limit this articulation problem in published financial statements by using the direct method.
While the authors suggested that the direct method of calculating net operating cash flow would lessen the articulation problem, they did not empirically test whether reporting net operating cash flow by the direct method resulted in better articulation.1 Thus, the purpose of this study is to determine if companies using the direct method of reporting net cash flow from operations experience significantly lower levels of nonarticulation than companies that use the indirect method of reporting net cash flow from operations.
For each company in our sample, we compute the difference between net operating cash flows reported on the cash flow statement and net operating cash flow estimated from income statement and balance sheet information. This difference represents a measure of nonarticulation. We then compare these differences from a sample group of companies that used the direct method to the differences from a sample group of companies that used the indirect method of reporting net operating cash flow. Using both t-tests on the differences and logistic regression models with control variables and a proxy variable for nonarticulation we are able to determine how nonarticulation differs between the direct and indirect groups of companies.
Analyses suggest that the articulation problem is much less pronounced for companies using the direct method of reporting net operating cash flow than it is for companies using the indirect method of reporting net operating cash flow. Financial statements of firms using the direct method tend to articulate; direct firms do not
B
have significant differences between reported and estimated operating cash flows. In contrast, results for the indirect firms are consistent with the findings of Bahnson et al. (1996). Indirect firms’ financial statements do not articulate well; the proxy for nonarticulation significantly differs from zero.
Our study’s findings suggest that researchers and standard developers should reopen the direct versus indirect reporting issue for debate. The FASB should consider requiring companies to use the direct approach to report operating cash flows. Although our study provides some evidence that the direct method may lead to better articulation, additional research is needed to better understand the variables impacting this issue.
The next section of this paper reviews literature related to the issue of nonarticulation among financial statements. The following section reviews the indirect versus direct method debate and expresses the hypotheses tested in this study. The next section discusses our research methods. The final sections of the paper present and discuss our results and conclusions.
2. LITERATURE REVIEW
Bahnson et al. (1996) first identified the possibility of nonarticulation among published accounting information. Bahnson et al. examined the issue of articulation among the financial statements by investigating the ability to replicate published net operating cash flow using published balance sheet and income statement information. Applying an indirect approach, the authors derived estimated net operating cash flow by adjusting published income for all noncash items and changes in working capital items. They then compared the estimated net operating cash flow measure with published net operating cash flow.
Differences between estimated and reported net operating cash flows provided evidence of nonarticulation among the published financial statements. Bahnson et al. (1996, 4-5) found major differences between companies' reported net operating cash flows and estimated net operating cash flows, thus suggesting articulation problems. Bahnson et al. (p. 6) also found some problems with Compustat coding of receivables. However, they concluded that Compustat errors had little impact on the overall differences. Consequently, Bahnson et al. (1996, 10-12) recommended that the Financial Accounting Standards Board (FASB) require companies to report operating cash flows under the direct method. Their recommendation suggests that companies using a direct approach to prepare their cash flow statements would have greater articulation among the financial statements.
Krishnan and Largay (2000) obtained a sample of direct firms to investigate whether the gross cash flows reported using the direct method led to more accurate predictions of future operating cash flows than did estimated operating flows calculated from balance sheet and income statement information. They concluded that direct cash flows provide better predictions of future cash flows than estimated cash flows.
In additional analyses, Krishnan and Largay also attempted to determine the amount of measurement error in the estimated gross cash flows when compared to the reported gross cash flows of the direct firms. They compared reported versus estimated (1) cash received from customers and (2) cash paid to suppliers and employees. Krishnan and Largay (2000, 232-233) found that most direct-method companies reported relatively small differences between the two measures. However, some companies reported very large differences. They concluded:
These findings cast doubt on the FASB’s assertions that direct method cash flows can be determined indirectly without incurring burdensome costs (Krishnan and Largay 2000, 234).
Krishnan and Largay (2000, 234-240) conducted supplementary analysis on a sample of indirect-method firms. However, they did not report any data related to articulation between the indirect firms’ financial statements.
Ward et al. (2006) examined whether net operating cash flow as reported (CFFO) produced more useful information than did estimated net operating cash flow (OCF) in explaining future financial distress. When included in financial distress logistic regression models with accrual variables, OCF was not significant, while CFFO was significant for most years tested. Their results further confirmed Bahnson et al.’s (1996) findings that CFFO as
reported on the Statement of Cash Flows differs from OCF as estimated in prior studies. Results showed that large and significant differences exist between OCF and CFFO, and more so for the distressed firms than for the nondistressed firms. OCF is more likely to exceed CFFO by a large amount for distressed firms than for the nondistressed firms.
Ward et al. results also provide evidence supporting the FASB’s decision to require a separate cash flow statement. However, like Bahnson et al. (1996), their results suggest that the FASB should either issue more explicit directions for reporting cash flows from operations or consider requiring the direct method of preparing the operating section of the Statement of Cash Flows.
3. THE INDIRECT VERSUS DIRECT METHOD DEBATE
The debate over cash flow reporting eventually produced a general consensus among financial statement users and researchers that published cash flow information was needed (e.g., Revsine, 1973; Lee, 1978; Lawson, 1978; Largay and Stickney, 1980; Lee, 1981; Sorter, 1982; Gombola and Ketz, 1983; Christie et al., 1984; Casey and Bartczak, 1984 and 1985; Lawson, 1985; Bowen et al., 1986 and 1987; Gombola et al., 1987; and Franz and Thies, 1988). The FASB subsequently addressed the issue of cash flow information and concluded that companies should publish a cash flow statement.
During its deliberations throughout the process of issuing a discussion memo, exposure drafts, and standard (FASB, 1980, 1981, 1986, and 1987), much of the heated debate centered around whether to disclose all major disaggregated operating cash flows or only the aggregated net total operating cash flow. This issue over what to disclose became known as the direct versus indirect approach issue. Although no such indirect approach existed in accounting cash flow theory (it was used primarily in accounting and finance research to arrive at an estimate of operating cash flow using published income statement and balance sheet data), this debate became the focal point of discussions on whether to require companies to publish cash flow information.
The direct versus indirect debate primarily pitted preparers of financial statements against researchers and users of reported financial information. Opponents of the direct method claimed that the direct method would be costly and difficult for some companies, such as financial institutions, to implement and administer (FASB 1987, paragraph 109). However, many commercial lenders asked the FASB to require the direct method (FASB 1987, paragraph 111). Also, two members of the FASB (1987) dissented to the adoption of Statement of Financial Accounting Standards (SFAS) No. 95 because it permitted use of the indirect method. They believed that the indirect method produced less useful information.
In SFAS No. 95, the FASB eventually allowed the indirect approach while stating its preference for the direct approach. Some supplemental disclosure is required for companies adopting the indirect approach. Companies must report taxes paid and interest paid, and provide sufficient disclosure so that companies can indirectly calculate various other operating cash flows such as cash collections of receivables and cash paid to suppliers. Despite the FASB preference for the direct approach, most companies currently use the indirect method to prepare the operating section of the cash flow statement.
Hypotheses
In SFAS No. 95, the FASB (1987, paragraph 108) seems to imply that the indirect method strongly supports articulation between the financial statements:
The principal advantage of the indirect method is that it focuses on the differences between net income and net cash flow from operating activities… Identifying differences between income items and related cash flows also can assist investors and creditors...
However, this statement seems to contradict the logic and theory underlying cash flow reporting. The theory underlying the usefulness of cash flow information supports the belief that the direct method best
demonstrates the articulation among the differing financial statements because of the disaggregated types of data disclosed. The FASB adopted a framework for the Statement of Cash Flows based on the concepts of solvency and financial flexibility developed by Donaldson (1969) and Heath (1978). Ward (1995) subsequently developed a theoretical framework of financial distress based on these concepts. This framework suggests that gross (disaggregated) operating cash flows should be more useful than net (aggregated) cash flows in assessing survivability of a company.
Aggregating across operating categories as permitted under the indirect approach should increase the likelihood of nonarticulation; the greater the aggregation, the greater the loss of information. This belief is consistent with researchers who advocate that accounting reports show less aggregated information when possible (Sorter 1969). Information could be lost or hidden through aggregation.
Based on prior research and theory underlying the Statement of Cash Flows, this study tests the following hypotheses stated in the null form:
H1 (direct mean difference = 0): Companies that use the direct method of reporting operating cash flow information will not
have significant differences between net operating cash flow reported on the cash flow statement and net operating cash flow estimated from income statement and balance sheet amounts.
H2 (indirect mean difference = 0): Companies that use the indirect method of reporting operating cash flow information will
not have significant differences between net operating cash flow reported on the cash flow statement and net operating cash flow estimated from income statement and balance sheet amounts.
H3 (direct mean difference = indirect mean difference): Companies that use the direct method of reporting will not have differences
between reported and estimated net operating cash flows significantly different than those of companies using the indirect method of reporting.
Results consistent with expectations would result in acceptance of H1, rejection of H2, and rejection of H3.
4. SAMPLE AND RESEARCH METHODS
We used key word searches in Compustat Disclosure for the period between 1994 and 1999 to identify an initial list of firms that used the direct method. The 1994 to 1999 period was selected because of two sampling difficulties related to selecting direct firms. One, companies first starting preparing a Statement of Cash Flows in 1988. Waiting until 1994 to collect the data allows for a sufficient period of time to past for companies to get comfortable with the reporting requirements and select either the direct or indirect methods.
Second, only around four percent of companies used the direct method of preparing a Statement of Cash Flows (Edwards et al., 1991), and data bases did not specifically identify which firms used the direct method. Thus, we had to do a key word search in Compustat Disclosure to identify possible direct firms and then review 10K reports to verify whether the company used the direct method. We identify 512 possible direct firms and then reviewed their 10Ks to verify that the firms did indeed use the direct method. This process resulted in forty-five firms being identified. Thus, keeping the data collection period to six years made the task manageable.
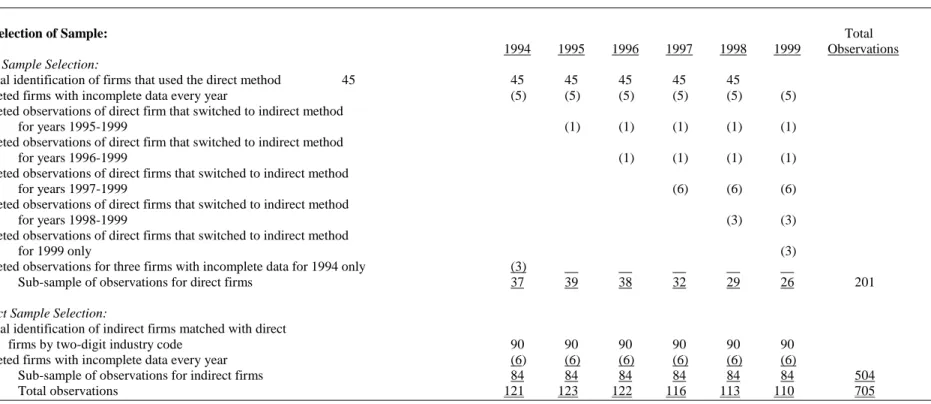
We next matched the direct firms two for one with indirect firms based on two-digit industry codes. Firms with incomplete Compustat data were dropped from the sample. Some of the direct-method firms switched to the indirect method at some point during the period. These firms’ observations were dropped from the point of the switch onward. An additional three direct firm observations were omitted for the 1994 period because of insufficient data for that period only. The final original sample resulted in 121 observations for 1994, 123 for 1995, 122 for 1996, 116 for 1997, 113 for 1998, and 110 for 1999, for a total sample of 705 observations. Table 1 summarizes the sampling process for these firms.
Table 1 Sample Description
I. Selection of Sample: Total
1994 1995 1996 1997 1998 1999 Observations
Direct Sample Selection:
Initial identification of firms that used the direct method 45 45 45 45 45 45
Deleted firms with incomplete data every year (5) (5) (5) (5) (5) (5)
Deleted observations of direct firm that switched to indirect method
for years 1995-1999 (1) (1) (1) (1) (1)
Deleted observations of direct firm that switched to indirect method
for years 1996-1999 (1) (1) (1) (1)
Deleted observations of direct firms that switched to indirect method
for years 1997-1999 (6) (6) (6)
Deleted observations of direct firms that switched to indirect method
for years 1998-1999 (3) (3)
Deleted observations of direct firms that switched to indirect method
for 1999 only (3)
Deleted observations for three firms with incomplete data for 1994 only (3)
Sub-sample of observations for direct firms 37 39 38 32 29 26 201
Indirect Sample Selection:
Initial identification of indirect firms matched with direct
firms by two-digit industry code 90 90 90 90 90 90
Deleted firms with incomplete data every year (6) (6) (6) (6) (6) (6)
Sub-sample of observations for indirect firms 84 84 84 84 84 84 504
Although we omitted observations from the periods in which the direct-method companies had switched to the indirect method, including their initial observations in the sample could still adversely impact results. The fact that these direct firms subsequently switched to the indirect method might contain important information. These firms may have characteristics more similar to the indirect firms than to the direct firms. Thus, to determine any impact on results, all tests were rerun with the direct-method companies that switched methods omitted completely from the sample for all periods. All results were similar to those reported using the original sample.
Variables And Statistical Techniques Used In Study
For each company, we obtained reported net operating cash flow from the cash flow statement and calculated estimated net operating cash flow from income statement and balance sheet amounts. The mean difference (DIFF) between reported and estimated net operating cash flow is the variable of interest in this study. As identified by Bahnson et al. (1996), this difference represents a proxy for nonarticulation among the financial statements. Little difference should occur between reported and estimated net operating cash flow if articulation is strong.
T-tests that the means of DIFF are significantly different from zero were used to test hypotheses one and two. We conducted tests for the entire sample period of 1994 to 1999, with observations pooled across all periods, as well as shorter, partitioned periods. To control for firm size, the difference was scaled by reported net operating cash flow and by firm size. Bahnson et al. scaled the difference between reported net operating cash flow and estimated operating cash flow by reported net operating cash flow. However, this scaling measure can create abnormalities when reported net operating cash flow is negative and/or when it is much smaller than the difference. Because net operating cash flow can vary from a negative to a positive number, it also does not properly control for firm size. To address this concern, we also report results with the differences scaled by total assets. Scaling the difference by total assets should control for firm size and eliminate the abnormalities obtained from scaling by reported net operating cash flow.
To test hypothesis three, we developed two logistic regression models, a base model with control variables and a full model with DIFF added to the base model. The dependent variable is a dichotomous variable based on the method used by the company to calculate net operating cash flow coded as:
METHOD = 0 if firm used the direct method to calculate operating cash flow, and 1 if firm used the indirect method to calculate operating cash flow.
The main independent variable of interest is DIFF, the difference between reported net operating cash flow from the cash flow statement and estimated net operating cash flow calculated from income statement and balance sheet amounts.
The independent control variables are the accruals that make up the adjustments to net income to calculate net operating cash flow. The log of total asset (LTA) was added as a control variable based on it use in prior studies (Ohlson, 1980; Ward and Foster, 1996 and 1997; and Ward et al., 2006). LTA controls for firm size effects. The control variables were coded as follows:
IBC = income before extraordinary items, DPC = depreciation and amortization,
XIDOC = extraordinary items and discontinued operations, TXDC = deferred taxes,
ESUBC = equity in earnings,
SPPIV = gain/losses from sale of property, plant, and equipment and investments, FOPO = other funds from operations,
CHGREC = change in accounts receivable, CHGINV = change in inventory,
CHGAP = change in accounts payable, CHGTXP = change in taxes payable,
CHGOTHCL = change in other current liabilities, and LTA = log(total assets).
Dichotomous Logistic Regression Model
Firms’ observations were used to generate the ordinal four-state regression models and were pooled across the years of the study. The regression models were constructed using dichotomous logistic regression (DLCR). This study employed proportional odds DLCR models. (see, for example, Agresti, 1984 for a discussion of dichotomous logistic regression) This procedure fits a parallel lines regression model based on transformed logits. Suppose the response or dependent variable can take on the values 0 and 1 with
wpredictor variables. Defining Pi
as the probability that a firm is in state i or lower given the vector X = (X
1, X2, ... , Xw) of independent variables,
the logit (L
i) can be estimated as follows:
L i = ln [Pi / (1-Pi)] = a + b1X1 + b2X2 + ... + bwXw, (1) where i = 0 or 1. Then: exp(Li) P i = P(METHOD = i|X) = _____________ (2) 1 + exp(Li), where P
i = the probabilistic predictor, METHOD = method used to create the cash flow statement with levels 0 or 1
(0 = direct method and 1 = indirect method), a is the intercept parameter, and the b
w coefficients represent the effect
of the wth explanatory variable on a firm's probability of ending up in state i or lower.
5. RESULTS
Testing Of H1 And H2
Table 2 reports the means for, DIFF, calculated by taking the difference between reported net operating cash flow and estimated net operating cash flow for each observation scaled by either reported net operating cash flow or by total assets. Table 2 also reports results from t-tests on DIFF. The direct and indirect samples refer to companies that used the direct method or indirect method, respectively, for reporting operating cash flows on their Statement of Cash Flows. T-tests of whether DIFF for indirect firms and direct firms are significantly different from zero provide tests of H1 and H2, respectively.
With both scaling measures, the means for direct companies’ differences are positive and not significantly different from zero. However, the means for the indirect companies’ differences are negative and differ significantly from zero (p-value < .05). The negative signs for the means suggest that estimated net operating cash flow is normally overstated (higher than reported net operating cash flow) for the indirect firms, resulting in higher estimated cash flow calculations. As anticipated, these results lead to accepting H1 and rejecting H2.
Table 2
Tests of Differences (DIFF) for Estimated and Reported Net Operating Cash Flows: Direct and Indirect Samples of Firms
Panel 1 - Scaled by reported operating cash flow:
1
Sample 2Means for DIFF T Statistic Prob > | T|
Direct (n=201 observations) 1.7545 1.00 0.31
Indirect (n=504 observations) -1.0096 -1.90 0.05
Panel 2 - Scaled by total assets:
Sample Means for DIFF T Statistic Prob > | T|
Direct (n=201 observations) 0.0026 0.73 0.46
Indirect (n=504 observations) -0.0071 -3.32 0.00
1
The Direct Sample is composed of firms that used the direct method of reporting Statement of Cash Flows from 1994 to 1999. The Indirect Sample is composed of firms that used the indirect method of reporting Statement of Cash Flows from 1994 to 1999. The indirect-method firms were matched by two-digit industry code with the direct-method firms.
2
DIFF is the difference between reported net operating cash flow from the cash flow statement and estimated net operating cash flow calculated from income statement and balance sheet amounts.
The results reported in Table 2 are pooled across the 1994-1999 period. However, results may not be consistent across this period. As companies became more accustomed to the Statement of Cash Flows, articulation problems may have decreased. Thus, to determine whether results are consistent across the entire period, we reran tests of the differences with the sample partitioned into three periods. Table 3 shows results when the sample is partitioned into the periods 1994-1995, 1996-1997, and 1998-1999.
Table 3
Tests of Differences for Estimated and Reported Net Operating Cash Flows: Direct and Indirect Samples of Firms Partitioned by Three Periods, 94-95, 96-97, and 98-99.
1994-95 Period 1996-97 Period 1998-99 Period
(n=244 observations) (n=238 observations) (n=223 observations
DIFF DIFF DIFF
Sample Mean Prob > | T| Mean Prob > | T| Mean Prob > | T|
Direct 0.0062 0.23 0.0017 .67 -0.0012 .89
Indirect -0.0055 0.18 -0.0064 .07 -0.0095 .00
The results in Table 3 reveal interesting evidence concerning the pattern of differences over the sample periods. Over time, sample firms using the indirect method appear to be experiencing larger and larger differences between reported and estimated net operating cash flows, while firms using the direct method appear to be experiencing smaller and smaller differences. These results suggest two separate and opposite patterns of
nonarticulation among the sampled firms. Indirect firms appear to be experiencing increased nonarticulation, while direct firms are experiencing decreased nonarticulation over the periods.2
Testing Of H3
To test H3, we created two logistic regression models. The base model included the control variables while the full model contained the variable of interest, DIFF, added to the base model. Adding DIFF to the base model allows the test of whether DIFF incrementally improves the model’s ability to distinguish between the methods used to calculate net operating cash flow (METHOD). Although t-test results for DIFF scale by total assets and reported net operating cash flow generally agree, scaling by total assets produces stronger results. Thus, for the logistic regression results we report results with differences scaled by total assets. (In all cases, similar results were obtained when the differences were scaled by reported net operating cash flow.)
Table 4
Base and Full Models with DIFF Added to Control Variables 1
Base Model with 2Full Model with DIFF Control Variables added to Control Variables
Parameter Parameter
Variables Estimates 3Wald 2 Estimates Wald 2
Intercept -.2990 .8526 -.2416 .9355 IBC .0011 .5955 .0011 .5368 DPC .0031 1.0497 .0033 2.2601 XIDOC -.0027 .0406 -.0030 .0461 TXDC -.0067 .4721 -.0079 .6452 ESUBC .0043 .0297 .0041 .0262 SPPIV .0028 .2573 .0027 .2452 FOPO -.0003 .0093 -.0009 .0655 CHGREC -.0002 .0053 .0003 .0121 CHGINV .0053 1.8386 .0056 2.0781 CHOTHCA .0014 .0582 .0026 .1840 CHGAP -.0175 8.5420*** -.0177 8.7433*** CHGTXP .0005 .0021 -.0003 .0010 CHGOTHCL .0004 .0119 -.0004 .0152 LTA .2309 15.7909*** .2298 15.5048*** DIFF -4.3484 5.6462** -2Log Likelihood 59.4054 (14 df)*** 65.5810 (15 df)*** 4
Change in -2Log Likelihood N/A 6.1756 (1 df)***
1
The Base Model contains just the control variables. The control variables are: IBC = income before extraordinary items, DPC = depreciation and amortization, XIDOC = extraordinary items and discontinued operations, TXDC = deferred taxes, ESUBC = equity in earnings, SPPIV = gain/losses from sale of property, plant, and equipment and investments, FOPO = other funds from operations, CHGREC = change in accounts receivable, CHGINV = change in inventory, CHOTHCA = change in other current assets, CHGAP = change in accounts payable, CHGTXP = change in taxes payable, CHGOTHCL = change in other current liabilities, and LTA = log(total assets).
2 The Full Model contains the control variables and the variable of interest, DIFF. DIFF was defined in Table 2. 3
The Wald 2 (chi-square distribution with one degree of freedom) tests the significance of each individual variable in distinguishing whether the firm used the direct or indirect method, while the -2Log Likelihood (chi-square distribution with 14 and 15 degrees of freedom for the Base and Full Models respectively) tests the significance of each overall model. 4
Change in -2Log Likelihood is the change in the -2Log Likelihood statistics of the base and full models (chi-square distribution with one degree of freedom). A significant Change in -2Log Likelihood chi-square indicates that added variable, DIFF, has incremental usefulness in distinguishing whether the company used the direct or indirect method.
***
A negative parameter estimate and significant results for DIFF in distinguishing METHOD would indicate that companies using the direct method of calculating net operating cash flow have significantly lower nonarticulation than companies using the indirect method, even after controlling for other accounting information and firm size. Thus, finding significance for DIFF would result in rejection of H3. The results for the logistic regression models are included in Table 4.
Results for both models show that each model significantly distinguishes between the methods used by the firms to complete the operating section of the Statement of Cash Flows (-2Log Likelihood statistics are significant at p-value < .01 for both models.) The base model’s results show that only change in accounts payable (CHGAP) and log of total assets (LTA) significantly distinguish between the indirect and direct firms (p-values < .01). The positive sign for log of total assets suggests that the indirect firms are significantly larger than the direct firms.
The full model’s results with DIFF added show that CHGAP and LTA are still significant. Of interest, DIFF is negative and incrementally significant in the full model (p-value < .05 for the Wald chi-square statistic and < .01 for the Change in -2Log Likelihood statistic). As expected, the negative parameter estimate sign and significance of DIFF suggest that firms using the direct method of reporting have significantly less nonarticulation than firms using the indirect method. Thus, H3 is rejected.
6. CONCLUSIONS
This study attempts to determine whether companies that use the direct method of reporting net operating cash flow experience less nonarticulation than do companies that use the indirect approach. Results show that reported net operating cash flow differs from estimated net operating cash flow significantly less for companies using the direct method than it does for companies using the indirect method. Thus, our results suggest that cash flow statements prepared using the indirect method of reporting net operating cash flow may not articulate as well with the related income statement and balance sheets as do cash flow statements prepared under the direct method.
Our study's results provide empirical evidence that the direct method may result in less of a nonarticulation problem than the indirect method. Thus, our results are consistent with financial cash flow theory. This study’s findings should cause some concern about current disclosure requirements concerning cash flow and accrual data. Our results suggest that the FASB could use the direct approach as a measure for either decreasing the level of nonarticulation present in financial statement or providing sufficient data for researchers to determine the likely causes of nonarticulation. Because of the aggregation allowed on the Statement of Cash Flows under current U.S. reporting standards, identifying the causes of nonarticulation may be impossible under current reporting guidelines.
NOTES
1 The authors labeled this articulation problem as nonarticulation. Similar to Bahnson et al., we also use nonarticulation to describe this weakness in articulation among the financial statements. However, the use of the term does not imply that no articulation is present. The term is used in this study to describe the situation where a difference exists between reported net operating cash flow and estimated net operating cash flow, indicating that the financial statements may not articulate well (based on the proxy variable). 2 The samples contain too few direct firm observations for valid t-testing on a per year basis and for
developing multivariate logistic regression models by year. However, if calculated on a per year basis, the results are similar to those reported in Tables 2-4, albeit somewhat weaker. The significance levels for the mean differences for the indirect firms get stronger over time and are significant for 1998 and 1999 at p value less than .05. The mean differences for direct firms are not significant either year.
ACKNOWLEDGMENTS
This research was partially supported by a Middle Tennessee State University Summer Research Grant and by the Business and Economic Research Center. The authors wish to thank participants at The University of Tennessee Workshop for their comments and suggestions on earlier work leading to this paper.
REFERENCES
1. Agresti, A. (1984), Analysis of Ordinal Categorical Data (New York, NY: John Wiley and Sons).
2. Bahnson, P., P. Miller and B. Budge (1996), ‘Nonarticulation in Cash Flow Statements and Implications for Education, Research, and Practice,’ Accounting Horizons, Vol. 10, pp. 1-15.
3. Bowen, R., D. Burgstahler and L. Daley (1986), ‘Evidence on the Relationships between Earnings and Various Measures of Cash Flow,’ The Accounting Review, October, pp. 713-725.
4. Bowen, R., D. Burgstahler and L. Daley (1987), ‘The Incremental Information Content of Accrual versus Cash Flows,’ The Accounting Review, October, pp. 723-747.
5. Casey, C. J. and N. J. Bartczak (1984), ‘Cash Flow - It's Not the Bottom Line,’ Harvard Business Review, Vol. 62, pp. 61-66.
6. Casey, C. J. and N. J. Bartczak (1985), ‘Using Operating Cash Flow Data to Predict Financial Distress: Some Extensions,’ Journal of Accounting Research, Vol. 23, pp. 384-401.
7. Christie, A. M., J. K. Kennelley and T. Schaefer (1984), ‘Testing for Incremental Information Content in the Presence of Co linearity,’ Journal of Accounting and Economics, December, pp. 205-218.
8. Donaldson, G. (1969), Strategy for Financial Mobility. (Boston, MA: Harvard Business School Press). 9. Edwards, J. D. and C. D. Heagy (1991), ‘Relevance Gained: FASB Modifies Cash Flow Statement
Requirements for Banks,’ Journal of Accountancy, June, pp. 79-70.
10. Financial Accounting Standards Board (FASB) (1980), Reporting Funds Flows, Liquidity, and Financial Flexibility, FASB Discussion Memorandum ( Norwalk, CT: FASB).
11. FASB (1981), Reporting Income, Cash Flows, and Financial Position of Business Enterprise, Financial Accounting Series Exposure Draft of Proposed Concept (Norwalk, CT: FASB).
12. FASB (1986), Proposed Statement of Financial Accounting Standards: Statement of Cash Flows, Financial Accounting Series Exposure Draft (Norwalk, CT: FASB).
13. FASB (1987), Statement of Financial Accounting Standards No. 95, Statement of Cash Flows (Norwalk, CT: FASB).
14. Franz, D. P. and J. B. Thies (1988), ‘Intertemporal Divergence Among Cash Flow, Working Capital, and Income from Operations,’ Review of Business and Economic Research, Spring, pp. 18-28.
15. Gombola, M. J. and J. E. Ketz (1983), ‘A Note on Cash Flow and Classification Patterns of Financial Ratios,’ The Accounting Review, Vol. 58, pp. 105-114.
16. Gombola, M. J., M. E. Haskins, J. E. Ketz and D. D. Williams (1987), ‘Cash Flow in Bankruptcy Prediction,’ Financial Management, winter, pp. 55-65.
17. Heath, L. C. (1978), Financial Reporting and the Evaluation of Solvency (New York: AICPA). 18. Krishnan, G. V. and J. A. Largay III (2000), ‘The Predictive Ability of Direct Method Cash Flow
Information,’ Journal of Business Finance & Accounting, Vol. 27, pp. 215-245.
19. Largay, J. A. and C. P. Stickney (1980), ‘Cash Flows, Ratio Analysis and the W. T. Grant Company Bankruptcy,’ Financial Analysts Journal, Vol. 36, pp. 51-54.
20. Lawson, G. H. (1978), ‘The Rationale of Cash Flow Accounting,’ In Trends in Managerial and Financial Accounting (C. V. Dam (ed.): Martins Nijhoff).
21. Lawson, G. H. (1985), ‘The Measurement of Corporate Performance on a Cash Flow Basis: A Reply to Mr. Egginton,’ Accounting and Business Research, Vol. 15, pp. 99-107.
22. Lee, T. A. (1978), ‘The Cash Flow Accounting Alternative for Corporate Financial Reporting,’ In Trends In Managerial and Financial Accounting (C. V. Dam (ed.): Martins Nijhoff).
23. Lee, T. A. (1981), ‘Reporting Cash Flows and Net Realisable Values,’ Accounting and Business Research, spring, pp. 163-170.
24. Ohlson, J. A. (1980). ‘Financial Ratios and the Probabilistic Prediction of Bankruptcy,’ Journal of Accounting Research, Vol. 19, pp. 109-131.
25. Revsine, L. (1973), Replacement Cost Accounting (New Jersey: Prentice-Hall).
26. Sorter, G. H. (1969), ‘An ‘Events’ Approach to Basic Accounting Theory,’ Accounting Review, Vol. 44, pp. 12-19.
27. Sorter, G. H. (1982), ‘The Emphasis on Cash and Its Impact on the Funds Statement-Sense and Nonsense,’
28. Ward, T. J. (1995), ‘Using Information from the Statement of Cash Flows to Predict Insolvency,’ The Journal of Commercial Lending, Vol. 77, pp. 29-36.
29. Ward, T. J. and B. P. Foster (1996), ‘An Empirical Analysis of Thomas’s Financial Accounting Allocation Fallacy Theory in a Financial Distress Context,’ Accounting and Business Research,Vol.26, pp. 137-152. 30. Ward, T. J. and B. P. Foster (1997), ‘A Note on Selecting a Response Measure for Financial Distress,’
Journal of Business Finance and Accounting, Vol. 27, pp. 869-879.
31. Ward, T. J., B. Foster and J. Woodroof (2006), ‘Estimated Operating Cash Flow, Reported Cash Flow from Operating Activities, and Financial Distress,’ Advances in Quantitative Analysis of Finance and Accounting, Vol. 4, pp. 97-120.