Deposited in DRO:
14 July 2017Version of attached le:
Published VersionPeer-review status of attached le:
Peer-reviewedCitation for published item:
Otava, Martin and Sengupta, Rudradev and Shkedy, Ziv and Lin, Dan and Pramana, Setia and Verbeke, Tobias and Haldermans, Philippe and A. Hothorn, Ludwig and Gerhard, Daniel and Kuiper, Rebecca M. and Klinglmueller, Florian and Kasim, Adetayo (2017) 'IsoGeneGUI : multiple approaches for dose-response analysis of microarray data using R.', The R journal., 9 (1). p. 14.
Further information on publisher's website:
https://journal.r-project.org/archive/2017/RJ-2017-002/index.html Publisher's copyright statement:
This article is licensed under a Creative Commons Attribution 4.0 International license.
Use policy
The full-text may be used and/or reproduced, and given to third parties in any format or medium, without prior permission or charge, for personal research or study, educational, or not-for-prot purposes provided that:
• a full bibliographic reference is made to the original source
• alinkis made to the metadata record in DRO
• the full-text is not changed in any way
The full-text must not be sold in any format or medium without the formal permission of the copyright holders. Please consult thefull DRO policyfor further details.
Durham University Library, Stockton Road, Durham DH1 3LY, United Kingdom Tel : +44 (0)191 334 3042 | Fax : +44 (0)191 334 2971
IsoGeneGUI: Multiple Approaches for
Dose-Response Analysis of Microarray
Data Using R
by Martin Otava, Rudradev Sengupta, Ziv Shkedy, Dan Lin, Setia Pramana, Tobias Verbeke, Philippe Haldermans, Ludwig A. Hothorn, Daniel Gerhard, Rebecca M. Kuiper, Florian Klinglmueller and Adetayo Kasim
Abstract The analysis of transcriptomic experiments with ordered covariates, such as dose-response data, has become a central topic in bioinformatics, in particular in omics studies. Consequently, multiple R packages on CRAN and Bioconductor are designed to analyse microarray data from various perspectives under the assumption of order restriction. We introduce the new R package IsoGene Graphical User Interface (IsoGeneGUI), an extension of the originalIsoGenepackage that includes methods from most of available R packages designed for the analysis of order restricted microarray data, namelyorQA,ORIClust,goricandORCME. The methods included in the newIsoGeneGUI range from inference and estimation to model selection and clustering tools. TheIsoGeneGUIis not only the most complete tool for the analysis of order restricted microarray experiments available in R but also it can be used to analyse other types of dose-response data. The package provides all the methods in a user friendly fashion, so analyses can be implemented by users with limited knowledge of R programming.
Introduction
Modelling the dose-response relationship plays an important role in the drug discovery process in the pharmaceutical industry. Typical responses are efficacy or toxicity measures that are modelled with the aim of identifying the dose that is simultaneously efficacious and safe (Pinheiro et al.,2006). The recent development of microarray technology introduced gene expression level as an additional important outcome related to dose. Genes, for which the expression level changes over the dose of the experimental drug, are of interest, since they provide insight into efficacy, toxicity and many other phenotypes. Order restriction is often assumed in the dose-response modelling, usually in terms of monotone trend (Lin et al.,2012b). The restriction is a consequence of the assumption that higher dose levels induce stronger effects in the response (either increasing or decreasing). However, order restriction can also be related to umbrella profiles. In such a case, monotonicity is assumed up to a certain dose level and the direction of the dose-response relationship changes thereafter (Bretz and Hothorn,2003).
Order restricted analysis received a lot of attention in previous years and several R packages were developed for this purpose. Specifically, the R packagesIsoGene(Lin et al.,2013andPramana et al.,
2010) andorQA(Klinglmueller,2010) were developed for inference,goric(Gerhard and Kuiper,2012
andKuiper and Hoijtink,2013) for model selection, andORCME(Kasim et al.,2014) andORIClust
(Liu et al.,2012) were developed for order restricted clustering of genes.
Inference consists of testing a null hypothesis of a no dose-response relationship, against an ordered alternative. Multiplicity correction needs to be applied due to the large number of tests. The model selection framework quantifies the expected relative distance of a given model to the true underlying model in order to select the best model among a set of candidate models. The model selection approach is basis for the identification of the minimal effective dose or lowest-observed-adverse-effect level (Kuiper et al.,2014). Order restricted clustering is a data analysis approach which aims to form subsets of genes with similar expression profiles. It can be very useful when reference genes are available and the aim of the analysis is to identify genes that behave in a similar way to the reference genes. The clusters can be formed in unsupervised way and the genes that share cluster with reference genes can be identified. Additionally, the resulting clusters can be used to establish potential pathways and gene sets that react to the exposure in close agreement.
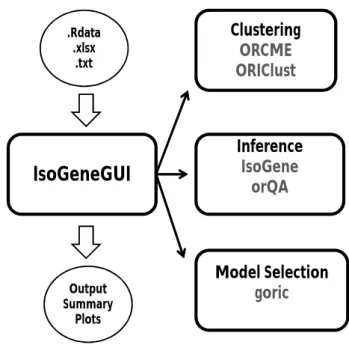
All the different methods mentioned above were scattered across multiple specialized packages. TheIsoGeneGUIpackage is an envelope package in which all the methods are available together in user friendly framework, allowing to explore the gene expression data set with collection of state-of-the-art tools. The overview of the package structure is schematically shown in Figure1.
Not all scientists performing microarray experiment analysis are necessarily educated in using R. Hence, the packageIsoGeneGUI(Pramana et al.,2012) was originally created as a graphical user interface extension of theIsoGenepackage. The large number ofIsoGeneGUIpackage downloads
IsoGeneGUI
Inference
IsoGene
orQA
Clustering
ORCME
ORIClust
Model Selection
goric
.Rdata .xlsx .txt Output Summary PlotsFigure 1:The general structure of theIsoGeneGUIpackage.
from the BioConductor (Gentleman et al.,2004) repository suggests that there is a demand for GUI data analysis tools for inference, model selection, estimation and order restricted clustering. Therefore, theIsoGeneGUIpackage was extended to embrace all currently available tools in one package. In addition to the data analysis tools for estimation, inference, model selection and clustering, the package contains many tools for exporting results, their visualization and easy handling of produced figures. Therefore,IsoGeneGUIprovides the most complete and simultaneously user friendly data analysis tool, dealing with order restricted microarray experiments and other dose-response studies, that is currently available in R.
The aim of this manuscript is to provide a brief introduction to the package, both the underlying methodological aspects and its particular implementation are discussed. Methods for inference, esti-mation, clustering and model selection available inIsoGeneGUIpackage are introduced in following section. The structure of the package is described and details about implementation of the methods are given.
Modelling order-restricted dose-response data
Estimation under order restriction
The methodology described in this section has its roots in the maximum likelihood estimate (MLE) under the order constraints. The MLE is obtained by least squares minimization, with restriction on monotonicity of dose-specific means. The estimation procedure under such condition is called ’isotonic regression’ (Barlow et al.,1972). It can be shown that the MLE can be obtained using the ’pool adjacent violators algorithm’ (PAVA). The algorithm first computes the dose-specific means. If there is any violation of the monotonicity between any two estimates of means, it assigns to both of them their weighted average as new estimate for both means. The weights are proportional to the number of observations for particular dose. The procedure is repeated, until all the estimates comply with the monotonicity assumption.
Specifically, assume non-decreasing profile and denoteµ0, . . . ,µK−1the dose-specific means and ni,i=0, . . . ,K−1 number of observations per dose leveli. The unrestricted MLE are equal to the
dose-specific sample means denoted by ˆµ0, . . . , ˆµK−1. Isotonic means ˆµ0∗, . . . , ˆµ∗K−1, i.e. the means
under the assumption of monotonicity, are computed as ˆµ∗j =µˆj,j=0, . . . ,K−1, if the means fulfill
ˆ
µj ≤ µˆj+1. If any ˆµj > µˆj+1, then ˆµ∗j = µˆ∗j+1 = (njµˆj+nj+1µˆj+1)/(nj+nj+1). The procedure is repeated iteratively, until it holds that ˆµ∗0≤ · · · ≤µˆ∗K−1.
Inference
The main goal of the inference framework is to test the relationship between the dose level and the response of interest; gene expression in our case. The primary interest is to test the null hypothesis of no dose effect on the response, given by
H0:µ0=µ1=µ2=. . .=µK−1, (1) against an ordered (monotonic) alternative
Hup:µ0≤µ1≤µ2≤. . .≤µK−1, or Hdn :µ0≥µ1≥µ2≥. . .≥µK−1, (2) with at least one strict inequality. Several test statistics for order restricted problems were developed over the last few decades. In the package, the following methods are available: likelihood-ratio test (LRT,Barlow et al.,1972), Williams’ test statistic (Williams,1971), Marcus’ statistic (Marcus,1976), M statistic (Hu et al.,2005) and modified M statistic (Lin et al.,2007). The different methods are sensitive to different possible underlying profiles, so there is no overall best method. The choice strongly depends on the context of interest. The LRT test is based on the ratio of a residual sum of squares under monotonicity over a residual sum of squares under the null hypothesis. Williams’ test statistic is based on difference ˆµ∗K−1−µˆ0, i.e. fold change between isotonic mean of last dose and sample mean under first dose. Marcus’ statistics is a modification of Williams’ that compares isotonic means ˆµ∗K−1−µˆ∗0. The M and modified M test statistics are based on the same difference as Marcus’
test, but they differ in a way how the estimation of standard error is approached. Detailed discussion about the methods, their usage and advantages and disadvantages can be found inLin et al.(2007). The distribution of some of the test statistics cannot be derived analytically. Therefore, resampling based inference is implemented to approximate distribution of test statistics under the null model (Westfall and Young,1993andGe et al.,2003).
When the tests are performed for a large number of genes, the multiplicity adjustment is necessary. Otherwise, the significance level control would be compromised and large number of false positives is expected. In general, there are two approaches for multiplicity corrections. Either by controlling the probability of at least one false positive among the findings (Family Wise Error Rate, FWER) or alternatively by controlling the proportion of false positives among the findings (False Discovery Rate, FDR). The FWER can be controlled by Bonferroni (Bonferroni,1936), Holm (Holm,1979), Hochberg (Hochberg and Benjamini,1990) or Šidák single-step and step-down (Šidák,1971) procedures. The method of Bonferroni and Šidák’s are conservative methods due to the assumption of independence among tests, especially in case of large number of tests performed simultaneously, which is often the case in microarray setting. Hochberg’s method is more powerful, but it only provides control of FWER under assumption that there is non-negative dependance among the tests (Hochberg and Benjamini,
1990). Therefore, among the FWER methods, we suggest to use Holm’s procedure, unless there is strong motivation otherwise. The procedure is uniformly more powerful than Bonferroni’s method, but does not need positive dependence assumption to control FWER, as in case of Hochberg’s method. The use of FDR instead of FWER is common in microarray studies. It translates into relaxing the control of false positives, while decreasing false negatives. It is suitable to use, if few false positives among findings are not a practical problem and we are mainly interested in identification of as many true positives as possible. The FDR can be controlled using the Benjamini-Hochberg (BH,Benjamini and Hochberg,1995) or Benjamini-Yekutieli (BY,Benjamini and Yekutieli,2001) procedures. Similarly to FWER, the BY-FDR method is valid only under positive dependence among the tests, so the BH-FDR should be used unless there is a strong motivation otherwise.
A common issue in gene expression inference is the presence of genes with relatively low variance that induce large values of the test statistics under consideration, although the magnitude of the effect is negligible. Formally, the genes are declared statistically significant, but from a biological point of view, these genes will not be further investigated due to small fold change. Significance Analysis of Microarrays (SAM,Tusher et al.,2001) was proposed as a solution for this issue by inflating the standard error.
Clustering
TheIsoGeneGUIpackage provides two clustering approaches based on algorithms that incorporate order restrictions. TheORCMEpackage implements theδ-clustering algorithm (Kasim et al.,2012)
which is based on theδ-biclustering algorithm proposed byCheng and Church(2000). The clustering
is not applied on the data themselves, but on the isotonic means. Hence, it ignores the within dose variability and uncertainty about the mean estimation. Therefore, it is advised that the algorithm is applied either to a filtered data set (i.e. genes with fold change higher than given threshold) or on the genes showing significant dose-response profile (i.e. after the inference step). The method is sensitive
both to differences in shape and to the different magnitude of the effect (even if shape is similar). The clustering criterion inKasim et al.(2012) is based on error sum of squares. The more robust version of the algorithm is achieved by using the median polish algorithm to compute the residuals (Mosteller and Tukey,1977) and by replacing the squared error by an absolute value of error. This implies that less weight is put on outlying residuals and the clusters are allowed for greater deviations under the same degree of homogeneity.
TheORIClustpackage implements the one or two-stage Order Restricted Information Criterion Clustering algorithm (ORICC,Liu et al.,2009,Lin et al.,2012a) which is based on an information criterion that takes into account order restrictions. The filtering step can be addressed within the algorithm itself. The ORICC algorithm considers different type of dose-response profiles, such as monotone profiles and umbrella profiles, that can be used for clustering. Umbrella profiles assume that the monotonicity holds up to a certain dose and then the trend changes the direction. Practical example, when such profiles are suitable, is overdosing with the drug, changing beneficial effect to the harmful one. In contrast to the clustering approach implemented in theδ-clustering method, the
ORICC algorithm pulls together all monotone profiles. Hence, it is not suitable for the separation of non-decreasing monotone profiles with a true zero effect at some dose levels (i.e. some dose-specific means are equal) from strictly increasing profiles. This is the main difference between these two clustering algorithms, ORICC andδ-clustering, proposed byLiu et al.(2009) andLin et al.(2012a),
respectively. For that reason, they are both needed to provide a complete toolbox for an order restricted analysis of microarray data.
Model selection
The task of model selection procedures is to select the ’best’ model out of the given set of possible models. The ’best’ is translated into a combination of the likelihood, i.e. how well the model fits the data, and a penalty on the number of parameters (i.e. model complexity). The form of penalty distinguishes various methods developed over past decades. A model selection based method is implemented in the packagegoricusing Generalized Order Restricted Information Criterion (GORIC,
Kuiper et al.,2011). The GORIC method incorporates the information about the order constraints when calculating the information criteria. It extends the ORIC (Anraku,1999) algorithm designed for simple monotone order restriction by allowing more complicated structure of constraints. The set of possible models is given and the output of the GORIC provides weights for each of these models (Kuiper et al.,2014). The weights can be interpreted as posterior model probabilities (Lin et al.,2012a). It is often the case that a null model is not considered in this step, if the method is applied conditionally on the inference step that selected genes with significant dose-response relationship. Based on the model weights, the best model or set of models can be selected. The main motivation for selecting one or more models is to estimate a quantity of interest that characterize dose-response relationship. For example, the determination of the minimum effective dose (MED). The MED is defined as the first dose that exhibits some effect of dose on the response. It can be estimated either based on the best model or as weighted average of several models, with weights proportional to the model weights (Kuiper et al.,2014).
The structure of the package
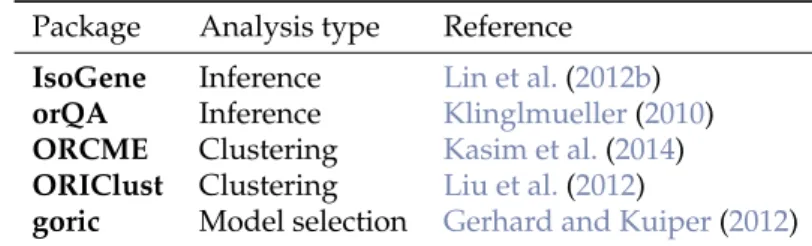
The packageIsoGeneGUIencompasses all the methods mentioned in previous section. The summary is given in Table1. The GUI was build usingTcl/Tkenvironment.
Package Analysis type Reference IsoGene Inference Lin et al.(2012b) orQA Inference Klinglmueller(2010)
ORCME Clustering Kasim et al.(2014)
ORIClust Clustering Liu et al.(2012)
goric Model selection Gerhard and Kuiper(2012)
Table 1:Packages for the analysis of order-restricted dose-response gene expression data available on CRAN.
TheIsoGeneGUIis freely available from R-Forge repositoryhttps://r-forge.r-project.org/ projects/isogenegui/. It can be downloaded and run from R with commands:
library(IsoGeneGUI) IsoGeneGUI()
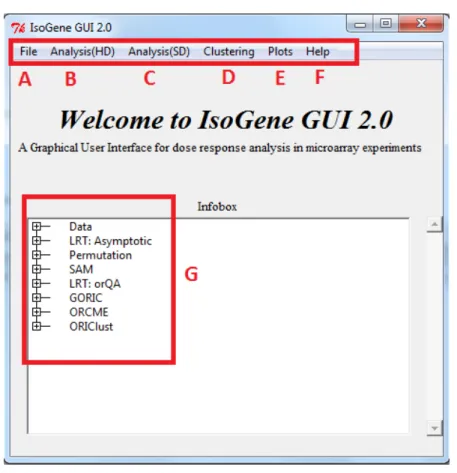
The main window of the package is shown in Figure2. The top tab lists several submenus. First the submenu ’File’ (A in Figure2) allows to load the data set and to display the data values as table. The data compatible with package can be provided either as plain text file, Microsoft Excel spreadsheet or the.RDatafile. The submenu ‘Analysis(HD)’ (B) comprises the methods for inference, estimation and model selection, i.e. it contains the packagesIsoGene,orQAandgoric. The submenu ‘Analysis(SD)’ (C) is to be used when there is only one sample available. The clustering of the genes based on their profiles can be performed in a separate submenu (D), using the methods implemented inORCME andORIClust. Some of the plots can be obtained from the analysis windows, but more general plots are listed in the visualization techniques submenu (E). The graphical techniques listed in submenu D typically use outputs of the methods implemented in other submenus. The plots can be saved in multiple file types. The last submenu ’Help’ (F) contains the help files for theIsoGenepackage, the IsoGeneGUIpackage and the vignette forIsoGeneGUI. The box in the center of the main window (G) gathers the results of the analyses and displays summary statistics of the results. Additionally, it serves as indicator of which outputs are currently active (if analysis was run multiple times) and will be plotted by visualization tools.
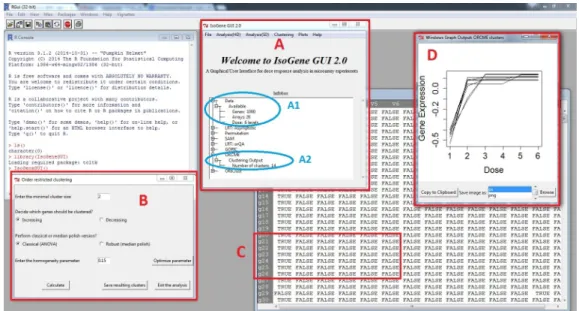
An example of the package interface is fully shown in Figure3. We can see the main window again (A), now with the box showing the properties of active data set (A1) and a summary of results of a clustering procedure (A2). The window that was used for clustering withδ-clustering method
is displayed on the left side of the Figure3(B) and the results are displayed in the table (C). One of the clusters was plotted using one of the visualization options (D). Further examples are shown in following section.
Figure 2:TheIsoGeneGUIpackage main menu with highlighted submenus.
Applications
TheIsoGeneGUIimplementation of the available methods is less flexible than in original packages. That is natural trade-off between clarity and accessibility of options in GUI compared to plain R packages that are more flexible but also more difficult to operate without proficient knowledge of R. This section describes the implementation of the methods for inference, clustering and model selection. The examples shown in Figure4to Figure6were obtained using the example data setdopaminethat is
Figure 3:R with openedIsoGeneGUIpackage.
part of theIsoGeneGUIpackage. Thedopaminedata set is subset of a larger dose-response experiment (Lin et al.,2012b) and consist of 1000 genes with four doses and 3 arrays per dose. In each figure, one method is presented, accompanied with one of available graphical displays.
Inference
The permutation test is implemented for all five test statistics discussed above, using the functions fromIsoGenepackage. For the LRT, a much faster implementation of the permutation test is available fromorQA. Both methods produce the same result (within the sampling error), so the slower version should be used only in case that additional test statistics are of interest. Additionally, there is an asymptotic solution available for the LRT as well. Note that it is advised to avoid this option in case of small sample sizes.
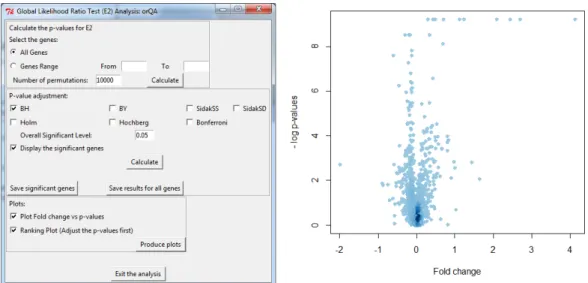
The window that facilitates permutation test based on theIsoGenepackage is shown in Figure4. The left panel shows the window itself. The top part allows to select the genes for which the raw p-values based on permutation test will be obtained. The middle part of window offers seven multiplicity adjustment methods and computation of significant genes based on any of the five test statistics. The last part produces three types of plots. The right panel of Figure4shows an example of one of the plots: the adjustment of p-value while controlling FDR. In this case, both BH and BY methods agreed on same set of genes, but that is not necessarily case in general. For FDR equal to 5%, we expect three false discoveries among the 62 null hypotheses that were rejected. The left panel of Figure5shows the window for the LRT using theorQApackage, providing nearly same options as permutation method. The right panel of Figure5shows example of so called ’volcano plot’ that compares the -log(p-value) and fold change. Note that the high value for -log(p-value) of genes with fold change around zero is often caused by a small variance among the observations of these genes. This is an indication that the SAM method should be applied (Lin et al.,2012b).
Clustering
Order restricted clustering is addressed by two algorithms, theδ-clustering fromORCMEand the
ORICC fromORIClust. As mentioned above, the package contains two versions of theδ-clustering
method: clustering based on the least squares and a robust clustering based on least of absolute residuals. The ORCME window and output is shown in Figure3. The window implementing ORICC is shown in left panel of Figure6. All monotone and umbrella profiles are automatically considered and the user cannot influence this setting. However, this setting provides the flexible framework for clustering. The complete profile can be included to the set as well. One or two-stage type of ORICC can be run and output is automatically saved in both text and visual form. The clustering results are shown in right panel of Figure6for case in which the top 30 genes are kept for final clustering step.
Figure 4:Resampling based inference. Left panel: The window for performing permutation test. Right panel: Plot of an effect of multiplicity adjustment.
Figure 5:Inference withorQA. Left panel: The window for performing LRT. Right panel: Volcano plot.
Figure 6:Order restricted clustering usingORIClust. Left panel: The window for clustering. Right panel: Plot of all the resulting clusters.
Model selection
The current implementation inIsoGeneGUIruns automatically GORIC for all possible models for a given direction (upward or downward trends). Therefore, for an experiment with control andK−1 dose levels, 2K−1models are considered, including the null model of no dose effect. In case that some of these models are a priori not considered for the analysis, the weights can be easily normalized for the smaller set of models. Only one gene at the time can be analyzed using the GORIC procedure, due to computational intensity of the derivation of the model weights. For thedopaminedata, there are six dose levels and therefore, for an upward trend that are 32 possible monotone non-decreasing models (including the null model).
Input and output
TheIsoGeneGUIpackage accepts the data sets to be provided either as plain text file, Microsoft Excel spreadsheet or the.RDatafile. The structure of the data set can vary slightly in case of two former file types, but in general, the structure need to be followed where genes are listed in rows and columns represent the different conditions (doses). In case of.RData, both microarray results and dose data can be passed at once, as it is done in case of the example data set available in the package.
Similarly, the output of the procedures can be saved either as Excel spreadsheet or as.RData file. In general, all the intermediate results can be retrieved, if needed,rather than final result of each procedure only. In addition, the visualization tools mentioned above provides an option to save figures in various formats as well as copy them directly to the clipboard. The goal is to provide the user with option to retrieve most of the relevant results, while emphasizes is put on final results of the procedures that are easily visualized and typically shown on the screen automatically, once the method is finished.
Although theIsoGeneGUIpackage was developed for the analysis of microarray dose-response experiments, it can be used for an analysis of any high dimensional data in a dose-response setting in which the basic data structure is a matrix, given in (3), withnvariables (or features, the rows of the matrix) andmobservations (or conditions, samples, the columns of the matrix).
X= X11 X12 . . . X1m X21 X22 . . . X2m . . . . . . . . . . . . Xn1 Xn2 . . . Xnm . (3)
In addition, the labeling vectorRwhich links eachjth sample to a dose related to the sample is given by
R= d1,d1, . . . ,d1, d2,d2, . . . ,d2, . . . dK,dK, . . . ,dK
. (4)
In the manuscript,Xrefers to a gene expression data (as in Section L1000 Dataset) but the package can be used to analyze any high dimensional experiment for whichXandRare available. For example, the package can be used for RNA-seq data analysis, after normalization and transformation proposed byLaw et al.(2014) for an analysis of RNA-seq usinglimma. Furthermore, the case thatn=1, i.e.
X= X11 X12 . . . X1m , (5)
corresponds to a setting in which a dose-response experiment was conducted for one variable of interest. Such an experiment can be analyzed using theIsoGeneGUIpackage as well. An example of such an analysis is given in Section Angina Dataset.
L1000 dataset
The L1000 database (<http://www.lincsproject.org/>) is one of the very new microarray datasets, which is of interest to many researchers in this field, nowadays. After analyzing several sources of gene expression data, it was noticed that 1000 carefully selected landmark genes can explain approximately 80% of the information and the dataset produced using this set of genes is known as L1000 dataset. It is essentially a high-throughput gene expression microarray dataset in which cultured cells are treated with various chemical and genetic perturbations and the corresponding transcriptional responses are measured at different concentrations. A computational pipeline is used for data-processing, where raw fluorescence intensity is converted into differential gene expression signatures and the data at each stage of this pipeline are available. TheIsoGeneGUIpackage was used for analysis of the gene expression data from level 2 in order to identify statistically significant genes with respect to
dose-response profile. Figure7shows an example in which theIsoGeneGUIpackage is used to analyse L1000 gene data for a specific compound (BRD-A19037878). All the options available under the tab ‘Analysis(HD)’ can be used for this dataset as well.
Figure 7: L1000 data. Panel A shows the GUI window for Likelihood Ratio Test. Panel B gives summary of the test results and panel C displays the test results in details.
Angina dataset
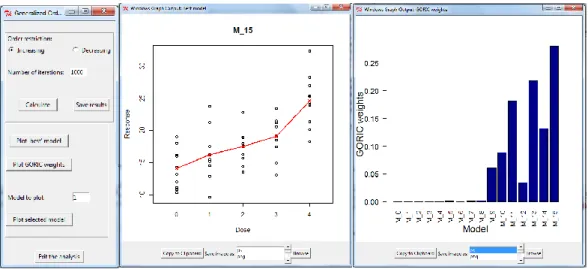
This example demonstrates usability of the package on data from a dose-response experiment with a single response variable. The Angina data set (Westfall et al.,1999, p. 164) represents dose-response study of a drug to treat angina pectoris. The response is the duration (in minutes) of pain-free walking after treatment relative to the values before treatment. Four active doses were used together with a control dose with placebo only. Ten patients per dose were examined. Large values indicate positive effects on patients. The data were used inKuiper et al.(2014) and are available under the nameangina in the packagemratios(Djira et al.,2012) of the R software. Figure8displays the results of the GORIC analysis when this dataset is used. The GORIC window is shown in left panel of Figure8. The middle plot of Figure8displays the data and the model with highest weights,M15, increasing in all dose levels. The right panel shows the weights for all the fitted models.
Figure 8: Angina Dataset. The GORIC method when only one sample is available (Angina data). Left panel: The window for providing the inputs required to perform the analysis. Middle panel: Dose-response relationship under model M15. Right panel: GORIC weights for all the models fitted.
Summary
The analysis of dose-response relationship for order restricted experiments is highly relevant in the drug discovery process. Multiple R packages offer methodology within this framework. The new version of theIsoGeneGUIpackage encompasses a wide range of these packages in a unified way. The package contains data analysis tools for estimation, inference, model selection and clustering. To our knowledge, it is the only software package providing such a wide range of tools simultaneously. Additionally, the GUI implementation of the package allows non-statisticians to conduct the analysis with only minimal knowledge of R.
Although theIsoGeneGUIpackage was developed for the analysis of microarray dose-response experiments, it can be used for an analysis of any high dimensional data in a dose-response setting. For example, for analysis of RNA-seq data, the package can be used after normalization and transformation in same way that it is done byLaw et al.(2014). Furthermore, it can be used for the case of single dose-response experiment.
In summary, theIsoGeneGUIpackage is a state-of-the-art collection of methodologies covering a wide range of analyses that are meaningful for order restricted microarray experiments as well as in more general setting of dose-response experiments. Moreover, the package can be used in a straightforward way by the general scientific community.
Acknowledgement
This work was supported by the Interuniversity Attraction Poles Research Network P7/06 of the Belgian State (Belgian Science Policy) and the Research Project of Hasselt University (BOF11DOC09; to MO).
Bibliography
K. Anraku. An information criterion for parameters under a simple order restriction.Biometrika, 86: 141–152, 1999. URLhttps://doi.org/10.1093/biomet/86.1.141. [p17]
R. E. Barlow, D. J. Bartholomew, M. J. Bremner, and H. D. Brunk. Statistical Inference under Order Restriction. John Wiley & Sons, 1972. [p15,16]
Y. Benjamini and Y. Hochberg. Controlling the false discovery rate: a practical and powerful approach to multiple testing.Journal of the Royal Statistical Society B, 57:289–300, 1995. [p16]
Y. Benjamini and D. Yekutieli. The control of the false discovery rate in multiple testing under dependency.The Annals of Statistics, 29(4):1165–1188, 2001. URLhttps://doi.org/10.1214/aos/ 1013699998. [p16]
C. E. Bonferroni. Teoria statistica delle classi e calcolo delle probabilità. Pubblicazioni del R Istituto Superiore di Scienze Economiche e Commerciali di Firenze, 8:3–62, 1936. [p16]
F. Bretz and L. A. Hothorn. Statistical analysis of monotone or non-monotone dose-response data from
in Vitrotoxicological assays.Alternatives to Lab Animals, 31(Supplement 1):81–96, 2003. [p14] Y. Cheng and G. M. Church. Biclustering of expression data.Proceedings of the Conference on Intelligent
Systems for Molecular Biology, 55:93–104, 2000. [p16]
G. D. Djira, M. Hasler, D. Gerhard, and F. Schaarschmidt.Mratios: Inferences for Ratios of Coefficients in the General Linear Model, 2012. URLhttp://CRAN.R-project.org/package=mratios. [p22] Y. Ge, S. Dudoit, and T. P. Speed. Resampling-based multiple testing for microarray data analysis.Test,
12(1):1–77, 2003. URLhttps://doi.org/10.1007/bf02595811. [p16]
R. C. Gentleman, V. J. Carey, D. M. Bates, and et al. Bioconductor: Open software development for computational biology and bioinformatics.Genome Biology, 5:R80, 2004. URLhttps://doi.org/10. 1186/gb-2004-5-10-r80. [p15]
D. Gerhard and R. M. Kuiper. goric: Generalized Order-Restricted Information Criterion, 2012. URL
http://CRAN.R-project.org/package=goric. R package version 0.0-7. [p14,17]
Y. Hochberg and Y. Benjamini. More powerful procedures for multiple significance testing.Statistics in Medicine, 9:811–818, 1990. URLhttps://doi.org/10.1002/sim.4780090710. [p16]
S. Holm. A simple sequentially rejective multiple test procedure.Scandinavian Journal of Statistics, 6: 65–70, 1979. [p16]
J. Hu, M. Kapoor, W. Zhang, S. R. Hamilton, and K. R. Coombes. Analysis of dose response effects on gene expression data with comparison of two microarray platforms.Bioinformatics, 21(17):3524–3529, 2005. URLhttps://doi.org/10.1093/bioinformatics/bti592. [p16]
A. Kasim, S. Van Sanden, M. Otava, S. Hochreiter, D. Clevert, W. Talloen, and D. Lin. δ-clustering
of monotone profiles. In D. Lin, Z. Shkedy, D. Yekutieli, D. Amaratunga, and L. Bijnens, editors,
Modeling Dose-Response Microarray Data in Early Drug Development Experiments Using R, pages 135–149. Springer-Verlag, 2012. URLhttps://doi.org/10.1007/978-3-642-24007-2. [p16,17] A. Kasim, M. Otava, and T. Verbeke.ORCME: Order Restricted Clustering for Microarray Experiments,
2014. URLhttp://CRAN.R-project.org/package=ORCME. R package version 2.0. [p14,17]
F. Klinglmueller. orQA: Order Restricted Assessment of Microarray Titration Experiments, 2010. URL
http://CRAN.R-project.org/package=orQA. R package version 0.2.1. [p14,17]
R. M. Kuiper and H. Hoijtink. A Fortran 90 program for the generalization of the order-restricted information criterion.Journal of Statistical Software, 54:1–19, 2013. URLhttps://doi.org/10.18637/ jss.v054.i08. [p14]
R. M. Kuiper, H. Hoijtink, and M. J. Silvapulle. An Akaike-type information criterion for model selection under inequality constraints.Biometrika, 98:495–501, 2011. [p17]
R. M. Kuiper, D. Gerhard, and L. A. Hothorn. Identification of the minimum effective dose for normally distributed endpoints using a model selection approach.Statistics in Biopharmaceutical Research, 6(1): 55–66, 2014. URLhttps://doi.org/10.1080/19466315.2013.847384. [p14,17,22]
C. W. Law, Y. Chen, W. Shi, and G. K. Smyth. Voom: Precision weights unlock linear model analysis tools for rna-seq read counts.Genome Biology, 2014. URL https://doi.org/10.1186/gb-2014-15-2-r29. [p21,23]
D. Lin, Z. Shkedy, D. Yekutieli, T. Burzykowki, H. W. H. Göhlmann, A. De Bondt, T. Perera, T. Geerts, and L. Bijnens. Testing for trend in dose-response microarray experiments: Comparison of several testing procedures, multiplicity, and resampling-based inference.Statistical Application in Genetics and Molecular Biology, 6(1):Article26, 2007. URLhttps://doi.org/10.2202/1544-6115.1283. [p16] D. Lin, Z. Shkedy, and M. Aerts. Classification of monotone gene profiles using information theory selection methods. In D. Lin, Z. Shkedy, D. Yekutieli, D. Amaratunga, and L. Bijnens, editors,
Modeling Dose-Response Microarray Data in Early Drug Development Experiments Using R, pages 151–164. Springer-Verlag, 2012a. URLhttps://doi.org/10.1007/978-3-642-24007-2. [p17] D. Lin, Z. Shkedy, D. Yekutieli, D. Amaratunga, and L. Bijnens, editors. Modeling Dose-Response
Microarray Data in Early Drug Development Experiments Using R - Order Restricted Analysis of Microarray Data. Springer-Verlag, 2012b. URLhttps://doi.org/10.1007/978-3-642-24007-2. ISBN 978-3-642-24006-5. [p14,17,19]
D. Lin, S. Pramana, T. Verbeke, and M. Otava.IsoGene: Testing for Monotonic Relationship between Gene Expression and Doses in a Microarray Experiment, 2013. URLhttp://CRAN.R-project.org/package= IsoGene. R package version 1.0-22. [p14]
T. Liu, N. Lin, S. Ningzhong, and B. Zhang. Information criterion-based clustering with order-restricted candidate profiles in short time-course microarray experiments.BMC Bioinformatics, 10:146, 2009. URLhttps://doi.org/10.1186/1471-2105-10-146. [p17]
T. Liu, N. Lin, N. Shi, and B. Zhang.ORIClust: Order-Restricted Information Criterion-Based Clustering Algorithm, 2012. URLhttp://CRAN.R-project.org/package=ORIClust. R package version 1.0-1. [p14,17]
R. Marcus. The powers of some tests of the equality of normal means against an ordered alternative.
Biometrika, 63:177–183, 1976. URLhttps://doi.org/10.2307/2335100. [p16] F. Mosteller and J. W. Tukey.Data Analysis and Regression. Addison-Wesley, 1977. [p17]
J. C. Pinheiro, F. Bretz, and M. Branson. Analysis of dose response studies: Modeling approaches. In N. Ting, editor,Dose Finding in Drug Development, pages 146–171. Springer-Verlag, 2006. URL
S. Pramana, D. Lin, P. Haldermans, Z. Shkedy, T. Verbeke, H. W. H. Göhlmann, A. De Bondt, W. Tal-loen, and L. Bijnens. IsoGene: An R package for analyzing dose-response studies in microarray experiments.The R Journal, 2(1):5–12, 2010. [p14]
S. Pramana, D. Lin, P. Haldermans, and T. Verbeke. IsoGeneGUI: A Graphical User Interface to Con-duct a Dose-Response Analysis of Microarray Data, 2012. URLhttp://www.ibiostat.be/software/ IsoGeneGUI/index.html. R package version 1.20.0. [p14]
V. Tusher, R. Tibshirani, and G. Chu. Significance analysis of microarrays applied to the ionizing radiation response.Proceedings of the National Academy of Sciences, 98:5116–5121, 2001. URLhttps: //doi.org/10.1073/pnas.091062498. [p16]
Z. Šidák. On probabilities of rectangles in multivariate student distributions: Their dependence on correlations.The Annals of Mathematical Statistics, 42:169–175, 1971. URLhttps://doi.org/10.1214/ aoms/1177693504. [p16]
P. H. Westfall and S. S. Young. Resampling-Based Multiple Testing: Examples and Methods for p-Value Adjustment. John Wiley & Sons, 1993. [p16]
P. H. Westfall, R. D. Tobias, D. Rom, R. D. Wolfinger, and Y. Hochberg. Multiple Comparisons and Multiple Tests Using the SAS System. SAS Institute Inc., 1999. [p22]
D. A. Williams. A test for differences between treatment means when several dose levels are compared with a zero dose control. Biometrics, 27:103–117, 1971. URLhttps://doi.org/10.2307/2528930. [p16]
Martin Otava
Interuniversity Institute for Biostatistics and Statistical Bioinformatics Universiteit Hasselt, Martelarenlaan 32, B-3500 Hasselt
Belgium
Rudradev Sengupta
Interuniversity Institute for Biostatistics and Statistical Bioinformatics Universiteit Hasselt, Martelarenlaan 32, B-3500 Hasselt
Belgium
Ziv Shkedy
Interuniversity Institute for Biostatistics and Statistical Bioinformatics Universiteit Hasselt, Martelarenlaan 32, B-3500 Hasselt
Belgium
Dan Lin
Interuniversity Institute for Biostatistics and Statistical Bioinformatics Universiteit Hasselt, Martelarenlaan 32, B-3500 Hasselt
Belgium and
GlaxoSmithKline
Rue de l’institut 89, 1330 Rixensart Belgium
Setia Pramana
Sekolah Tinggi Ilmu Statistik/Institute of Statistics Jl. Otto Iskandardinata No. 64C, Jakarta 13330 Indonesia
and
Department of Medical Epidemiology and Biostatistics, Karolinska Institutet PO Box 281, SE-171 77 Stockholm
Sweden
Tobias Verbeke Open Analytics NV Jupiterstraat 20, B-2600 Antwerp Belgium [email protected] Philippe Haldermans
PXL-IT, PXL University College Elfde-Liniestraat 24, B-3500 Hasselt Belgium
Ludwig A. Hothorn
Institute of Biostatistics, Leibniz University Hannover Herrenhaeuserstr. 2, D-30419 Hannover
Germany
Daniel Gerhard
School of Mathematics and Statistics, University of Canterbury Private Bag 4800, 8140 Christchurch
New Zealand
Rebecca M. Kuiper
Department of Methodology & Statistics, Utrecht University Padualaan 14, 3584 CH Utrecht
The Netherlands
Florian Klinglmueller
Section for Medical Statistics, Center for Medical Statistics and Informatics, Medical University of Vienna Spitalgasse 23, A-1090 Wien
Austria
Adetayo Kasim
Wolfson Research Institute for Health and Wellbeing, Durham University Queen’s Campus, University Boulevard, Stockton-on-Tees, TS17 6BH United Kingdom