Banking in Developing Countries in the 1990s
James A. Hanson
Operations and Policy Department of the Financial Sector Vice Presidency
The World Bank
The author would like to thank Jerry Caprio, Ruth Neyens, and the members of the Banking and Corporate Restructuring Team for helpful comments and Ying Lin for excellent assistance.
World Bank Policy Research Working Paper 3168, November 2003
The Policy Research Working Paper Series disseminates the findings of work in progress to encourage the exchange of ideas about development issues. An objective of the series is to get the findings out quickly, even if the presentations are less than fully polished. The papers carry the names of the authors and should be cited accordingly. The findings, interpretations, and conclusions expressed in this paper are entirely those of the authors. They do not necessarily represent the view of the World Bank, its Executive Directors, or the countries they represent. Policy Research Working Papers are available online at http://econ.worldbank.org.
Public Disclosure Authorized
Public Disclosure Authorized
Public Disclosure Authorized
Banking in Developing Countries in the 1990s
Summary
During the 1990s, commercial bank deposits and capital rose relative to GDP in the major developing countries. This rise largely reflected the dramatic fall in inflation of the 1990s and financial liberalization. However, much of this growth in banks’ loanable funds was absorbed by a) increased net holdings of central bank debt, which grew as many central banks adopted a more independent, anti-inflationary stance and used their own debt as an instrument for market-based monetary policy and b) increased net holdings of government debt, which absorbed an even larger fraction of loanable funds growth in many countries. Much of the rise in government debt reflected post-crisis restructurings, notably in Brazil, Indonesia, and Mexico, but rising deficits also played a role. The fall in credit to public sector enterprises provided some offset to the growth of these two items, but mainly in the transition economies. Non-bank financial
intermediaries typically played a small role in most of the countries except India, Malaysia, and Thailand, and their role in these countries declined sharply after 1997. Thus, bank intermediation between depositors and private sector borrowers remained limited in many countries despite financial liberalization.
Regarding external finance, in the 1990s, private-to-private international borrowing, increasingly in bonds, provided finance that grew relative to domestic bank credit in some countries, even as governments shifted from foreign borrowing to domestic debt issues in newly created government debt markets. However, net external finance though banks actually declined, reflecting banks’ increased holdings of foreign assets and the reductions foreign borrowings after 1997.
These developments raise a number of issues. The post-crisis restructurings raise two important issues: the poor performance of loans that was revealed by the crises and the future crowding-out that will result from the spreading-out of the cost of the crisis over time and the inability to retire the restructuring related debt. The absorption of deposits in non-private sector credit, the growth of off-shore finance of the private sector and the poor performance of loans suggests a weakening of the link between the
traditional measure of financial depth, M2/GDP, and economic growth and development. The changes in the 1990s also raise issues of the potential for future deposit growth, the riskiness of bank portfolios, banks’ increased dependence on government solvency, the access to credit for firms unable to access global markets, the foreign exchange exposure of countries, and the implications of the ongoing changes in regulation and supervision.
Table of Contents
I. Introduction ... 3
II. Resource Mobilization by Banks ... 4
A. Deposit Mobilization by Banks... 4
B. Foreign Sources of Funding for the Banks... 6
C. Bank Capital... 8
III. Resource Allocation by Banks: The Uses of Loanable Funds... 8
A. Central Bank Debt... 8
B. Bank Credit to Government and Crowding-out ... 10
C. Bank Credit to Public Sector Enterprises... 14
D. Bank Credit to the Private Sector... 15
E. Bank Credit to Non-bank Financial Intermediaries (NBFIs) ... 17
IV. Competition from On-shore and Off-shore Institutions and Markets. ... 18
A. Competition from Domestic NBFIs and Markets ... 18
B. Competition from Off-shore: The Growth of External Finance in the 1990s... 20
Banking in Developing Countries in the 1990s
James A. Hanson
I. Introduction
Enormous changes occurred in the financial systems of developing countries during the 1990s. Governments liberalized interest rates and credit allocation.
Governments also opened the capital account, creating opportunities for off-shore finance and portfolio diversification. Domestic banks increasingly made foreign currency loans and took foreign currency deposits. Central banks moved away from trying to finance development, focused increasingly on low inflation, and became more independent. Domestic markets developed in debt of central banks and governments; international markets developed in government bonds, and private firms increasingly raised funds off-shore. Privatization of public sector enterprises changed the nature of bank clients while privatization of public sector banks changed the way banks operated. Financial
regulation and supervision improved substantially. But, numerous financial crises also occurred in the 1990s most notably in Mexico, East Asia, Russia, and Brazil.
How did these enormous changes affect banking in the developing countries? This paper looks at what happened to banks’ resource mobilization and allocation in 25 large developing and transition countries from 1990 to 2000 and offers some hypotheses to explain the developments that occurred.1 These countries’ banking systems accounted for 84% of banking system deposits in developing countries in 2000 (See Hanson, Honohan, and Majnoni, 2003). The data are drawn from the IMF’s International Financial Statistics (IFS) data base. The paper also examines the role of international lending by the off-shore private sector to developing countries, using the World Bank’s Global Development Finance data base.
Three sets of analyses are conducted. First, the paper discusses the average size (relative to nominal GDP) of bank deposits, capital, and credits of various types, for whichever countries report comparable data in a given year.2 A country’s aggregate bank
1 The countries (and their country groupings for this study) are Algeria (Middle East and North Africa-MENA), Argentina(Latin America-LA)*, Bangladesh (South Asia-SA)*, Brazil (LA)*, Chile (LA)*, China, Colombia (LA)*, Czech Republic (1993-2000, Transition-TR)*, Egypt (MENA)*, Hungary (TR), India (SA), Indonesia (E. Asia-EA)*, Korea (EA), Malaysia (EA)*, Mexico (LA)*, Morocco (MENA), Pakistan (SA), Peru (LA)*, Philippines (EA)*, Poland (TR)*, Russia (1993-2000, TR)*, South Africa (1990, 1992-2000), Thailand (EA)*, Turkey*, and Venezuela (LA)*. Iran, Lebanon (an off-shore banking center), and Syria had deposit sizes similar to these 25 countries but were not included because their experience was considered atypical. The IFS reports a full set of data for the starred countries, including capital accounts and a breakdown of credit between public and private enterprises.
2 Sample sizes vary in this approach. The data on bank balance sheets refers to stocks at the end of the calendar year, while the data on GDP are flows over the previous year. A cross-country comparison of the ratios of such stocks relative to GDP is somewhat distorted by cross-country differences in inflation, which tends to raise the year-end stocks of financial assets relative to GDP. This paper ignores this problem.
balance sheet is the unit of observation and the averages are unweighted by country size.3 The summary discusses the unweighted average balance sheets from a consistent sub-set of seventeen countries that report a complete, more detailed breakdown of data, including data on capital and on credit to public enterprises and the private sector separately. Second, an analysis is made of the role of on-shore and off-shore competition for the domestic banking system in these countries.
The rest of the paper is organized as follows: Section II examines different categories of banks’ resource mobilization: deposits, net foreign liabilities, and capital. Section III examines developments in resource allocation (net assets of the banks or credits) to the central bank, the government, public enterprises, the private sector, and other financial intermediaries. Section IV discusses competition to banks, on-shore, and off-shore. Section V summarizes the results and raises some issues for the future.
II. Resource Mobilization by Banks A. Deposit Mobilization by Banks
Deposits, including certificates of deposits and bonds, were and continue to be banks’ largest source of funds by far. Bank deposits increased from an average of 34 percent of GDP in 1990 to 41 percent of GDP in 1993 and then to 50 percent of GDP in 2000, for the countries among the 25 for which data are available (Figure 1). Across countries, the average ratio of deposits to GDP rose about 4 percent per year between 1990 and 2000. Between 1993 and 2000, the growth rate was somewhat less — about 3 percent per year.4
The rise in the total of savings deposits, time deposits, certificates of deposit, and bank bonds explains the rapid growth of deposits; these bank liabilities grew about 4.9 percent per year faster than GDP between 1990 and 2000. Demand deposits grew only about 1.2 percent per year faster than GDP, and actually fell in some countries.
The increase in deposits relative to GDP probably reflects a variety of factors:
• the dramatic fall in inflation in almost every country — countries that began the decade with hyperinflation reduced inflation sharply, in some cases, like Argentina, to single digits; countries with initial inflation of 10-30 percent annually reduced
3 Unweighted averages are used for two reasons: first, weighting by country size would involve converting the data with exchange rates and would be affected by overvaluations or undervaluations much more than the data deflated by GDP. Second, weighting by country size also would mean that data from China and India, which in 2000 accounted for about 22 percent and 9 percent of all developing country deposits, respectively, would dominate the results.
4 The average growth of deposits between 1990 and 1993 is increased substantially by the rise in Brazilian deposits, which rose from 36.8 percent of GDP in 1990 to 76.3 percent in 1993, before falling to 39.3 percent of GDP in 1994 and 25 percent in 1995. Excluding Brazil, average deposits rose from 34.1 percent in 1990 to 39.9 percent in 1993 and then rose to 51.1 percent in 2000. Excluding Brazil, deposits grew more slowly after 1993 than before, but the difference between the two periods was smaller.
inflation to single digits; and countries with single-digit inflation initially often halved inflation;5
• the gradual liberalization of interest rates and of directed credit, policies that had tended to depress the interest rates paid to depositors;
• the use of foreign currency deposits in some of the countries;6
• the use of new instruments such as certificates of deposits and bonds; and
• the increase in monetization and financial intermediation. (Credit cards and other non-monetary forms of transactions grew over the period but were still small by the end of the 1990s in most countries.)
The increase in the ratio of deposits to GDP occurred in all regions and in 22 of the 25 larger developing countries. China had by far the largest volume of deposits in the developing world in 2000, the largest ratio of deposits to GDP (137 percent in 2000), and the largest growth in the ratio of deposits to GDP (Table 1). Other East Asian countries were not far behind by any of these metrics. Interestingly, East Asian bank deposits continued to grow even after the crisis, albeit more slowly. In Korea and Thailand, this growth may partly reflect a shift out of non-bank financial intermediaries.
5 The only exceptions to this statement are Venezuela, where inflation was halved but remained at about 20 percent at the end of the 1990s; Turkey, where inflation fell only marginally from 1990 to about 50 percent in 2000 though the rate in 2000 was substantially below inflation in the mid 1900s; and Russia, where inflation was brought down from over 850 percent in 1993 to about 20 percent in 2000.
6 Honohan and Shi, 2003, report figures on dollar holdings for 12 of the 25 countries. In addition, at least 3 more of the 25 countries have dollar deposits. Note that the large real depreciations that began in 1997 would have tended to increase the ratio of deposits to GDP; nonetheless the ratio grew slower after 1997 than before. Hanson, 2002, discusses the developments that led to the legalization of foreign currency deposits and their impacts.
Figure 1. Deposits /GDP 1990-2000 0 20 40 60 80 100 120 140 160 1989 1991 1993 1995 1997 1999 2001 Percent GDP 0 20 40 60 80 100 120 140 160
Total Deposits in a country Ave. Total Deposits
In South Asia, the ratio of deposits to GDP grew about 40 percent over the decade and in the Middle East and North Africa about 28 percent, while in Latin America, which had the lowest overall ratio, deposits to GDP grew nearly 25 percent between 1990 and 2000.7 The slowing of deposit growth after 1993 occurred in all regions except the Middle East and North Africa, where the growth rate was roughly the same before and after 1993. The countries where the deposit to GDP ratio did not increase over the 1990s were Brazil, Egypt, and Venezuela.
Table 1 Deposit Mobilization 1990-2000 (percent of GDP, averages by Region)
Twenty-five
Countries East Asia (excl. China, 5) Transition (4) America (7)Latin M. East, N. Africa (3) Asia (3) South China
1990 34.2 43.9 22.8 48.8 26.1 61.3 1991 35.5 45.2 24.0 48.5 26.9 67.4 1992 38.8 50.1 26.5 49.3 28.9 72.8 1993 41.6 53.8 38.6 31.0 52.0 30.3 83.7 1994 40.6 55.2 37.7 26.1 50.6 31.6 81.4 1995 40.7 58.7 37.7 24.6 48.6 29.9 86.4 1996 41.4 60.9 37.5 24.3 46.4 31.6 94.4 1997 45.3 67.1 38.4 27.7 51.0 33.5 108.0 1998 47.7 73.6 39.2 28.7 51.9 33.9 117.8 1999 50.1 75.1 40.3 29.9 54.9 34.2 132.8 2000 50.4 76.3 41.3 28.4 57.7 36.4 137.3
B. Foreign Sources of Funding for the Banks
Despite globalization, the stock of net foreign borrowing of banks in the 25 countries declined over the 1990s. In fact, average net foreign funding of banks was actually slightly negative in 2000, -0.5 percent of GDP. In other words, by the end of the decade, banks in the 25 countries had placed more funds overseas than they had received from abroad, on average. In contrast, in 1990, net foreign funding was slightly positive, 0.15 percent of GDP on average.8
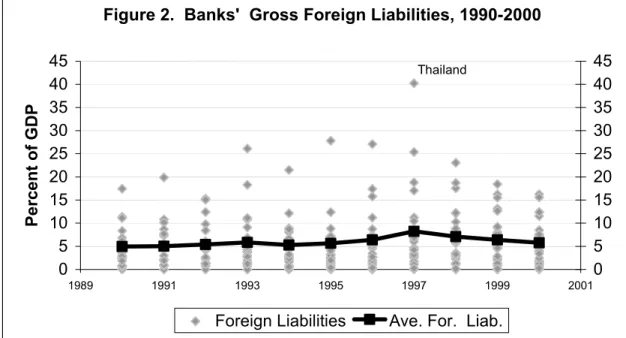
Banks’ gross foreign liabilities were only about 1 percentage point of GDP higher in 2000 than in 1990, despite globalization (Figure 2). Gross foreign funding (liabilities) of banks actually declined in seven countries between 1990 (or 1993) and 2000, another 10 countries had a rise of 2 percent of GDP or less. Note that in percentage terms the declines in dollar term were generally even larger. Many countries experienced real currency depreciations over the decade (especially after 1997) and a real depreciation
7 Latin American figures are very influenced by the rise and fall of deposits in Brazil. See footnote 4. Indian data probably reflect a shift from non-banks after 1997.
8 These data do not reflect off-balance sheet guarantees by banks of direct corporate borrowing off-shore; such contingent liabilities enter the balance sheet only when the direct borrower cannot pay.
tends to raise the ratio of a constant amount of foreign currency denominated liabilities to GDP. The only large rises in foreign liabilities over the period were in the Transition countries, and in Thailand. And the Thai banks’ liabilities at the end of the decade were down significantly from their high levels of the mid-1990s.9
Focusing only on the end-points of 1990 and 2000 obscures the cycle in gross foreign funding of developing country banks during the decade. On average, gross foreign funding rose as a percentage of GDP in nearly every year from 1990 to 1997. The only exception was 1994, when the Mexican crisis began. However, after 1997, gross foreign funding fell as a percentage of GDP, on average, in the 25 countries. Off-shore banks reduced their short-term credit lines and their long-term lending as it was amortized. Meanwhile the banks in the 25 countries reduced their exposures to reduce devaluation risk. Again note that the falls in dollar funding were even larger in
percentage terms, because the real depreciations increased the ratio of a given amount of foreign currency liabilities relative to GDP.
Meanwhile, the average gross foreign assets of banks in the 25 countries generally rose over the decade (Figure 3).10 This rise probably reflected banks’ attempts to hedge
risks off-shore, once the capital account was liberalized, particularly in countries where dollar deposit liabilities became important. Again, the movements over time also include the effect of the real depreciations.
The net result of the rise in assets and fall in liabilities was that by the end of the
9 The Thai data reflect a) the operation of the Bangkok International Bank facility, which operated an on-shore, off-shore banking facility, in which domestic citizens could deposit in off-shore banks and funds were then lent back to on-shore banks, often in foreign currency, b) guarantees that became actual
liabilities, c) the large devaluation in 1997, and d) after 1997, the takeover by the Thai government of some of the foreign currency liabilities of the banks.
10 See also Honohan and Shi, 2003.
Figure 2. Banks' Gross Foreign Liabilities, 1990-2000
0 5 10 15 20 25 30 35 40 45 1989 1991 1993 1995 1997 1999 2001 Percent of GDP 0 5 10 15 20 25 30 35 40 45
Foreign Liabilities Ave. For. Liab.
decade the banks’ foreign assets exceeded foreign liabilities, on average, i.e. the
developing country banks were net lenders off-shore. Globalization was thus not evident in the net position. However, the rise in foreign assets and foreign liabilities suggests that globalization provided an opportunity for diversification.
C. Bank Capital
Bank capital, another potential source of loanable funds for banks, rose on average in the developing countries for which data are available.11 By 2000, reported capital reached an average of about 9 percent of GDP for the 20 countries reporting capital data in 2000. Banks in 15 of these countries increased their capital faster than GDP, in some cases substantially. Reported capital was over 20 percent of non-government credit in 11 countries in 2000. Thus, in many countries, increased capital represented additional loanable resources for banks. It should be noted, however, that the reported individual country figures are much higher than those typically reported by banks in non-IFS analyses of specific countries.
The increases in capital probably reflect the gradual implementation of the Basel standards across countries as well as market pressures for more capital. Most of the countries where capital fell were crisis countries. Another explanation for the fall in capital in some countries may be the rise of government debt in their banking systems. Most countries have a zero risk weight, or a low risk weight, for government debt for purposes of determining required capital. Thus, a higher ratio of low-risk weighted government debt permitted banks to maintain a lower ratio of capital to total assets.
III. Resource Allocation by Banks: The Uses of Loanable Funds A. Central Bank Debt
Banks switched from being small net borrowers from their central banks in 1990 (0.8 percent of GDP) to large net lenders in 2000 (4.6 percent of GDP), on average in the
11 The IFS does not report capital figures for Algeria, Egypt, India, Morocco (1990-1997), and Pakistan. Figure 3 Banks' Average Foreign Liabilities and Assets
1990-2000 0 2 4 6 8 10 1990 1991 1992 1993 1994 1995 1996 1997 1998 1999 2000 P e rcent of G D P
25 developing countries. The banks’ net holdings of central bank liabilities grew at an increasingly rapid rate over the decade in all regions, except South Asia.12
Increases in reserves on deposits accounted for less than one percentage point of the rise in banks’ holdings of central bank liabilities (as a percentage of GDP), for those countries among the 25 where such information was available. Moreover, the rise in reserves (as a percentage of GDP) was wholly due to the rise in the deposit to GDP ratio. As a fraction of deposits, reserves fell by about 25 percent, reflecting the reduction in reserve requirements that typically accompanied liberalizations of the financial system.13
Two other factors were important in banks’ increased net holdings of central banks liabilities: a) central banks’ shift away from providing credit in a developmental role and b) their increased use of central bank debt as an instrument of monetary policy.14 In the early 1990s, some central banks viewed themselves as playing a developmental role and some actually had lent more to the banks than they held in bank reserves.15 However, most central banks moved shifted away from this approach over the decade. This shift occurred as central banks became focused on inflation fighting and became more independent, and as the stock of credits that they had provided was gradually amortized or otherwise became small relative to nominal GDP.
Second, some central banks began to issue their own debt as an instrument of monetary policy, for example, Brazil, Indonesia, Pakistan, and Peru. Central banks did this as part of the switch to monetary policy-making that was market-based, rather by the use of changes in credit controls, reserve requirements, or central bank loans. The central bank debt found a ready market since it was not subject to prudential capital
requirements. The central bank debt tended to grow because central banks often used its debt to sterilize capital inflows, as well as to tighten money when capital flowed out.16 Hence, central bank debt often tended to increase on both the inflow and the outflow phases of capital flow cycles. Central banks also tended to reduce reserve requirements as part of financial liberalizations, and they may have mopped-up some of the resulting increase in liquidity with sales of their debt.
The switch to a market-based monetary policy from the reliance on quantitative credit controls did improve financial sector performance but it also led to some problems. The previous, credit control approach had tended to limit competition, reserve
requirements were a blunt instrument, and lending risked overly supporting weak banks. However, the use of central bank debt, rather than government debt, to conduct monetary
12 In South Asia, the average net credit to the central bank rose from 0.7 percent of GDP in 1990, to 2.9 percent in 1994, then declined back to 0.7 percent in 2000, with Pakistan’s banks remaining net borrowers. 13 In some countries excess reserve holdings with the central bank may have become more attractive, as the central bank paid more market-based interest rates on reserves to reduce the costs of holding reserves and the spread between lending and deposit rates. Nonetheless, the ratio of reserves to deposits tended to fall. 14 In a few cases, central bank liabilities also were temporarily used as part of crisis resolution strategies. 15 These countries included Algeria, Argentina, Bangladesh, Chile, China, Czech Republic (1993) Hungary, Indonesia, Korea, Pakistan, Peru, Poland and Russia (1993).
16 In some cases, however, the central banks acted as large lenders of last resort to the banks, which tended to fuel capital flight, see, for example, World Bank, 2000a.
policy also raised the possibility of a quasi-fiscal deficit in the central bank. This was particularly the case in periods of capital inflow when interest rates paid by the central bank on its debt exceeded the earnings on its international reserves converted into local currency.17
B. Bank Credit to Government and Crowding-out
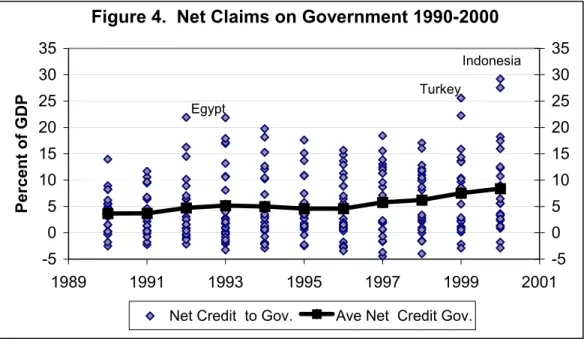
Banks’ credits to governments18 more than doubled as a percentage of GDP from 1990 to 2000, on average, a rise in which bank crises played a major role. Bank credit to government rose from 3.6 percent of GDP in 1990 to 5.2 percent of GDP in 1993, then further rose to 8.4 percent of GDP in 2000. This 4.8 percentage point rise compares with an average rise in the deposit to GDP ratio of 16 percentage points the 1990s. In 16 of the 25 countries, net credits to government rose by over two percent of GDP.19
The ratio of net government credit to deposits is a perhaps more important indicator of banks’ intermediation than the ratio with respect to GDP. A given ratio of net credit to government to GDP has a greater negative impact on banks’ intermediation between savers and private investors in a smaller banking system. Relative to deposits, net credit to government increased by about 65 percent in the 1990s, from 12.9 percent of
17 If such a quasi-fiscal deficit occurred, then the central bank either had to issue more debt simply to cover its interest and operating costs, perhaps when it was inconvenient from the standpoint of monetary targets, or else obtain a transfer from the government.
18 Net credit to government is defined as credit to government, less government deposits and government funds provided to the banks for on-lending . Government funds for on-lending were used in 6 countries. 19 The ratio of government credit to GDP fell between 1990 and 2000 in Korea, Malaysia, Pakistan, Peru, Thailand, and Venezuela, and rose by less than one percent of GDP in Argentina (albeit from the relatively high initial level of 8 percent), Chile, and Egypt.
Figure 4. Net Claims on Government 1990-2000
-5 0 5 10 15 20 25 30 35 1989 1991 1993 1995 1997 1999 2001 Percent of GDP -5 0 5 10 15 20 25 30 35
Net Credit to Gov. Ave Net Credit Gov.
Egypt
Turkey
deposits in 1993, on average, to 21.4 percent of deposits in 2000 (Table 2). In eight of the 25 countries, government deposits represented over 30 percent of deposits in 2000, compared to four countries in 1990 and five in 1993. The ratio of government debt to deposits increased in 17 countries over the decade.
The individual country data display three patterns over the period 1993-2000, when information is available for all 25 countries. In eight of the countries the ratio of government debt to deposits rose between 10 and 64 percentage points between 1993 and 2000.20 In five countries, government debt declined by 10 or more percentage points of deposits.21 Finally, in the other 12 countries, the ratio of government debt to deposits was roughly constant, rising less than 6 percentage points (and in a few cases falling).
The rise in the average amount of government debt in the banks largely reflects the large injections of government recapitalization debt as part of bank restructurings.22 Indonesia is the most obvious example — its bank recapitalization led to an enormous rise in net bank holdings of government debt, from a negative figure in 1990 to 29 percent of GDP in 2000.23 Government debt also rose sharply in Brazil and Mexico
20 Argentina, up 12 percentage points (though down from 1990 to 2000); Brazil, 32 percentage points; Colombia, 18 percent points; Indonesia, 64 percentage points; Mexico, 45 percentage points; Philippines, 11 percentage points; Russia, 40 percentage points; and Turkey, 57 percentage points.
21 Egypt, down 20 percentage points; Hungary, 15 percentage points; Morocco, 13 percentage points; Pakistan 17 percentage points; Poland, 21 percentage points.
22 Future tax credits were also used in some cases, for example in Brazil.
23 Recapitalization involved banks’ turning over bad loans to the Indonesian Bank Reconstruction Agency and receiving initially enough government bonds to raise capital to 4 percent of risk weighted assets.
Table 2. Net Credit to Government/ Deposits 2000 (percent) Korea -3.6 Philippines 22.7 Chile -3.1 Hungary 23.0 Thailand 1.4 Pakistan 24.6 Malaysia 2.3 Morocco 26.5 Peru 3.2 Argentina 30.8 S. Africa 4.9 India 34.6 Czech Rep. 4.9 Russia 35.3
China 6.0 Brazil 43.3 Egypt 7.8 Mexico 48.8 Venezuela 8.2 Algeria 50.6 Bangladesh 10.9 Indonesia 56.3 Poland 14.8 Turkey 64.7 Colombia 16.4 Average 21.4
because of major recapitalizations of banks.24 Moreover, after the restructurings, the governments typically did not increase primary fiscal surpluses enough to offset the associated rise in interest costs. Hence, a secondary rise in the government debt to GDP ratio occurred because the recapitalization bonds raised government deficits.
Excluding the three major restructuring countries — Brazil, Indonesia, and Mexico — substantially reduces the increase in the average ratio of (net) government debt to GDP (by almost 50 percent) and government debt to deposits (by 38 percent). Specifically, the average ratio of net government debt in the banks to GDP rises from 5.6 percent in 1993 to 7.1 percent in 2000 without the three major restructuring countries, compared to a rise from 5.2 percent to 8.4 percent, including the three countries. The average ratio of net government debt to deposits rises from 13.5 percent in 1993 to 17.6 percent without the three countries, compared to a rise from 12.9 percent in 1993 to 21.4 percent in 2000 with them.
In some non-crisis countries, the government deficit was an important factor in the rise in banks’ holdings of government debt in the 1990s. In Turkey, government deficits contributed to a rise in government debt over the decade, from a small fraction of GDP in 1990 (1 percent of deposits) to nearly 10 percent of GDP in 1997, which then accelerated to 16 percent in 1998 and then to over 27 percent of GDP (67 percent of deposits) in 2000. In India, net credit to government rose over the decade from 8.9 percent of GDP in 1990 (26.5 percent of deposits) to 16 percent of GDP in 2000 (34.5 percent of deposits), as government deficits rose toward the end of the decade (World Bank, 2000b).25 In Argentina, the ratio of net government debt to GDP in the banks initially fell from 8.2 percent of GDP to about 3 percent, in 1992-1994, but then began to rise again, reaching 8.4 percent of GDP in 2000 and over 13 percent of GDP in 2001 (See Mussa, 2002).
To some extent, the rise in government debt and the deficits of the 1990s reflected the rise in real interest rates on government debt that was associated with the switch from implicit taxes on the financial sector under financial repression to more market-based rates on government debt after financial liberalization. At the same time, government debt was attractive to banks because of its zero risk weighting for purposes of capital requirements. Another attraction was the increased liquidity of government debt as a result of the development of government debt markets.26 The attraction of government
24 Thailand also suffered a financial crisis but the bank restructuring that occurred in Thailand appears to have involved only limited injections of government debt into the banks, unlike Brazil, Indonesia, and Mexico. Argentina suffered bank problems in 1995 but the increase in government debt in the banks was relatively small; in the slowdown and crisis beginning in 1999 the increase in holdings of government debt was much larger. Russia suffered a crisis in 1998, but it was largely related to external holdings of debt. Colombia suffered a banking crisis toward the end of the 1990s, and its banks’ holdings of government debt increased at the end of the 1990s, but by much less than in Brazil, Indonesia, and Mexico. In Turkey, much of the growth of government debt reflected deficits. However, there was a banking crisis in 1994 that led to the failure of 4 small banks and a blanket guarantee of liabilities; in 1999, a major bank failed and a larger financial crisis began (Denizer, Gultekin and Gultekin, 2002).
25 India recapitalized public sector banks in 1994 and 1995, but the cost was less than two percent of GDP. 26 Governments used both marketable and non-marketable debt in the recapitalizations.
debt limited the rise in interest rate paid by the governments after liberalization.
In sum, there are two different explanations for the rising government debt ratios — government deficits and bank recapitalizations (that feed back into government deficits) — and two different time patterns of crowding-out of private credit. In the case of government deficits, the traditional crowding-out of private credit occurred, at least relative to rising deposits. In one way or another, the stock of government debt has to be held and the deficit financed. This means that the spread between the interest rates on private debt and government debt has to be driven high enough to crowd-out enough private sector financing to “make room” for the government debt issues to finance the deficit. It is true that the government debt used to finance deficits became more attractive to the banks after liberalization raised its rates, low risk weights reduced the required increases of capital under the new regulations (compared to private sector loans), and new government debt markets increased its liquidity. However, these attractions did not generate crowding-out, they only limited the interest rate on government debt, compared to private credits, at which the crowding-out occurred. In particular, as a first,
macroeconomic approximation in a closed economy, the low risk weighting of
government debt does not lead, per se, to crowding-out of private credit, it mainly limits the interest rate that needs to be paid on the interest-insensitive supply of public debt in order to crowd-out enough private credit to allow the stock of government debt to be held.27 In an open economy, the issue is more complicated. Governments may find it easier to fund their deficits domestically than in the past, because of the newly-developed government bond markets and the aforementioned incentives for banks to hold
government debt. Thus more of the government deficit might be financed domestically, less externally, than in the past. (See the discussion in Section IV.2).
In the cases of government debt increases because of bank recapitalizations, substantial crowding-out of private credit eventually seems to occur, but the initial implication for private credit is less clear. At the time of a restructuring, non-performing private sector and public enterprise debt is transferred from bank balance sheets to asset management companies in exchange for an equal amount of government debt
(recapitalization bonds). Thus, the private sector credit that exists at the time of the restructuring still exists, it simply has been transferred to another financial intermediary.
Over time, however, crowding-out does seem to occur as a result of the poor performance of the loans which means the recapitalization bonds cannot be retired and the government deficit tends to rise. The transferred private loans and associated
collateral typically are sold-off gradually at high discounts, reflecting the poor quality of the loans. Thus the recapitalization bonds that replaced non-performing private loans cannot be liquidated with the sale proceeds of the private loans. (In the case of the public enterprise debt the issue is similar, but appropriate consolidated public sector accounting would enable the size of the public sector deficit and the degree of crowding out to be
27 A full explanation of how the liberalization of interest rates on government debt, the new regulations, and the structure of the new government debt markets affect the amounts of government debt held by banks and the non-bank sector would require a general equilibrium model involving the specification of the
responsiveness of deposits, total saving, and foreign investors to different interest rates, the operations of the banks, and the structure of the new government debt market.
measured at all times). Thus, a large percentage of the bonds that replaced private loans remain in the banks and the interest on them tends to increase debt costs in the
government budget and, correspondingly, increase the government deficit. As a result, at the end of the process, the banks still have most of the recapitalization bonds plus
additional government bonds that have financed the larger government deficits arising from the interest on recapitalization bonds. This outcome reflects the spreading out of the cost of the crisis over time. Hence, crowding-out of private sector credit does occur over time.28 This crowding-out reflects the non-performance of the private loans, which
in turn reflects either the initial poor performance of the banks in selecting private borrowers or the implicit subsidy they received (See the discussion in Section V).
C. Bank Credit to Public Sector Enterprises
Credit to public sector enterprise fell by about 2.5 percentage points of GDP (50 percent) on average between 1993 and 2000, the period for which consistent data exist for 18 countries.29 The decline in this credit offset much of the rise in government debt described above, on average. To put it another way, falling credit to public enterprise was more than absorbed by larger government borrowings, on average. However, the decline was mainly in the Transition countries.
It should be noted that some countries with large bank credits to public enterprises, including China and India, do not report separate data on credit to public sector enterprises to the IFS, grouping such credits into “claims on other sectors”, or “claims on the private sector”, or other items.30 The discussion here covers only the 18 countries that report data separately on credit to public and private sector enterprises. Note also that, unlike the figures on government, the credit to private enterprises is not net of their deposits in the banking system, which often have been large. Lack of this data prevents a full analysis of the banks’ position with the public sector enterprises.
The decline in average credit to public sector enterprises reflected mainly the large declines in the Transition economies. The Transition countries privatized many of the public enterprises that had accounted for large borrowings in the early part of the decade. Credit to public sector enterprises also declined in Latin America after
28 The rise in interest costs also tends to lead to a fall in other government spending, particularly capital spending, to limit the growth in the deficit. Hence deficits and recapitalization bonds tend to crowd-out capital spending within government budgets as well as private credit on bank balance sheets.
29 Countries reporting public enterprise and private sector credit separately are Algeria (1992-2000), Argentina, Bangladesh, Brazil, Chile, Colombia, Czech Republic (1993-2000), Egypt, Indonesia, Malaysia (1996-2000; 1993-1995 assumed zero), Mexico Peru, Philippines, Poland, Russia (1993-2000), Thailand, Turkey, and Venezuela. Countries in the 25 country sample not reporting public enterprise credit separately are China, Hungary, India, Korea, Morocco, Pakistan, and South Africa.
30 Regarding China, various analysts, for example, Lardy, 1998, suggest that the banks had large non-performing credits to public enterprises in the 1990s and that they often rolled-over the interest due. India reduced the access of central public enterprises to bank credit in the early 1990s, by making new lending to public enterprises ineligible for the statutory liquidity requirement and by directly limiting borrowing by many central public enterprises. However, some central public enterprises, such as telecommunications and the oil firms have continued to borrow, as have state public enterprises, notably the state power companies. Over the latter half of the 1990s, the Reserve Bank of India tightened regulations on bank credit to state public enterprises.
privatizations, but only by about 1-1.5 percent of GDP. This small decline reflects both the smaller role of state enterprises in Latin America, compared to the Transition
economies, and the small size of the banking sector (relative to GDP) in Latin America. In East Asia, credit to public sector enterprises rose slightly as a percentage of GDP after the crisis, but remained small.
The large size of the decline in the Transition economies roughly offset the rise in credit to government and the central bank that they experienced. In Latin America, the fall in credit to public enterprises was too small to offset the rise in credit to government, particularly in Brazil and Mexico, where the rises in bank holdings of government debt were very large as a result of the bank restructurings.
D. Bank Credit to the Private Sector
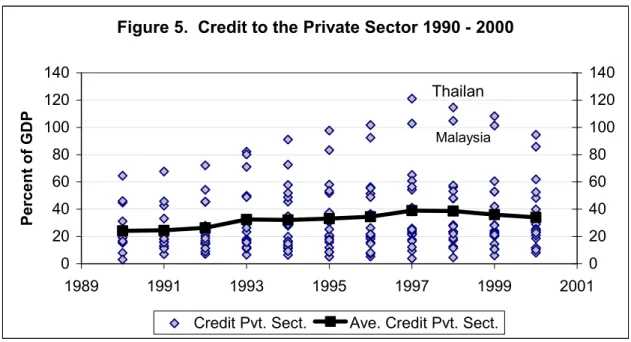
Credit to the private sector has been recognized as a key element in banks’ contribution to growth.31 However, from 1993-2000, bank credit to the private sector increased from 32.5 percent of GDP to only 35.1 percent of GDP, on average in the 18 countries reporting this data (Figure 6).32 On average, bank credit to the private sector rose relative to GDP up to 1997 and then declined, even while bank deposits continued to rise as discussed in Section II. For the whole period 1993 to 2000, twelve of the 18 countries experienced a rise in bank credit to the private sector, as a percentage of GDP, while 6 experienced an absolute decline.33 Between 1997 and 2000 credit to the private sector rose in only half the countries, largely because of bank crises and restructurings.34 Finally in terms of intermediation, the ratio of private credit to deposits fell in 11 of the 18 countries between 1993 and 2000.
The slow growth of average private sector bank credit in these countries largely reflects the restructurings. It also reflects the slow growth in the ratio of deposits and capital to GDP (7 percentage points of GDP) in these countries35 and the rise in banks’ net holdings of central bank debt and foreign assets. The restructurings removed large amounts of non-performing, private credits from bank balance sheets, notably in Brazil, Indonesia and Mexico, as discussed in Section III.2.
Excluding these three crisis countries, private sector credit performed much better. In the remaining 15 countries it rose from about 28 percent of GDP in 1993, on
31 See for example, Levine and Zervos, 1998, Beck, Levine, and Loyaza, 2000, and Levine, Loyaza, and Beck, 2000, for statistical evidence on the importance of credit to the private sector in growth and financial development. See also King and Levine, 1993. Simple correlations on data in the 1990s are consistent with these results, as discussed in Annex 1.
32 Footnote 30 lists the countries reporting private sector credit separately from public enterprise credit. 33 Brazil, Czech Republic, Indonesia, Mexico, Venezuela and Russia (which was roughly constant). 34 The countries in which private sector credit fell after 1997 are Czech Republic, Indonesia, Malaysia, Mexico, Philippines, Russia, Thailand, Turkey, and Venezuela.
35 China and Korea, two countries where deposits grew rapidly, are not included in this analysis because they do not report data on private sector credits separately. Note again that Brazil suffered a sharp drop in the deposit to GDP ration from 1993 to 2000 according to the IFS.
average, to about 40 percent of GDP in 1997 and then fell somewhat, to about 37 percent of GDP in 2000.36
This analysis suggests that crowding-out during the 1990s is not straightforward, as discussed in Section II.2, and that the productivity of private sector credit and the crises are major issues for financial intermediation. The non-performance of numerous loans exposed by the crisis implies that they were less productive than might have been expected.37 In East Asia, for example, aggregate capital output ratios began to rise before the crisis, at the same time as private sector credits and off-shore borrowings were rising rapidly (World Bank 2000a). And, the overhang of the recapitalization bonds after the crisis seems likely to crowd out the growth of new private credit.
Another related issue is the credit that privatizations made available. Public enterprises are notorious in their excess use of capital and credit. Hence, one might expect that credit demands of these enterprises should fall once they are privatized, making more credit available for other private enterprises.38
36 Thailand, despite its major banking crisis, reported a rise in bank credit to its private sector over the decade as a whole, though it fell sharply after the crisis, as shown in Figure 6. The bank restructuring in Thailand was somewhat different than in Brazil, Indonesia, and Mexico (footnote 25) and deposits and credit from non-banks in Thailand fell substantially after the crisis, as discussed in Section IV.1. A shift in these deposits to banks may account for the continued growth of Thai bank deposits after the crisis. Malaysia’s private sector bank credit suffered a similar but less intense fall after the crisis.
37 See World Bank, 2000a, for a discussion of some possible explanations of why the credits in East Asia were unproductive, including corruption and massive over-leveraging by the borrowers. Nonetheless, Annex 1 indicates that the initial stock of private credit in 1990 was positively related to growth during the 1990s, in spite of the large volume of non-performing loans that developed over the decade.
38 The potential increase in credit may have been damped to the extent that better cash management by the privatized enterprises reduced the enterprises’ bank deposits.
Figure 5. Credit to the Private Sector 1990 - 2000
0 20 40 60 80 100 120 140 1989 1991 1993 1995 1997 1999 2001 Percent of GDP 0 20 40 60 80 100 120 140
Credit Pvt. Sect. Ave. Credit Pvt. Sect.
Thailan
The changes in the Transition countries, where substantial privatization occurred, suggest that this process often did not occur, however. In both the Czech Republic and Russia, bank credit to public sector enterprises fell sharply from 1993 to 2000, but credit to the private sector enterprises stagnated, reflecting rises in government and central bank debt. Only in Poland among the Transition countries in this sub-sample, did credit to the private sector rise, while credit to the public sector enterprises fell. Among the other countries in the sample, in Argentina, Egypt and Peru credit to private enterprises did rise as a percent of GDP at the same time as credit to public enterprises fell. However, in Argentina and Peru, this pattern was largely due to the rise in deposits; the initial credit to the public enterprises was relatively low, compared to GDP, because of the small size of the banking system after their hyperinflations. The privatizations were accompanied by a decline of only about 1-1.5 percent of GDP in credit to public sector enterprises.
E. Bank Credit to Non-bank Financial Intermediaries (NBFIs)
Net credit from banks to NBFIs was only 1.1 percent of GDP in 2000, on average for the 25 countries (Table 3). This figure represented a rise from a negligible 0.1 percent of GDP in 1990. These average figures reflect the netting of credit from banks to non-monetary financial institutions and loans to banks from development banks (and joint venture banks) in the IFS data.
The average numbers conceal substantial differences between regions and countries, however (Table 3). These differences are related to differences in the interaction of three broad types of financial institutions over the 1990s: development banks, other NBFIs, and universal commercial banks
For the seven Latin American countries, net borrowing of the banks from non-bank intermediaries averaged about 1 percent of assets in both 1990 and 2000. However, this relatively constant figure conceals a number of different country patterns, in large part reflecting differences in the changing role of development banks.39
39 In Latin America, development banks were traditionally important and often much of their lending was through banks. Reflecting this pattern, the banks in Brazil, Chile, Colombia, Mexico and Venezuela started the decade as net debtors to non-banks, i.e., net credit of banks to non-monetary financial institutions was negative, because of the importance of on-lending by development banks. However, in Colombia, Mexico, and Venezuela during the 1990s, the banks’ holding of instruments from non-monetary financial
institutions grew faster than the credit they received from development banks, in part reflecting
restructurings of the financial system and the growth of NBFIs. By 2000, banks in these three countries had become net creditors of the non-bank sector. Only in Brazil and Chile did the net borrowing from development banks (and joint venture banks) grow relative to GDP. Finally, in Argentina and Peru, development banks had been closed or were closing in the early 1990s and universal banking was taking hold, including the effective conversion of some development banks to universal banks. By the end of the decade, reported net credit of banks to non-banks was zero in these two countries.
Table 3
Net Bank Credit to Non-bank Financial Institutions (Selected years, percent of GDP) Year All Sample Countries
with data America (7) Latin (excl. China) East Asia(5) Middle East & North Africa (3)
1990 0.1 -1.0 1.2 0.9
1993 -0.1 -1.9 1.8 0.4
1995 0.4 -0.7 2.4 0.5
2000 1.1 -1.1 4.1 3.6
In East Asia over the 1990s, banks were growing net lenders to NBFIs (except Korea), with credits in Malaysia and Thailand reaching the large figure of over 7 percent of GDP. In many cases, the initial growth of these credits reflected the development of bank-like NBFIs such as finance companies. Often these NBFIs were linked to the banks in a conglomerate structure. Toward the end of the decade, some banks in East Asia also became creditors of asset recovery institutions as part of the post crisis clean-up of their balance sheets.
In the rest of the countries the experience was mixed, with NBFIs accounting for relatively small amounts of bank credit even by the end of the decade. In the Middle East and North Africa, the whole growth in average credit to NBFIs is explained by the
growth in bank credit to non-bank intermediaries in Morocco. In some countries, such as the Czech Republic and Russia, a small non-bank sector developed over the decade.
In many of the remaining countries, notably China, India, Korea, Hungary, Pakistan, Poland, reported net bank lending to non-banks was very small or zero but this may simply reflect a lack of separate reporting of these transactions. For example, bank credit other than to government may simply reported as a residual, as noted above, and non-deposit liabilities other than to the monetary authority may simply be aggregated into an “Other liabilities” category. However, this does not mean NBFIs and development banks do not exist in these countries. For example, in India, a large NBFI sector
developed in the 1990s before suffering a crisis in 1997 (World Bank 2000b). Moreover, the three Indian development banks were among the largest financial institutions in the country in 2000 and the banks held bonds of these institutions.40 In Pakistan, a number of small leasing companies, investment banks, Islamic banks, etc. exist, often linked to some of the banks.
IV. Competition from On-shore and Off-shore Institutions and Markets. A. Competition from Domestic NBFIs and Markets
In many countries in the sample, a subset of NBFIs compete with banks in taking deposits and offering credit, albeit under somewhat different regulations than banks.
40 In 2002, one of these institutions merged into its associated commercial bank, becoming the second largest commercial bank in the country.
These institutions include credit unions, cooperative banks, finance companies, and savings banks, including postal savings banks. Their development reflects both policies and regulatory loopholes, as well as the increasing size and diversity of national financial systems and the development of customer niches. Often, these NBFIs are linked to banks, as parts of financial conglomerates. Another group of NBFIs, development banks, is competitive with banks only at the long-end of the market and often the development banks are more complementary to banks than competitive because of their lending through banks. A third group of institutions contractual savings institutions, such as life insurance companies and institutions providing fully-funded pensions, is even less competitive with banks.41 Because this group is not a large source of competition for banks and because of lack of comparable data, this group is not considered here. 42
Availability of cross country data in the IFS on the first two classes of NBFIs is mixed. Eleven of the 25 countries do not report such data.43 However, this does not mean these countries do not have non-bank sectors. For example, India does not report data on the non-bank sector and Pakistan reports only data on the government savings bank, but both have NBFIs as discussed above.
The largest and most competitive NBFI sectors are in Malaysia, Thailand, and India. In Malaysia and Thailand, the non-bank sector deposits were, respectively, 30 and 27 percent of bank deposits in 2000, though these figures represent a decline from the 46 and 33 percent figures of 1992. In India, the deposits of the Non-bank Financial
Corporations (not including cooperative banks), which are not covered in the IFS, reached nearly 10 percent of the those in the banking system in 1997, before the crisis in the 1997 system (See Hanson, 2003, and World Bank, 2000b).
In the other Asian countries, NBFIs are small and do not represent much competition for banks.44 In Latin America, Egypt and Turkey, the non-banks also are
41 The number of countries in which at least part of retirement income is based on fully-funded pensions and individual accounts has increased enormously since the early 1990s. In the 25 country sample, the countries that have joined Chile since 1994 are Argentina, Colombia, Mexico, and Peru from Latin America, plus Hungary, Poland, and Thailand (Fox and Palmer, 2001). Such pension institutions compete with banks for long term deposits and, in some cases, for mortgages, but they also often invest in banks’ longer-term deposit instruments. In countries where lump sum payments are made at retirement, in lieu of annuities, bank deposits may be increased by deposits from retirees.
42 The IFS reports data on insurance companies for Korea and South Africa.
43 The data is found in the IFS lines 40-49. Among the 25 largest developing country financial systems, the IFS reports separate data on such NBFIs for 14 countries: the seven Latin American countries, four East Asian countries (Korea, Malaysia, Philippines, and Thailand), Egypt, Morocco (1990-1996), and Turkey. No data, or minimal data are reported for Algeria, China, Czech Republic, Hungary, Indonesia, Poland, Russia, South Africa, Bangladesh, India, and Pakistan.
44 In Korea, the non-bank sector covered in the IFS is also large to bank deposits, nearly the same size in 1992 and, despite declining in absolute terms, still represented 25 percent of bank deposits in 2000. But over 80 percent of the reported NBFI sector consists of trust accounts of commercial banks, and thus is not really competitive with banks. The Philippines data cover only a small NBFI sector, largely composed of development banks and savings banks.
small relative to the banks and do not represent much competition for them.45 What explains the differences in the role of NBFIs in Malaysia, Thailand and India, where they were much more competitive with banks than the NBFIs in Latin America, Philippines, Turkey and Egypt? First, the financial systems in the East Asian countries are larger, relative to GDP, and the financial system in India is large relative to its GDP. These large financial sectors may have left more room for specialized
institutions. Second, the composition of the institutions may explain the difference. In many of the countries the NBFI sector covered in the IFS consists of development banks and savings banks that are in decline. In contrast, in Malaysia and Thailand, and to some extent in India, finance companies were an important part of the sector.46 These
institutions grew rapidly up to 1997. Their growth in Malaysia and Thailand was reversed by the East Asian crisis and in India by a domestic crisis in the sector (World Bank, 2000b, Hanson, 2003). In all three countries, the finance companies appear to have grown by servicing new clientele with mortgages and consumer finance, but also under an easier regulatory and supervisory environment than the banks. For example, in India before 1997, the limits applied to bank deposit interest rates were not imposed on the non-bank financial corporations, and they faced easier capital requirements and supervision; after the 1997 crisis regulation and supervision was tightened substantially. Thus, the competition between the NBFIs and the banks in these three countries was partly regulatory competition, and the NBFIs’ competitiveness with banks declined as they shrank and became more heavily regulated after crises.
Markets for commercial paper and private sector bonds provide less competition for banks in most developing countries than they do in industrial countries. Generally speaking, these markets in developing countries are relatively much smaller than in the industrial countries that rely on credit markets, such as Canada, Japan, the U.K. and the U.S. The small size of these markets reflects the lack of the informational, infrastructural and legal frameworks in these countries and the lack of liquidity in small markets.47 However, these markets have developed to some degree in the East Asian economies and India (See, for example, World Bank, 1995). Nonetheless the competition from these markets is only beginning to push down bank spreads (See Hanson, 2003).
B. Competition from Off-shore: The Growth of External Finance in the 1990s
Banks in developing countries face off-shore as well on-shore competition. Public sector borrowers and, increasingly, private borrowers can raise funding off-shore as well as on-shore through increasingly open capital accounts. Depositors can place
45 In Latin America, average deposit mobilization by the non-banks fell from 4.9 percent of GDP in 1992 to 2 percent in 2000, according to the IMF data. Moreover, nearly 50 percent of the Latin American deposit figures reflect Colombia’s housing bank system. Non-banks’ deposit mobilization has been less than 10% of the banks’ in the other Latin American countries and fell over the decade in all of them countries, except Mexico. Egypt and Turkey are similar in that the non-banks’ deposits are much less than 10% of bank deposits. Over the decade, NBFI deposits rose relative to bank deposits in Egypt and but fell in Turkey. 46 Thai data also include the relatively slow growing development bank sector and the government savings bank. The discussion of India is based on national sources, not the IFS.
funds in off-shore banks.
This subsection will focus only on the relative size of credit from external and internal sources during the 1990s, and use World Bank data. Specifically, it will focus on the ratio of domestic bank credit (net credit to government, credit to non-financial public enterprise, and credit to the private sector) to external debt from private sources (short term external debt, external debt to banks and other financial institutions, and bonds). Henceforth, this external debt will be called private external debt. The use of the word private in this context is to distinguish this debt from bilateral and multilateral debt. Thus, this use of the word private refers to the source of credit, not the type of borrower. The subsection also compares private external credit to the private sector—“private-to private” credits. It will not discuss competition for deposits due to lack of data.48
Comparing the size of external and internal sources of credit is complicated by the need to use an exchange rate. When a sharp devaluation occurs, the stock of external credit (measured in local currency) immediately rises sharply relative to both GDP and domestic bank credit (in local currency). However, this simply indicates that external credit has become more burdensome, not that more external credit in foreign currency has been extended. Then, as the adjustment process continues, domestic credit tends to rise and the ratio of external debt (in local currency) to domestic credit tends to decline. For example, the sharp devaluations in East Asia in 1997 and 1998 immediately raised the ratios of external debt to GDP and to domestic credit sharply, even though external debt, measured in dollars, actually fell in 1998. 49 Sharp devaluations near the end of a year create a particular problem for comparisons with domestic credit by raising the domestic currency value of external debt sharply.50
Total private external debt grew fairly rapidly from 1990 to 2000, nearly 8 percent per year in dollar terms in the sample countries, as shown in Table 4.51 However, two
48 Two data sources exist on external funding of developing countries, (1) the World Bank’s Global
Development Finance on developing countries’ public and private sector debts reported by the debtors and
(2) the Bank of International Settlements’ data on OECD banks’ off-shore assets and liabilities reported by OECD banks. The World Bank data set seems to have greater coverage, probably because it includes loans of non-OECD banks and bond issues not held by OECD banks. It shows a much faster rise in developing countries off-shore borrowings than the BIS data. Only BIS provides data on off-shore deposits and it does not cover what is probably the fastest growing area of off-shore deposits and loans, off-shore banks in Asia. 49 Note that such cycles may be associated not only with crises, but simply with the flow of foreign capital and repayments in what is sometimes called the transfer problem.
50 This paper uses the end-of-year exchange rate to compare local currency and foreign currency values, in an attempt at compatibility with the end-of year figures used for domestic banking liabilities and external liabilities. In contrast, the World Bank’s Global Development Finance uses an unpublished average of past exchange rates to convert national income into dollars in order to generate ratios of external debt to GNI. This average smooths the sharp fluctuations in the ratio of external debt to national income that would occur if the end-of-year rate were used. However, this approach also changes the time pattern of ratios compared to use of end-of-year exchange rates. Moreover, for countries that devalue in most years at fairly high rates, such as Brazil and Turkey, the ratio of external debts to GDP in every year is lower with the World Bank method than with the end-of-year exchange rates.
51 The figures in Table 4 refer to a consistent sub-sample of 22 of the 25 countries. The excluded countries are the Czech Republic, where the World Bank debt data begin in 1992, South Africa, where the World Bank’s debt data begin in 1994, and Russia, where no IFS data for GDP is available before 1993.
distinct sub-periods exist: rapid growth (about 10 percent annually) between 1990 and 1997 and slower growth (about 4 percent per year annually) from 1997-2000. Private external debt (in dollar terms) actually declined in 2000 to the sample countries and has remained at roughly that level since then. In East Asia (outside China), the absolute decline began in 1998. In China and in Latin America, growth slowed after 1997 or 1998, respectively. However, growth of external debt rose in the Transition group and in Turkey after 1997.
Table 4
Source: World Bank, Global Development Finance data base.
Despite the growth in debt in dollar terms, the ratio of private external debt to GDP changed relatively little over the 1990s in the sample countries. Indeed, the ratio fell somewhat in the first part of the decade, then rose to roughly the same ratio as in 1990 between 1996 and 2000. The main explanation for these developments is that in dollar terms the GDP of the sample countries grew relatively rapidly in the first part of the decade, owing to appreciations of the real exchange rate. However, after 1994, large real devaluations raised the ratio of external debt to GDP, even as the growth of external debt in dollars slowed and then turned negative.52
In terms of countries, private external debt is highly concentrated. The five countries with the largest private external debt in 2000 — Brazil, Mexico, Argentina, Korea, and Turkey — accounted for 50 percent of private external debt. All five were among the ten countries with the largest private external debt in 1990. Four of the five largest borrowers in 2000 had growth rates of private external debt among the ten fastest rates in the 1990s. Korea’s debt more than tripled over the decade, the highest rate of all large countries. Concentration of private debt in the top five borrowers grew over the 1990s, with only Mexico’s external borrowing growing more slowly than the total
borrowings of the 25 countries. Finally, four of the five countries with the largest private external debt in 1990 suffered external debt crises between 1994 and 2001; only China escaped.
The (unweighted) average ratio of countries’ private external debt to GDP is higher than, and falls over the decade somewhat faster than, the ratio of total external debt to total GDP (Table 4, lines 3 and 2). The differences between the two figures
52 Broadly speaking, the World Bank estimates of the ratio of external debt to GNI show a similar time pattern, roughly constant, rather than falling in the first part of the decade, then rising gradually beginning in 1997. These differences reflect the slower depreciations of the World Bank’s calculated exchange rates compared to the year-end exchange rates used here.
Debt from Private External Sources in 22 Major Developing Countries, 1990-2000 1990 1991 1992 1993 1994 1995 1996 1997 1998 1999 2000
Total Debt
Billion US$ 570 595 634 701 798 926 1044 1139 1224 1223 1207
% of total GDP 25.1 24.6 23.5 23.5 23.8 23.2 23.3 26.6 27.0 27.2 25.5 Unweighted Average of the 22 countries
simply reflect the large absolute amount of external debt in a few countries that have low ratios of debt to GDP, in particular China and India, which account for about 10 percent of total external debt to the private sector.
Turning to the relative size of off-shore and on-shore credits, private external debt was equal to 89 percent of domestic bank credit for the years 1990-2000, on average.53 In other words, external financial institutions and markets were providing almost as much credit annually as domestic banks for the “average” large developing country during the decade. Lending of this size made external institutions and markets a major source of competition with domestic banks — much larger than domestic NBFIs, for example. In terms of changes, the relative importance of private external credit declined over the decade, in the “average” country, from an average of 126.5 percent in 1990 to 73.4 percent in 2000 (See Figure 6 and Table 4). The decline was rapid from 1990-1992, then resumed in 1995, only to reverse in 1998 and 1999, largely as a result of the sharp depreciations in East Asia.
What explains the falling trend in the ratio of private external credit to domestic credit over the decade, which seems paradoxical given the globalization of the 1990s? The high average ratio of external private debt to domestic credit in 1990 and its decline in the first few years of the decade mainly reflect sharp declines in the ratio in eight,
53 Reflecting the availability of data, these figures exclude Czech Republic and Russia from the period 1990-1993 and South Africa before 1994.
countries (mostly Latin American) that began the 1990s with an overhang of high external debt and depressed economies.54 The sharp declines in the ratio of debt shown in Figure 6 were largely the result of increases in these countries’ GDP denominated in dollars, as their real exchange rate tended to appreciate. At the same time, their external debt (in dollars) grew slowly or even declined because of restructurings. Peru’s case is the most extreme. In 1990, Peru had a ratio of private external debt to domestic credit of about 750 percent reflecting excessive external borrowing (on which it had defaulted), a hyperinflation that had shrunken the domestic financial system and the real economy, and large real devaluations. By 1992, private external debt had fallen 50 percent, while GDP in dollars (measured at year-end exchange rates) nearly tripled However, even excluding Peru, the ratio of private external debt to domestic bank credit averaged about 82 percent over the decade and declined from 98 percent in 1990 to 72 percent in 2000.
Thus the combination of the clean-up of the debt overhang and the rise in
domestic credit described earlier generated a relative substitution of domestic credits for private external credits for much of the decade.55 The substitution was interrupted by the large depreciations in East Asia that began in 1997. However, the substitution then resumed toward the end of the decade as a result of slowing or declining private external lending, deepening of domestic credit relative to GDP, and an appreciating real exchange rate relative to the depreciated levels of 1997 and 1998.
The overall averages conceal some substantial differences in regional averages and the changes in these regional averages over the decade (See Table 5). Latin America had by far the highest dependence on external credit (the regional average ratio of private external debt to domestic credit in the 1990s was 153 percent) but over the decade the ratio fell by over 50%, (from 250 percent in 1990 to 119 percent in 2000). East Asia differed from Latin America in having both a lower average ratio of private external debt to domestic credit and a different time pattern of changes in the ratio. In the first part of the decade, the ratio of private external debt to domestic credit declined because of the rapid growth of domestic bank credit and relatively fixed exchange rates, despite the rapid growth of private external debt in dollars noted above. In 1997, the ratio of private external debt to domestic credit rose sharply, but mostly because of the sharp
devaluations; public external debt rose only slightly in dollar terms. Thereafter, the average ratio of private external debt to domestic credit fell somewhat, reflecting a combination of a fall, in dollar terms, of public external debt, 56 a strengthening real
54 In Argentina there was a decline in the ratio of private external credit to domestic credit of 34 percentage points between 1990 and 1992; in Brazil, 23 percentage points, followed by another 45 percentage points over the next two years; in Chile, 28 percentage points, in Mexico, 66 percentage points; in Venezuela, 34 percentage points, in the Philippines, 57 percentage points; in Poland, 100 percentage points; and, the largest decline of all, in Peru 470 percentage points.
55 To some extent these liberalizations involved the domestic financial system’s increasing use of foreign exchange denominated loans and deposits. It is thus worth noting that the relative shift from foreign to domestic sources of credit did not imply a similar reduction of exchange risk for the economy.
56 In addition to the reduction of credits, the decline in external credit measured in dollars may also reflect a depreciation of the yen, in which much of the debts were denominated, after 1997.