https://doi.org/10.30585/jrems.v1i2.322
© 2019the Authors. Production and hosting by Avicenna FZ LLC. on behalf of Dubai Business School, University of Dubai –United Arab Emirates. This is an open access article under the CC BY-NC license
Page | 1 Available online at: http://publications.ud.ac.ae/index.php/jrems
Information Processing Effects of Accounting
Consistency: Evidence from Egypt
Reem E. Bedeir
a, Mohamed H. Abdel-Azim
ba Accounting Department, Faculty of Commerce, Cairo University, Cairo, Egypt, [email protected] b Accounting Department, Faculty of Commerce, Cairo University, Cairo, Egypt, [email protected] .
Received:10 November2018, revised:10 February 2019, accepted: 20 March 2019, published: 9 April
ABSTRACT
Using path analysis, this study investigates the direct and indirect effect of accounting consistency and accounting-based earnings quality proxy on market synchronicity of the Egyptian listed firms. We firstly examine how time-series accounting consistency achieves earnings quality. We find a significant association between time series accounting consistency and lower variation of accruals residuals. We also examine the direct impact of accruals quality on stock returns synchronicity. We find a significant association between lower variation of accruals residuals and higher stock returns synchronicity. Finally, we examine the direct and indirect impact of accounting consistency on market synchronicity. We find that the consistent use of accounting policies can achieve market synchronicity only after achieving earnings quality. Our findings indicate that earnings quality increases the effect of time series accounting consistency on achieving stock returns synchronicity.
Keywords: accounting consistency, applied policies; earnings quality; accruals quality; stock returns informativeness; stock returns synchronicity.
1. INTRODUCTION
Standard-setters and security commissions have emphasized on the importance of comparability and consistency over financial statements. International Accounting Standard Board (IASB) (2015) defines the comparability as enhancing qualitative characteristic that “enables users to identify and understand similarities in, and differences among items”. Comparability does not relate to a single item. A comparison requires at least two items. While consistency is related to comparability but is not the same. IASB (2015) defines the consistency as “the use of the same methods for the same items, either from period to period within the same reporting entity or in a single period across entities”. Therefore, comparability is the goal and consistency helps to achieve this goal. However, many studies investigate the role of comparability, in comparison with studies that investigate the role of consistency. In this study, we focus on accounting consistency role in achieving financial statements quality and stock returns informativeness. The accounting consistency measurement is based on Salton et al. (1975), who used Vector Space Model (VSM) to highlight the similarities between documents. In addition, Peterson et al. (2015) used VSM to measure accounting consistency to capture similarities of accounting policies between firms which were disclosed in the footnotes of the financial statements. In order to measure accounting consistency from year to the next for the same firm; VSM captures the similarities of time series accounting policies disclosed in the footnotes of the financial statements (hereafter, time series accounting consistency). As well, to measure accounting consistency between firms operates in the same industry; the VSM captures the similarities of the cross-sectional accounting policies disclosed in the footnotes of the financial statements (hereafter, cross-sectional accounting consistency. Earnings quality literature has grown rapidly in the late 1990s. This dramatical growth in earnings quality studies is driven by several factors. The main factor is the phenomena of earnings management through U.S. public companies, in which managers opportunistically manipulate earnings numbers to meet or beat investor and analyst expectations. In this vein, the auditing profession`s engagement in such practices sheds light on auditing quality research and its impact on earnings quality. Another factor, the introduction of Jones model (1991) has accelerated the growth of earnings quality studies, as many studies provide several modifications
Page | 2 and models to capture earning quality. In addition, the adoption of International Accounting Standards (IAS) also increased the growth of earnings quality research. The International Accounting Standards Board (IASB) aimed to develop high-quality set of standards; such converting has increased the researchers` motivations to investigate its impact on earnings quality. Finally, the widespread of new databases (e.g. EDGAR, Compustat and Thomson, CRSP, ExecuComp, and IRRC) has facilitated gathering data and applying large sample in earnings quality studies (DeFond, 2010). Therefore, in this study, we examine the relationship between accounting consistency and earnings quality.
Information environment is an obscure phrase due to the bulk of attributes related to it (e.g., information risk, information asymmetry, stock returns volatility, stock price/ returns synchronicity), and to the extent that there are a huge of proxies and models which have introduced measures to these attributes. Moreover, there is neither theoretical nor empirical framework aggregate the information environment attributes at one structure (Barron et al.,1998; Horton et al., 2013).
One major issue that has dominated the stock market research for many years concerns stock returns. For the stakeholder, stock return considers as a signal of stock informativeness. This informativeness of stock returns is always a keen topic in the accounting literature. Specifically, more recent attention has focused on stock synchronicity as a measure of stock informativeness. Prior studies on stock markets had noted the importance of stock returns in revealing information about the industry and the market, in addition to information about the corporates (Roll, 1988). The extent to which all stock returns are illustrated by returns variation in industry-level or in market-level. Explicitly, the returns variation of these two levels (i.e. industry-level or in market-level) could be referred to a systematic movement, whereas the remaining movement is referred to an idiosyncratic movement. Thus, the greater idiosyncratic movement is reflected in less stock returns synchronicity movement (Beuselinck et al., 2010).
Therefore, we focus on stock returns synchronicity, to reflect the role of accounting consistency and earnings quality on firm-specific information that is reflected in stock returns. Piotroski and Roulstone (2004) define stock returns synchronicity as “The extent to which market and industry returns explain variation in firm-level stock returns”. The prior literature on stock returns provides evidence about stock returns synchronicity as a measure of firm-specific information that is represented into the comovement of stock returns. The study of Morck et al. (2000) which covered 40 countries, provide empirical evidence that that stock returns synchronicity is observed more in emerged stock markets rather than in developed stock markets.
We start the investigations by examining the relation between accounting consistency and earnings quality. We expect more consistent use of accounting policies will result in higher earnings quality. The time series accounting consistency test reveals that firms with low consistency in using accounting police have significantly higher absolute residual estimates from accrual models. Then, we investigate the role of accounting consistency on market returns informativeness. We examine the direct impact of accounting consistency on stock returns informativeness measured by stock returns synchronicity. We expect that more constant in using accounting policies results in higher stock returns synchronicity. However, our findings reveal that the mean coefficient estimate of the model is insignificant. Therefore, firms with high accounting consistency do not have higher stock returns synchronicity than firms with low accounting consistency.
Earnings quality plays a vital role in assisting the users of financial statements at the equity valuation process. This role is achieved by increasing the informativeness of financial statements. Bulk number of studies had introduced different consequences of earnings quality. However, limited attention was paid to investigate the impact of earnings quality on stock returns synchronicity. Therefore, we expect that higher quality of earnings results in higher stock returns synchronicity, whether on cross-sectional or time series analyses. In particular, this study focuses on stock returns synchronicity as a consequence of accruals quality. We expect that more accruals quality reflected in the lower variation of residuals will result in more stock return synchronicity. We find that firms with high earnings quality have higher stock returns synchronicity than firms with low earnings quality.
Similar to Rao (2018), we test the joint impact of two determinants (i.e. accounting consistency and earnings quality. on stock returns synchronicity. Most studies had examined one side of earnings quality, either as determinant or as consequence. However, a determinant may have a potential impact on earnings attribute/s and at the same time earnings attribute/s may have a potential impact on an outcome. Therefore, examining this mediate effect of earnings quality attributes is an open question (Dechow et al., 2011). Therefore, in this study, we investigate the mediate effect of earnings quality on the relationship between accounting consistency and stock performance measured by stock returns synchronicity. We expect that earnings quality increases accounting consistency`s effect on stock returns synchronicity. The results reveal that accruals quality increases accounting consistency`s effect on stock returns synchronicity.
Page | 3 This study contributes to the literature in many ways. Firstly, to the best of our knowledge, this study is amongst the first to examine the relationship between accounting consistency and earnings quality and investigate its impact on capital market aspect (stock returns synchronicity) for the Egyptian listed firms. The Egyptian accounting standards emphasize on comparability and consistency over financial reports and improving the information content of financial statements. In addition, improving the comparability and consistency of financial reporting may reduce the information risk for non-sophisticated investors, helping them to compete better with sophisticated investors (e.g. institutional investors). This leads to increase stock returns informativeness reflecting into stock returns synchronicity.
Secondly, this research goes beyond the relationship between accounting consistency and earnings quality by extending this relationship by investigating the correlated effect of accounting consistency and earnings quality on stock returns synchronicity. Thirdly, most studies have examined one side of earnings quality effect, either as determinant or as consequence. However, a determinant may have a potential impact on earnings attribute/s and at the same time earnings attribute/s may have a potential impact on an outcome. Therefore, examining this mediate effect of earnings quality attributes is an open question which we try to address in this study. Finally, this study provides a guide to the market regulators and standards setters to take this guide in consideration during issuing new market regulations and financial reporting standards. As a consistent use of accounting policies might have a significant impact on shaping financial reports` quality and stock market informativeness. The paper proceeds as follows. Section II provides a literature review and hypotheses development. Section III provides variables measurement and sample selection. Section IV includes the empirical test and discusses the results. Section V provides robust checks with alternative measures, VI concludes.
2. PRIOR LITERATURE AND HYPOTHESES DEVELOPMENT
Accounting consistency over financial statements and Earnings quality are becoming the heart of financial reporting quality. Therefore, since many years, they received more and more attention and were the centre of debate for investors, regulators as well as researchers. This heightened attention to the relationship of accounting consistency and earnings quality due to the wave of accounting scandals of the early 2000s. Therefore, prior literature seeks to understand how accounting consistency over financial statements guaranteed earnings quality.
Hence, in order to determine the literature gaps, define the relationship between main variables and the direction of each relation this literature discussed and analysed the recent studies devoted to the topics of accounting consistency and earnings quality. From this review, it is expected that the relationship between accounting consistency and earnings quality would be revealed. In addition, this review discussed the impact of the relationship between accounting consistency and earnings quality on stock market performance measured by stock returns synchronicity. Furthermore, it would help to better understand the indirect impact of accounting consistency through earnings quality on the stock returns synchronicity.
Many studies in accounting literature have focused on modelling and measuring the qualitative characteristics of financial information, one of these characteristics is comparability. De Franco et al., (2011) are the first study to develop an empirical model to measure comparability. The main concept of their measure depends on earnings forecast quality. They find that a higher earnings forecast quality is related to higher analyst coverage and lower analyst dispersion, due to increase comparability. In addition; De Franco et al., (2011) document capital market benefits from financial statements` comparability. They find comparability reduces the cost of information acquisition by increasing the availability of financial information. Moreover; Barth et al., (2013) document the capital market benefits from increasing comparability in U.S. firms that adopt IFRS rather than firms that adopt U.S GAAP.
In comparison with comparability, little attention is paid to consistency in the accounting literature. However, Armstrong et al. (forthcoming) examine the economic consequences of IFRS mandatory adoption in different European stock markets. They argued that applying IFRS required consistent use of accounting policies to enhance comparability and consistency over financial statements. Also, Yan (2018) empirically examine the relationship between IFRS adoption and earnings quality in Chinese listed firms. Yan argued that his study was a unique study as it provided deeper insights into how accounting consistency that results from IFRS adoption might affect the quality of financial statements. Peterson et al. (2015) investigate the effect of time-series and cross-sectional accounting consistency on four of information environment attributes; earnings quality, information asymmetry, analyst coverage and stock return synchronicity. They document a significant and incremental association between accounting consistency and earnings quality, accounting consistency decreases information asymmetry and increases both of analysts’ coverage and stock returns synchronicity. In
Page | 4 addition, Brown and Huang (2012) provide evidence about the relationship between the consistent use of forecasting patterns and achieving a high quality of earnings.
Earnings quality literature had classified into two main categories. First category: the determinants of earnings quality, determinants studies examine the impact on earnings outcome. In which earnings quality attribute/s is the dependent variable and the determinant is the independent variable. Second category: the consequences of earnings quality, consequences studies review the impact of earnings quality attribute/s on an outcome. In which earnings quality attribute is the independent variable (Dechow et al., 2010). Cheng et al. (2016) document the role of internal mechanisms of corporate governance in mitigating real earnings management as an indication of poor earnings quality. They focus on board turn over and management compensations to capture internal mechanisms of corporate governance. In addition, Demerjian et al. (2013) investigate the association between managerial ability and earnings quality. The results show that managerial ability is positively associated with earnings persistence and accruals quality, and negatively associated with restatement and error in bad debt provision. A voluminous number of studies examines the impact of corporate governance characteristics (e.g. board characteristics, internal control procedures, compensation structure, executives change, and institutional ownership) on earnings quality attributes. Armstrong et al. (2010b) test the relation between equity-based compensation and earnings management. Larcker et al. (2007) examine the relation between fourteen characteristics of corporate governance and earnings quality. While Cohen et al. (2008) investigate the role of Sarbanes- Oxley Act (SOX) on mitigating earnings management practices. Doyle et al. (2007a) examine the relationship between internal control quality and earnings quality. However, none of these studies examines both effects. Most studies have examined one side of earnings quality, either as determinant or as consequence. However, a determinant may have a potential impact on earnings attribute/s and at the same time earnings attribute/s may have a potential impact on an outcome. Therefore, examining this mediate effect of earnings quality attributes is an open question (Dechow et al., forthcoming). This study contributes to earnings quality literature as we investigate; the impact of accounting constancy on earnings quality (determinant), the impact of earnings quality on stock returns synchronicity (consequence) and the mediated role of earnings quality on the relationship between accounting consistency and earnings quality.
Recent studies have focused on stock price/returns synchronicity as evidence of information content of stock returns. Devos et al. (2015) examine the relation between investor response to analysts’ recommendations and stock returns synchronicity. Bissessur and Hodgson (2012) investigate the impact of IFRS adoption on information environment. They use stock price synchronicity to reflect changes in the information environment after IFRS adoption. Gul et al. (2007) investigate the link between corporate governance and stock price synchronicity in the Chinese stock market. Chan and Hameed (2006) document the role of the analyst in stock price synchronicity. They find a significant and incremental association among analyst coverage and stock price synchronicity in emerging markets. Piotroski and Roulstone (2004) investigate the role of institutional investors, financial analysts and insiders on the movement of stock price. They find a negative relationship between institutional investors and stock price synchronicity and positive relationship with financial analysts and insiders. Durnev et al. (2003) provide evidence about the reflection of stock prices comovements on the capitalization of private information.
In this study we focus on information processing effects of accounting consistency, to extend that earnings are the starting point for investors and analysts in firms evaluating. While a variety of definitions of the term earnings quality have been suggested, in this study, we use the definition is suggested by Dechow et al. (2010). Dechow et al. (2010, P. 344) defined earnings quality as “higher quality earnings provide more information about the features of a firm`s financial performance that are relevant to a specific decision made by a specific decision maker”. We in this study depend on earnings quality`s definition which developed by Dechow et al. (2010), as this definition reflected two main points. The first; achieving higher earnings quality helps in providing financial statements’ users with relevant information. The second; achieving higher earnings quality contributes to achieving stock market informativeness. Three main Factors found to be influencing earnings quality have been explored from Dechow et al. (2010) definition. First, the quality of earnings will be achieved when the decision maker befits from the earnings number. Second, as earnings numbers reflect the financial results of the firms, high quality of earnings will be reflected in a considerable amount of information about financial results. Third, earnings quality will result from the linkage between financial performance and decision-making process. Therefore, this part of the study measures the direct impact of accounting consistency on earnings quality. We expect that more constant in using accounting policies will result in higher quality of earnings. Then, the first hypothesis can be formulated as follows:
H1: Firms with high accounting consistency have higher earnings quality than firms with low accounting consistency.
Page | 5 One major issue that has dominated the stock market research for many years concerns stock returns. For the stakeholder, stock return considers as a signal of stock informativeness. This informativeness of stock returns is always a keen topic in the accounting literature. Specifically, more recent attention has focused on stock synchronicity as a measure of stock informativeness. Prior studies on stock markets had noted the importance of stock returns in revealing information about the industry and the market, in addition to information about the corporates (Roll, 1988). The extent to which all stock returns are illustrated by returns variation in industry-level or in market-level. Explicitly, the returns variation of these two levels (i.e. industry-level or in market-level) could be referred to a systematic movement, whereas the remaining movement is referred to an idiosyncratic movement. Thus, the greater idiosyncratic movement is reflected in less stock returns synchronicity movement (Beuselinck et al., 2010).
In recent years, there has been an increasing interest in understanding stock movements. Synchronicity could be clarified in the term of stocks movement in the same market which moves in the same direction. Consequently, stock returns synchronicity could be achieved through both movements of stocks “upwards or downwards”. There is a need to understand what is meant by the word synchronicity. According to Patro and Gupta (2016, P. 62), stock synchronicity can be defined as: “Stocks in a share market moving in the same direction. The movement can be upward or downward, depending on the trend”. The definition of stock synchronicity introduced by Patro and Gupta (2016) is similar to that introduced by Sarod (2014, p. 52) “Synchronicity refers to the tendency for the stocks in a share market to move in the same direction”.
In this study, we measure the direct impact of accounting consistency on stock returns synchronicity and also the direct impact of earnings quality on stock returns synchronicity. We expect that more constant in using accounting policies will result in higher stock returns synchronicity. Accordingly, the following second hypothesis is formulated to test the impact of accounting consistency on stock returns synchronicity:
H2: Firms with high accounting consistency have higher stock returns synchronicity than firms with low accounting consistency.
Many studies have introduced different consequences of earnings quality. However, limited attention was paid to investigate the impact of earnings quality on stock returns synchronicity. Therefore, we expect that higher quality of earnings would result in higher stock returns synchronicity, whether on cross-sectional or time series analyses. In particular, this study focuses on stock returns synchronicity as a consequence of earnings quality on time series analyses. Hence, the following third hypothesis is shown below:
H3: Firms with high earnings quality have higher stock returns synchronicity than firms with low earnings quality.
In the preceding sections, the investigations are about a solitary effect of a determinant on stock returns synchronicity. Therefore, in this part of the empirical study, we try to investigate the correlated effect of accounting consistency and earnings quality on stock returns synchronicity. The above discussion will be formulated in the following fourth hypothesis:
H4: Firms with high accounting consistency and high earnings quality have higher stock returns synchronicity than firms with low accounting consistency and low earnings quality.
Most studies have examined one side of earnings quality, either as determinant or as consequence. However, a determinant may have a potential impact on earnings attribute/s and at the same time earnings attribute/s may have a potential impact on an outcome. Therefore, examining this mediate effect of earnings quality attributes is an open question (Dechow et al., forthcoming). Thus, we investigate the mediate effect of earnings quality on the relationship between accounting consistency and stock performance measured by stock returns synchronicity. The mediated role of earnings quality will be examined through the following fifth hypothesis:
H5: Earnings quality increases accounting consistency`s effect on stock returns synchronicity.
3. MEASUREMENT AND SAMPLE
In this section, we address all the measurements models for all types of variables: independent variables, dependent variable, mediator variable and control variables.
Page | 6 We measure accounting consistency based on Vector Space Model (VSM) that is widely used in computer science-based research to compare the textual similarities between texts. VSM used by Peterson et al. (2015) to measure cross-sectional and time series accounting consistency of financial statements. In order to measure accounting consistency from year to the next year for the same firm; VSM captures the similarities of time series accounting policies disclosed in the footnotes of the financial statements (hereafter, time series accounting consistency). As well, to measure accounting consistency between firms operates in the same industry; the VSM captures the similarities of the cross-sectional accounting policies disclosed in the footnotes of two financial statements (hereafter, cross-sectional accounting consistency). In this paper, to measure time series accounting consistency, we use VSM to the accounting policies that were disclosed in the financial statements` footnotes. We remove the stop words (common words that do not add content, e.g. and, will, because, and that) and stemming words (removing suffixes from words to obtain root words). Then we use VSM to convert unique words in a certain text into a vector. The value for a particular word in the vector is 1 if the stemmed word occurs in the text and 0 otherwise. Two different texts, for two different years for the same firm, can then be compared by measuring the cosine of the angle between the vectors. The cosine measure calculates the similarity between two documents represented by Vector 1 and Vector 2. Brown and Tucker (2011) take the cosine of the model to measure accounting consistency between two financial statements.
COSINEƟ = Vector1 .Vector 2
||Vector 1|| .||Vector2|| (1)
Where:COSINEƟ: refers to the cosine of the angle between two vectors, Vector1: refers to the accounting consistency of document 1, Vector 2: refers to the accounting consistency of document 2. The cosine’s range is [0,1], where 0 means the two documents have no similarity, and 1 means the two documents are the same. We use this cosine measure to calculate time series accounting consistency (Peterson et al, 2015).
3.2 Measuring Earnings Quality
The past thirty years have seen increasingly rapid introductions of models in the field of financial accounting to capture earnings quality. Those models have been categorized into three main categories; earnings attributes, investors` response to earnings, and external indicators of earnings misstatement. The first category, earnings attributes which includes; earnings persistence, earnings predictability, accruals, earnings smoothness, and timely loss recognition. The second category, investors` response to earnings which contains; earnings response coefficient or the R2 from the earnings-returns models. The third category, external indicators of
earnings misstatement which consists of accounting and auditing enforcement releases, restatements and internal control weaknesses (Dechow et al., 2010).
In order to examine the impact of accounting consistency on earnings quality, the impact of earnings quality on stock returns synchronicity, and the mediated effect of earnings quality on the relationship between accounting consistency and stock returns synchronicity, we select accruals quality proxy to measure earnings quality. We justify the selection of the accruals quality proxy as it is commonly proxy used in accounting literature to measure earnings quality and the availability of data that are needed to develop the accruals quality model on the financial statements of the Egyptian listed firms. High degree of accruals reflects the low degree of earnings quality. A possible explanation for this result may be a return to the lack of adequate earnings persistence. The main concept of development most accrual models based on identifying the abnormal accruals from normal ones. The most common and widely spread accruals model is Dechow and Dichev (2002) model. More specifically, we use the Dechow and Dichev (2002) model to measure accruals quality. According to Dechow and Dichev model, the abnormal accruals are the standard deviation of the residual from working capital accruals.
∆WCapialt= α0 + α1CFOt-1 + α2CFOt + α3CFOt+1 + εt (2)
Where: ∆WCapitalt refers to the change in working capital scaled by total assets, and CFOt-1 ,CFOt, and CFOt+1
refer to cash from operations for the previous year, current year, and next year respectively.
3.3 Measuring Stock Market Synchronicity
Measuring stock returns synchronicity is a complex process. This is due to the need for an extensive observation of stock co-movement for a long period of time. Morck et al. (2000) firstly introduced two models that had been extensively used in accounting literature to measure stock returns synchronicity; the classical model and R-square model. Furthermore, Skaife et al. (2006) had proposed a third model which is a zero return model. Morck et al. (2000) had proposed and developed a classical model to measure stock returns synchronicity for the entire market. The main concept of the Morck et al. model was to measure the tendency
Page | 7 of stock co-movement. While a considerable amount of literature has been used R-square model to measure stock returns synchronicity. R-square model which, developed by Morck et al. (2000), considers as a robust model to measure stock returns synchronicity in addition to its accuracy compared to the classical model. The primary concept in developing the R-square model is measuring the correlation between stock returns in firm-level and entire market-firm-level. In contrast, Skaif et al. (2006) had proposed and developed the zero-return model to measure stock returns synchronicity. They argued that the zero-return model is more reliable than both classical and R-square models. The main concept of developing the zero-return model based on the value of information about stock prices; if this value does not exceed the trading cost, the investors will not trade into the stocks. Therefore, the trading days would be zero-return.
In this study we measure stock returns synchronicity in the vein of the model that has been firstly introduced by Crawford et al. (2012), Crawford et al. regress the firm returns on the market and industry returns as it is shown in the following equation:
RETURNS i,t = α + β1MARKETi,t-1 + β2MARKETi,t + β3INDUSTRYi,t-1+ β4INDUSTRYi,t+ ei,t (3)
Where: RETURNS i,t refers to firm i stock returns in year t , MARKETi,t refers to value-weighted returns on
market level for i firms in year t, and INDUSTRYi,t refers to value-weighted returns for i firms operate at the
same industry in year t.
We regress the weekly returns of each firm i on the value-weighted returns of the market and industry. More specifically, to get the market-value-weighted returns, we use returns for all firms in the market. Also, to get industry value-weighted returns, we use returns for all firms in the same industry. In order to control for the lag effects, which would be appeared in multicollinearity among independent variables, we add the weighted value returns of lag period, represented in MARKETi,t-1 and INDUSTRYi,t-1. Following Durnev et al. (2003) we exclude
firms that do not have a full year weekly return. Then, we calculate the stock returns synchronicity as the following equation (Crawford et al., 2012):
SYNCHRONCITY i, t = Log ( R
2
1 − R2) (4)
3.4 Control Variables
In this study, we classify the control variables according to the dependent variables. Regarding to the first hypothesis, the dependent variable was the earnings quality. Regarding the second, third, fourth and fifth hypotheses the dependent variable was the stock returns synchronicity.
3.4.1 Control Variables of Earnings Quality
In order to define the control variables of earnings quality, we mainly use the control variables from Francis et al. (2004), Ashbaugh-Skaife et al. (2008) and Peterson (2015). We control for firm-specific characteristics that should explain differences in accruals and earnings characteristics. Therefore, we control for firm`s size, operating cycle, and operations volatility. The firm`s size is measured using total assets (Assets). The operating cycle (OpCycle) refers to the sum of days sales in accounts receivables and days sales in inventory. Finally, the operations volatility reflects the standard deviation of cash flows from operations (StdCFO) and the standard deviation on of sales (StdSales).
3.4.2 Control Variables of Stock Returns Synchronicity
In this study we use the control variables that have been identified in the prior literature of stock returns synchronicity; firm size and volatility of return on assets (Piotroski and Roulstone, 2004; Peterson, 2015). More specifically, the firm`s size is measured using total assets (Assets). While volatility of returns on assets is measured as the standard deviation of return on assets (StdROA).
Finally, we control for the industry and the year effect, we add LogIndu and Crisis variables in every panel of the regression model. In order to control for the industrial effect on each regression model, we add the industry size variable. Industry size is the natural logarithm of the total number of firms in each industry (LogIndu). In addition, to control for the yearly influences on the regression models, the sample is divided into two categories for each year from 2007 to 2017. The dummy variable equals “One” if an observation is classified to the year of the financial crisis (2008 – 2009) and zero otherwise. Detailed descriptions of all this study`s variables are explained in table 1.
Page | 8
Variable Name Variable Type Measurement
Accounting Consistency (CONSISTENCY)
Independent Variable To measure accounting consistency and it was calculated
through the cosine of the angel between two documents` consistency. Accruals Quality (AQ) Dependent Variable (H1), Independent Variable (H3,4), and Mediator Variable (H5)
To measure accruals quality and it was calculated through the standard deviation of the residual from working capital accruals.
Stock Returns Synchronicity (SYNCHRONCITY)
Dependent Variable To measure stock returns synchronicity and it was calculated through regressing the firm returns on market and industry returns, then calculate synchronicity according to this formula Log (R2/1-R2).
Firm Size (Assets) Control Variable Firm size was measured as a natural logarithm of total assets.
Operating Cycle (OpCycle)
Control Variable The sum of days sales in accounts receivable
(360/[sales/accounts receivables], and days sales in Inventory (360/[cost of goods sold/Inventory].
Standard Deviation of Cash Flows from
Operating (StdCFO)
Control Variable The standard deviation of [operating cash flows divided by total
assets].
Volatility in ROA (StdROA)
Control Variable The standard deviation of returns on assets.
Industry Size (LogIndu)
Control Variable The natural logarithm of the total number of firms in each
industry.
Crisis Control Variable The dummy variable equals “One” if an observation is classified to the year of 2008- 2009 and zero otherwise.
3.5 Sample Selection
The main objective of this study is to investigate the role of accounting consistency in achieving financial reporting quality and stock returns informativeness. More specifically, this study examines the impact of consistent use of accounting policies on earnings quality and their role on achieving stock returns informativeness measured by stock returns synchronicity.
We essentially aim to increase the reliability of financial reporting and stock market informativeness. Then, the population of the empirical study covers all firms listed in the Egyptian Stock Exchange. The sample consisted of all non-financial firms listed in EGX 100, during the period from 2007 to 2017. Following the prior literature in earnings quality research, we exclude the financial institutions from the sample. The explanation for such exclusion is that the financial institutions have special accounting rules which are unlikely to conform to other industries (Healy and Wahlen, 1999; Peasnell et al., 2005). The total number of the final sample was 79 firms with 829 firm-year observation.
4. EMPIRICAL TESTS
In order to produce the descriptive statistics of the whole sample, we conduct a univariate analysis; the location measures (mean and median) and the dispersion measures (standard deviation, quartiles Q1 and Q3) for the sample data. In addition, we apply a bivariate analysis “analysis of two variables in a single relationship” to examine the correlation between every two variables. Moreover, we apply multivariate analysis to test this study`s hypotheses. Multivariate analysis is: “an analysis of multivariable in a set of relationships” (Hair et al., 2009). We use multiple regression to examine the significant impact of all independent variables (accounting
Page | 9 consistency, earnings quality and controls) on the dependent variable (stock returns synchronicity). Finally, we examine the regression assumptions; the multicollinearity of independent variables.
4.1 Univariate Analysis ‘Descriptive Statistics’
Table (2) provides descriptive statistics for the whole sample. Mean and standard deviation values of accounting consistency are .2488 and .731 respectively. For accruals quality, the mean and standard deviation are .1738 and .3395 respectively.
Moving to dependent variables, table (2) reports that the mean and the standard deviation of stock returns synchronicity are .0812 and .5451 respectively. Finally, with the control variables, the mean and standard deviation of firm size are 8.414 and .9414 respectively.
For the operating cycle, the mean and standard deviation are .0222 and .0022 respectively. For industry size, the mean and standard deviation are .9654 and .2797 respectively. As it is shown, accounting consistency has a relatively high standard deviation. In contrast, accruals quality and stock returns synchronicity have a relatively low standard deviation.
Table 2. Descriptive Statistics for the Sample
N Missin
g
Mean Median Std. Deviation Q 25 Q 75
CONSISTENCY 819 10 .248848 .517616 .7310266 -.480119 .943109 AQ 810 19 .173835 .111328 .3395447 .031322 .322739 SYNCHRONCIT Y 819 10 .081219 .098169 .5451891 .017739 .311680 Assets 827 2 8.414020 8.467571 .9414191 7.995288 8.887069 OpCycle 810 19 .022269 .022427 .0022132 .020947 .023649 StdSales 829 0 3.526896E 7 2.094560 6.3853819E7 .552830 9.470000E 6 StdCFO 829 0 1.338867E 8 .567160 2.5513129E8 .090590 6.570000E 6
StdROA 829 0 7.594464E .380050 1.1703851E7 .161740 7.310000E
6
LogIndu 829 0 .965416 1.079181 .2797372 .845098 1.146128
Crisis 829 0 .1834 .0000 .38719 .0000 .0000
4.2 Bivariate Analysis “Correlation between Variables”
In order to apply a bivariate analysis; table (3), reports the correlation, alternatively, between accounting consistency, earnings quality, stock returns synchronicity and control variables. The main results shows insignificant positive correlation between accounting consistency and stock returns synchronicity (.054), insignificant negative correlation between accounting consistency and accruals quality, operating cycle, industry size, standard deviation of ROA, firms size, standard deviation of sales, standard deviation of CFO (-.020, -.266, -.034,-.051, -.069, -.070, -.074) respectively.
Moving to accruals quality: the results indicated an insignificant positive correlation between accruals quality and stock returns synchronicity, firms size, industry size, standard deviation of ROA and financial crisis (.040, .005, .046, .018, .052) respectively, insignificant negative correlation between accruals quality and operating cycle, standard deviation of sales and standard deviation of CFO (-.075, -.014, -.023) respectively.
Finally with stock returns synchronicity: the results indicated an insignificant positive correlation between stock returns synchronicity standard deviation of sales, standard deviation of CFO, standard deviation of ROA and industry size (.085, .075, .121, . 268) respectively, and insignificant negative correlation between stock returns synchronicity and firms size, operating cycle and financial crisis (-.038, -.141, -.013) respectively.
Page | 10
Table 3. Correlation between Variables
CONSISTE
NCY AQ
SYNCHRON
CITY Assets OpCycle
Std
Sales StdCFO StdROA LogIndu
Crisis CONSISTENCY 1 AQ -.020 1 SYNCHRONCIT Y .054 .040 1 Assets -.069* .005 -.038 1 OpCycle -.266** -.075* -.141** .352** 1 StdSales -.070* -.014 .085 -.005 .169** 1 StdCFO -.074* -.023 .075* -.001 .187** .999** 1 StdROA -.051 .018 .121 -.022 .099** .984** .974** 1 LogIndu -.034 .046 . 268 -.144** -.107** .515** .496** .578** 1 Crisis -.033 .052 -.013 .018 -.020 -.001 -.002 -.050 .001 1
4.3 The Effect of Accounting Consistency on Earnings Quality
In order to test the first hypothesis, we use the multiple regression model to investigate the impact of accounting consistency and identified list of controls on earning quality measures by accruals quality, and the model is shown below:
AQt = β0 +β1 CONSISTENCYt+ Controlst + εt (5)
Where: AQt refers to accruals quality in year t (dependent variable), CONSISTENCYt refers to accounting
consistency in year t (independent variable), Controlst refers to the firm size, operating cycle, operations
volatility, industry size and the crisis in year t (control variables), and εt refers to the model residual.
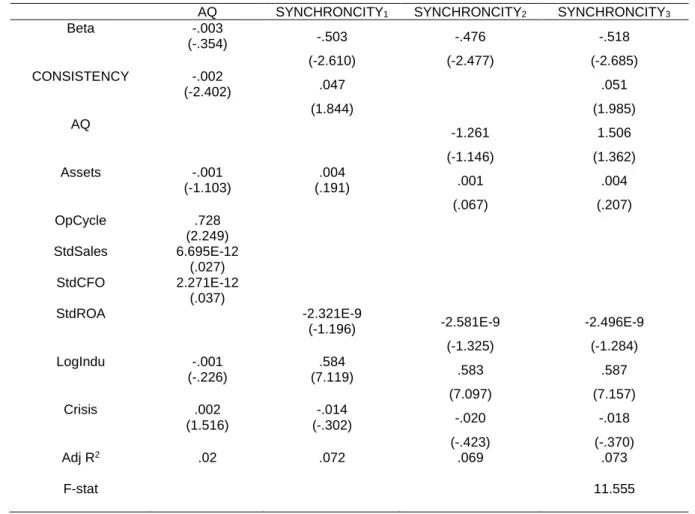
We expect that the consistent use of accounting policies will result in more accruals quality reflected in the lower variation of residuals (Peterson et al., 2015). Table (4), first column, provides the mean of the coefficient estimate and t-statistic of accounting consistency and control variables. The result indicates a mean coefficient estimate of (-.002). The β1 is negative and significant (P < 0.05). Therefore, the firms with high accounting consistency have higher earnings quality than firms with low accounting consistency, this supports the first hypothesis. The mean coefficient estimate β1 from the regression model has the value of -0.002, which is significant at 5% level (t-statistic= -2.402). This indicates that when accounting consistency increases by one unit, accruals quality increases by 0.002.
4.4 The Effect of Accounting Consistency on Synchronicity
In order to test the second hypothesis, we use the multiple regression model to investigate the impact of accounting consistency and identified list of controls on stock returns synchronicity, and the model is as the following:
SYNCHRONCITY1,t= β0 +β1 CONSISTENCY t+ Controlst + εt (6)
Where: SYNCHRONCITY1,t refers to stock returns synchronicity in year t (dependent variable),
CONSISTENCYt refers to accounting consistency in year t (independent variable), Controlst refers to firm`s
size, industry size, the standard deviation of ROA and crisis (control variables), and εt refers to the model
residual. We expect that the consistent use of accounting policies will result in more stock returns informativeness reflected in higher stock return synchronicity. Table (4), second column, provides the mean of the coefficient estimate and t-statistic of accounting consistency and control variables. The result indicates a mean coefficient estimate of (.047). The β1 is positive and significant (P < 0.05). Therefore, the firms with high accounting consistency have higher stock returns synchronicity than firms with low accounting consistency; this supports the second hypothesis. The mean coefficient estimate β2 from the regression model has the value of .047, which is significant at 5% level (t-statistic= 1.844). This indicates that when accounting consistency increases by one unit, stock returns synchronicity increases by 0.047.
4.5 The Effect of Earnings Quality on Synchronicity
Also, to test the third hypothesis, we use the multiple regression model to investigate the impact of earnings quality and identified list of controls on stock returns synchronicity, and the model is shown below:
Page | 11 Where: SYNCHRONCITY2,t refers to stock returns synchronicity in year t (dependent variable), AQt refers to
accruals quality in year t (independent variable), Controls refers to firm`s size, industry size, standard deviation of ROA and financial crisis (control variables), and εt refers to the model residual. We expect that firms with
high earnings quality have more stock returns informativeness reflected in higher stock return synchronicity. Table (4), third column, provides the mean of the coefficient estimate and t-statistic of earnings quality and control variables. The result indicates a mean coefficient estimate of (-1.261). The β1 is negative and significant (P < 0.05). Therefore, the firms with high earnings quality have higher stock returns synchronicity than firms with low earnings quality, this supports the third hypothesis. The mean coefficient estimate β1 from the regression model has the value of -1.261, which is significant at 5% level (t-statistic= -1.146). This indicates that when earnings quality increases by one unit, stock returns synchronicity increases by 1.261.
Table 4. Regression Estimates
AQ SYNCHRONCITY1 SYNCHRONCITY2 SYNCHRONCITY3
Beta -.003 (-.354) -.503 (-2.610) -.476 (-2.477) -.518 (-2.685) CONSISTENCY -.002 (-2.402) .047 (1.844) .051 (1.985) AQ -1.261 (-1.146) 1.506 (1.362) Assets -.001 (-1.103) .004 (.191) .001 (.067) .004 (.207) OpCycle .728 (2.249) StdSales 6.695E-12 (.027) StdCFO 2.271E-12 (.037) StdROA -2.321E-9 (-1.196) -2.581E-9 (-1.325) -2.496E-9 (-1.284) LogIndu -.001 (-.226) .584 (7.119) .583 (7.097) .587 (7.157) Crisis .002 (1.516) -.014 (-.302) -.020 (-.423) -.018 (-.370) Adj R2 .02 .072 .069 .073 F-stat 11.555
4.6 The Correlated Effect of Accounting Consistency and Earnings Quality
In order to test the fourth hypothesis, we use the multiple regression model to investigate the correlated effect of accounting consistency, earnings quality and identified list of controls on stock returns synchronicity, and the model is shown below:
SYNCHRONCITY3,t= β0 +β1 CONSISTENCY t+ β2 AQt + Controlst + εt (8)
Where: SYNCHRONCITY3,t refers to stock returns synchronicity in year t (dependent variable),
CONSISTENCYt refers to accounting consistency in year t (independent variable), AQt refers to accruals quality
in year t (independent variable), Controlst refers to firm`s size, industry size, standard deviation of ROA and financial crisis (control variables), and εt refers to the model residual. We expect that firms with high accounting
consistency and earnings quality have more stock returns informativeness reflected in higher stock return synchronicity. In order to test the fourth hypothesis, the global significance of the model should be investigated. We use the analysis of variance (ANOVA) and the adjusted value of R2 to measure the correlated effect of
Page | 12 Table (4), provides the f-statistics and the global significance of the model. The result indicates f-statistics of (11.555), and the model is significant (P < 0.05). Table (4), provides the value of adjusted R2 of (.073) which is
relatively low; however, it does not affect the global significance of the model. Therefore, firms with high accounting consistency and earnings quality have more stock returns synchronicity. This supports the fourth hypothesis.
4.7 The Mediated effect of Earnings Quality
Finally, to test the fifth hypothesis, we use Path Analysis to investigate the mediated effect of earnings quality on the relationship between accounting consistency and stock returns synchronicity. The test statistics and P-value of Sobel test are .0008 and .99 respectively. According to MacKinnon et al., (2002) we reject the null hypothesis that the earnings quality has no effect on the relationship between accounting consistency and stock returns synchronicity. Therefore, earnings quality increases accounting consistency`s effect on stock returns synchronicity.
5
.
R
OBUSTNESSC
HECKSWe apply a robustness check of the main results for the empirical test section.
5.1 Alternative Measure of Earnings Quality
Firms with earnings that continue from one period to the next have more persistence in earnings. It will be more meaningful to the investor who depends on persistent earnings to predict future cash flows in equity valuation process (Richardson et al., 2005). Earnings persistence could be measured by calculating the β from the following equation;
Earningst+1 = α + β Earningst +εt (9)
Where Earningst+1 refers to net income before extraordinary items of firm i on the next year, Earningst refers to
net income before extraordinary items of firm i on the current year, and β measures earnings persistence. Table (5) summaries the coefficient estimates of models (5,7,8) to model (8). The regression results of earnings persistence are consistent with our main results. In addition, Sobel text statistics and P- value are .3689 and 0.71 respectively.
5.2 Alternative Measure of Stock Returns Synchronicity
We use a model developed by Morck et al. (2000) as an alternative model of stock returns synchronicity. Morck`s model considers as a robust model to measure stock returns synchronicity in addition to its accuracy compared to the other models. The primary concept in developing Morck`s model is measuring the correlation between stock returns in firm-level and entire market-level as below:
R i t = α f + β R m, t + ε t(10) Where:
R refers to the stock return for the firm i for the period t, and R m, t refers to market return for the period t. The R-square could be calculated as follows:
R2i, t = [Cov (Ri, R m) /σ i σm ]2 (11)
Where:
Cov (Ri, Rm ) refers to the covariance between the firm returns for the firm i and market returns for the market
m, σ i refers to the standard deviation for firm i assets, and σ m refers to is the standard deviation of the total
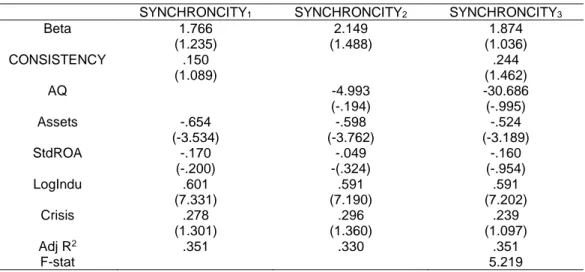
market assets. Table (6) summaries the coefficient estimates of models (6,7,8). The regression results of the alternative model are similar to our main results. In addition, Sobel text statistics and P- value are -.1790 and .8578 respectively.
5.3 Multicollinearity between Regressors
Multicollinearity between regressors means that there is a perfect correlation among independent variables. It commonly happens when a regression model has a large number of independent variables and multicollinearity happens when some independent variables consider as an indicator or measure for other independent variables in the same regression model. In addition, multicollinearity happened when dummy variables are misused in the regression model. However, perfect multicollinearity between regressors does not affect the
Page | 13 regression model`s estimators. They are linear, unbiased, constant and efficient. Nevertheless, when the regression model has multicollinearity between regressors, the model has greater standard errors. Consequently, the confidence intervals for the model`s estimators tend to be enlarged and t- statistics tend to be minimized (Greene, 2000).
Table 5. Regression Estimates of Earnings Persistence
Table 6. Regression Estimates of R-Squared Model
SYNCHRONCITY1 SYNCHRONCITY2 SYNCHRONCITY3
Beta 1.766 (1.235) 2.149 (1.488) 1.874 (1.036) CONSISTENCY .150 (1.089) .244 (1.462) AQ -4.993 (-.194) -30.686 (-.995) Assets -.654 (-3.534) -.598 (-3.762) -.524 (-3.189) StdROA -.170 (-.200) -.049 -(.324) -.160 (-.954) LogIndu .601 (7.331) .591 (7.190) .591 (7.202) Crisis .278 (1.301) .296 (1.360) .239 (1.097) Adj R2 .351 .330 .351 F-stat 5.219
There is no irrefutable test to explicitly indicate whether there is multicollinearity in the regression model. However, there are different warning signals to indicate if there is sever multicollinearity within the regression model. Then, in order to text multicollinearity, the degree of multicollinearity should be considered.
We in this study use the Variance Inflation Factors (VIF) or tolerance measure to indicate whether the independent variables are correlated. There is a rule of thumb is that: VIF value over ten or tolerance value below ten refer to a high correlation between independent variables (Gujarati, 2008). From table (7) the VIF values are below ten. Therefore, we conclude that there is no significant correlation between independent variables.
Persistence SYNCHRONCITY2 SYNCHRONCITY3
Beta .334 (.175) 2.339 (1.380) 2.512 (1.454) CONSISTENCY .058 (.407) .091 (.671) Persistence .093 (.603) .085 (.541) Assets .310 (1.22) -.408 (-2.567) -.428 (-2.627) OpCycle 133.644 (1.104) StdSales 6.788E-12 (.031) StdCFO 2.271E-12 (.037) StdROA 2.4301E-9 (1.411) 2.501E-9 (1.355) LogIndu .002 (.23) -.798 (-1.043) .815 (-1.057) Crisis .057 (.252) .037 (.175) .056 (.256) Adj R2 .078 .073 .060 F-stat 1.519
Page | 14
Table 7. MultiCollinearity Statistics
VIF CONSISTENCY AQ Assets OpCycle StdSales StdCFO StdROA LogIndu
CONSISTENCY - 1.009 AQ 1.022 - Assets 1.170 1.023 - OpCycle 1.407 1.314 - StdSales 1.334 - StdCFO 2.684 2.384 5.939 1.465 - StdROA 2.950 1.513 2.633 - LogIndu 1.761 1.542 1.744 1.766 1.431 1.028 1.023 - Crisis 1.005 1.002 1.005 1.004 1.006 1.006 1.004 1.006
6. CONCLUSIONS
The main purpose of conducting this study is to empirically investigate the role of accounting consistency in achieving earnings quality and stock returns synchronicity for listed firms in the Egyptian stock market, through increasing the financial information quality and stock returns informativeness. The analysis is to provide evidence about whether the consistent use of accounting policies increases, decreases, or has no effect on financial information`s environment (i.e. earnings quality) and stock returns informativeness (i.e. stock returns synchronicity). Further, the present study tests the mediated effect of earnings quality on the relationship between accounting consistency and stock returns synchronicity. In order to achieve these goals, the financial reports of listed firms in the Egyptian stock market, through years from 2007 to 2017, have been collected and analyzed to examine the role of time-series accounting consistency.
The foot-notes of financial statements have been analyzed to measure accounting consistency. Then, quantitative methods have been applied to determine the type and the direction of the relationship between accounting consistency, earnings quality and stock returns synchronicity. We find results consistent with our hypotheses. More specifically, we find that consistent use of accounting policies contributes to achieving accruals quality. We also find that earnings quality contributes to achieving stock returns synchronicity, this effect increases with a correlation with consistent use of accounting policies. Finally, the present study provides a guide to the market regulators and standards setters to take this guide into consideration during issuing new market regulations and financial reporting standards. As a consistent use of accounting policies has a significant impact on shaping financial reports and stock market informativeness.
ACKNOWLEDGEMENTS
We would like to thank Adam Zaremba and for his insightful comments that benefited the paper.
REFERENCES
Armstrong, C., Jagolinzer, A., & Larcker, D. (2010b). Chief executive officer equity incentives and accounting irregularities. Journal of Accounting Research, 48(2), 225–27.
Ashbaugh-Skaife, H., Collins, D., Kinney, W. & LaFond, R. (2008). The effect of SOX internal control deficiencies and their remediation on accrual quality. The Accounting Review, 83(1), 217–250.
Barron, O. E., Kim, O., Lim, S. C. & Stevens, D. E. (1998). Using analysts' forecasts to measure properties of analysts' information environment. The Accounting Review, 73(4), 421-433.
Barth, M. E., Landsman, W. R., Lang, M. H., & Williams, C. D. (2013). Effects on Comparability and Capital Market Benefits of Voluntary Adoption of IFRS by U.S. Firms: Insights from Voluntary Adoption of IFRS by Non-U.S. Firms. Working paper, Stanford University, The University of North Carolina at Chapel Hill, and University of Michigan.
Bissessur, S & Hodgson, A. (2012). Stock market synchronicity – an alternative approach to assessing the information impact of Australian IFRS. Accounting and Finance 52(1), 187–212.
Brown, S., & Tucker, J. (2011). Large-sample evidence on firms’ year-over-year MD&A modifications. Journal of Accounting Research, 49(2), 303–346.
Chan, K., & Hameed, A. (2006). Stock Price Synchronicity and Analyst Coverage in Emerging Markets. Journal of Financial Economics, 80(1), 115-147.
Cheng, Q., & Farber, D. (2016). Earnings restatements, changes in CEO compensation, and firm performance. The Accounting Review, 83(5), 1217–1250
Cohen, D., Dey, A. & Lys, T. (2008). Real and accrual-based earnings management in the pre- and post-Sarbanes-Oxley periods. The Accounting Review, 83(3), 757–787.
Page | 15 Cook, R. D. (1977). Detection of Influential Observations in Linear Regression. .American Statistical Association),
Technometrics, 19 (1), 15-18.
Crawford, S. S., Roulstone, D. T. & So, E. C. (2012). Analyst initiations of coverage and stock return synchronicity. The Accounting Review, 87(5), 1527–1553.
Dechow, P., and Dichev, I. (2002). The quality of accruals and earnings: the role of accrual estimation errors. The Accounting Review ,77(1), 35–59.
Dechow, P., Ge, W., Larson, C., & Sloan, R. (2011). Predicting material accounting misstatements .Contemporary Accounting Research, 28(1), 17–82.
Dechow, P.,. Ge, W., & Schrand, C. (2010). Understanding earnings quality: A review of the proxies, their determinants and their consequences. Journal of Accounting and Economics, 50(2), 344–401.
DeFond, M. (2010). Earnings quality research: Advances, challenges and future research. Journal of Accounting and Economics, 50(2), 402-409.
De Franco, G., Kothari, S. P. & Verdi, R. (2011). The benefits of financial statement comparability. Journal of Accounting Research, 49(4), 895–931.
Demerjian, P., Lev, B., Lewis, M. & Mcvay, S. (2013). Managerial ability and earnings quality. The Accounting Review, 88(2), 463-498.
Devos, E., Hao, W., Prevost, A. & Wongchoti, U. (2015). Stock return synchronicity and the market response to analyst recommendation revisions. Journal of Banking & Finance, 58(1), 376-389.
Doyle, J., Ge, W. & McVay, S. (2007a). Accruals quality and internal control over financial reporting. The Accounting Review, 82(5), 1141–1170.
Durnev, A., Morck, R., Yeung B., Zarwin, P. (2003). Does Great Firm-Specific Return Variation Mean More or Less Informed Stock Pricing? Journal of Accounting Research, 41(1), 797-836.
Francis, J., LaFond, R., Olsson, P. and Schipper, K. (2004). Costs of equity and earnings attributes. The Accounting Review, 79(4), 967–1010.
Greene, H. (2000). Econometric Analysis (Fourth edition). Upper Saddle River, NJ. Prentice- Hall. Gujarati, D. (2008). Basic econometrics, (Fifth edition), Boston: McGraw-Hill.
Healy, P. M. & Wahlen, J. M. (1999). A review of the earnings management literature and its implications for standard setting. Accounting Horizons, 13(4), 365-383.
Horton, J., Serafeim, G. & Serafeim, I. (2013). Does mandatory IFRS adoption improve the information environment? Contemporary Accounting Research, 30(1), 388-423.
International Accounting Standards Board (IASB). (2015). Conceptual Framework for Financial Reporting. Available at: www.ifrs.org.
Jones, J. (1991). Earnings management during import relief investigations. Journal of Accounting Researc, 29(2), 193–228. Larcker, D., Richardson, S. & Tuna, S. (2007). Corporate governance, accounting outcomes, and organizational
performance. The Accounting Review, 82(4), 963–1008.
MacKinnon, D. P., Lockwood, C. M., Hoffman, J. M., West, S. G., & Sheets, V. (2002). A comparison of methods to test mediation and other intervening variable effects. Psychological Methods, 7 (1), 83-104.
Morck, R., Yeung, B., Yu, W. (2000). The Information Content of Stock Markets: Why Do Emerging Markets Have Synchronous Stock Price Movements? Journal of Financial Economics, 58(1), 215-238.
Peasnell, K. V., Pope, P. F. & Young, S. (2005). Board monitoring and earnings management: do outside directors influence abnormal accruals? Journal of Business Finance & Accounting, 32(7), 1311-1346.
Peterson, K., Schmardebeck, R. & Wilks,T. (2015). The Earnings Quality and Information Processing Effects of Accounting Consistency. The Accounting Review, 90(6), 2483- 2514.
Piotroski, J. D. & Roulstone, D. T. (2004). The influence of analysts, institutional investors, and insiders on the Incorporation of Market, Industry, and Firm-Specific Information into Stock Price. The Accounting Review,79(4), 1119-1151