12 Świętokrzyska St. 00-916 Warsaw tel.: +48 22 694 50 00 fax: +48 22 694 50 08 www.mf.gov.pl Ministry of Finance Warsaw, September 2015 r.
THE PUBLIC FINANCE SECTOR
DEBT MANAGEMENT STRATEGY
in the years 2016-2019
3
I. INTRODUCTION ... 6
II. CHANGES IN THE VOLUME AND STRUCTURE OF PUBLIC DEBT ... 8
II.1. Volume of public debt and the costs of its servicing ... 8
II.2. Impact of the public finance sector liquidity management consolidation on public finance . 11 II.3. Structure of the State Treasury debt ... 12
II.4. Volume and structure of other public finance sector debt ... 14
II.4.1. Debt of local government units (LGUs) ... 15
II.4.2. Debt of independent public health care units ... 17
II.4.3. Debt of the Social Insurance Fund and other entities ... 18
II.5. Guarantees granted by public finance sector entities ... 18
III. EVALUATION OF IMPLEMENTATION OF THE STRATEGY OBJECTIVE... 20
IV. ASSUMPTIONS OF THE STRATEGY ... 24
IV.1. Macroeconomic assumptions of the Strategy ... 24
IV.2. The domestic Treasury securities market ... 24
IV.2.1. Domestic investor base ... 25
IV.2.2. Role of foreign investors ... 26
IV.3. International situation ... 29
V. OBJECTIVE OF THE STRATEGY... 31
VI. TASKS OF THE STRATEGY ... 34
VI.1. Ensuring liquidity of the TS market ... 34
VI.2. Ensuring efficiency of the TS market ... 34
VI.3. Ensuring the transparency of the TS market ... 35
VII. IMPACT ON THE PUBLIC FINANCE SECTOR DEBT ... 36
VII.1. Assumptions of the strategy of granting sureties and guarantees ... 36
VII.2. Debt of public finance entities other than the State Treasury ... 37
VII.2.1. Debt of local government units ... 37
VII.2.2. Debt of other entities ... 38
VIII. EXPECTED EFFECTS OF IMPLEMENTING THE STRATEGY ... 39
VIII.1. Debt volume and its servicing costs ... 39
VIII.2. Structure of the State Treasury debt ... 41
VIII.3. Threats to the Strategy implementation ... 43
Annex 1. Abbreviations and glossary ... 44
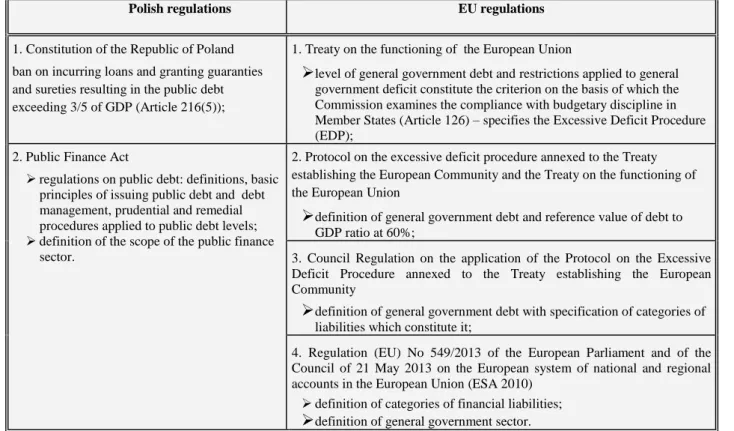
Annex 2. Legal regulations applied to public debt in Poland and the EU... 49
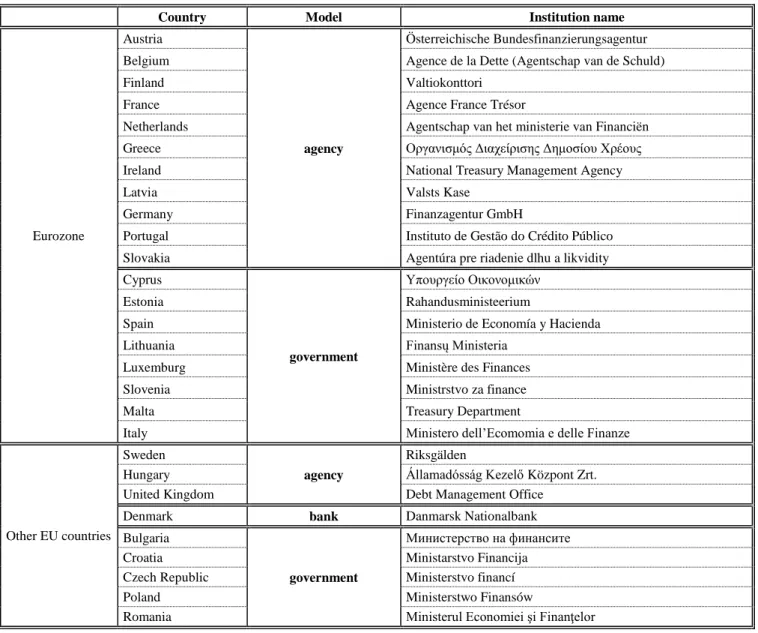
Annex 3. Institutional framework for public debt management in the EU member states ... 53
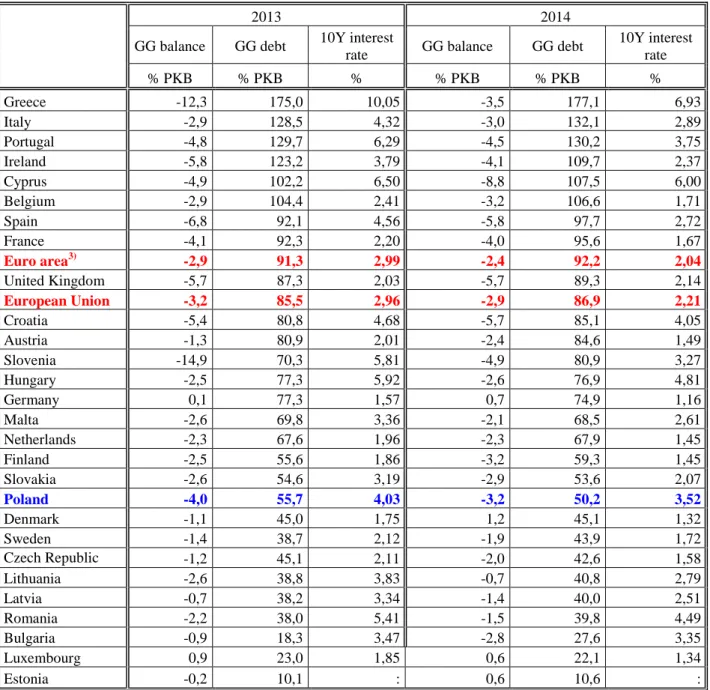
Annex 4. General government deficit and debt, yields on 10-year bonds in the EU member states and TS issuance structure in selected countries ... 56
4
Annex 5. Government debt rating of EU Member States and selected market data ... 58 Annex 6. Public debt In Poland – statistical annex ... 60
6 I. INTRODUCTION
Pursuant to Article 75 of the Public Finance Act of 27 August 2009, the Minister of Finance is obliged to develop annually a 4-year strategy on managing the State Treasury (ST) debt and influencing the public finance sector debt. This document is presented by the Minister of Finance to the Council of Ministers for approval, and then it is submitted by the Council of Ministers to the Sejm, together with the justification to the draft Budget Act.
Public debt management is conducted at two levels:
in a broader sense, debt management is a part of the fiscal policy and covers decisions on what
portion of State expenditures is to be financed through debt, accordingly, what the level of public debt should be (this aspect is discussed in documents updated on an annual basis, devoted to the government economic programme, especially in the justification to the draft Budget Act and the Convergence Programme Update);
in a narrower sense, debt management means determining the way of financing the State budget
borrowing requirements and designing the debt structure by selecting markets, instruments and dates of issuance.
The macroeconomic and fiscal assumptions adopted in the Strategy are compliant with the assumptions of the draft Budget Act for 2016.
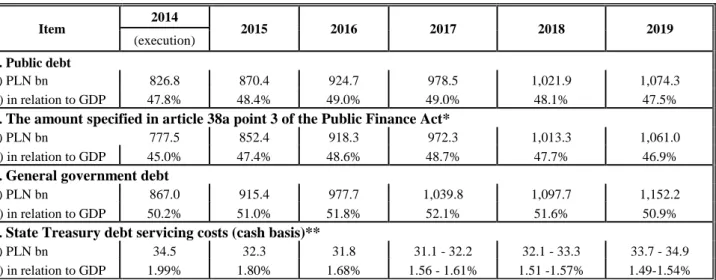
Table 1. Public debt and debt servicing costs – the Strategy’s key forecasts
Item 2014 2015 2016 2017 2018 2019
(execution) 1. Public debt
a) PLN bn 826.8 870.4 924.7 978.5 1,021.9 1,074.3
b) in relation to GDP 47.8% 48.4% 49.0% 49.0% 48.1% 47.5%
2. The amount specified in article 38a point 3 of the Public Finance Act*
a) PLN bn 777.5 852.4 918.3 972.3 1,013.3 1,061.0
b) in relation to GDP 45.0% 47.4% 48.6% 48.7% 47.7% 46.9%
3. General government debt
a) PLN bn 867.0 915.4 977.7 1,039.8 1,097.7 1,152.2
b) in relation to GDP 50.2% 51.0% 51.8% 52.1% 51.6% 50.9%
4. State Treasury debt servicing costs (cash basis)**
a) PLN bn 34.5 32.3 31.8 31.1 - 32.2 32.1 - 33.3 33.7 - 34.9
b) in relation to GDP 1.99% 1.80% 1.68% 1.56 - 1.61% 1.51 -1.57% 1.49-1.54%
*) The amount of public debt recalculated using the yearly average of foreign currency exchange rates for the year concerned and reduced by the value of State budget liquid funds raised to finance the borrowing requirements for the following budget year.
**)Forecasts of the debt servicing costs for the years 2017-2019 account for the exchange rate risk provisions
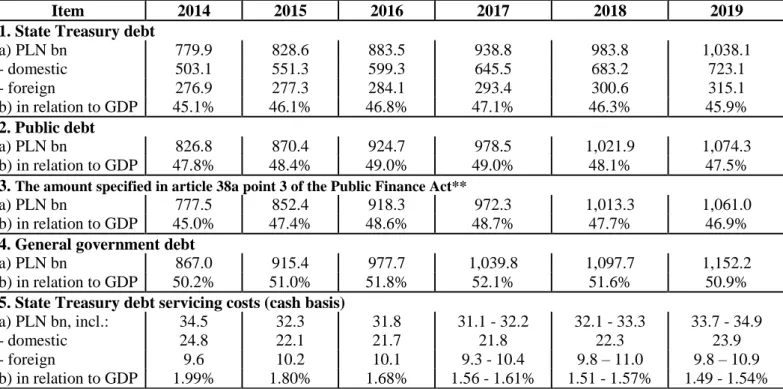
Under the adopted assumptions, in the years 2015-2016 the public debt-to-GDP ratio is expected to increase to 49.0%; following its stabilisation in 2017 it will gradually fall to 47.5% in 2019.The ratio of the amount specified in Article 38a of the Public Finance Act shall reach the level of approximately 48.6% in 2016 and 48.7% in 2017, to decrease gradually to 46.9% in 2019.
The general government debt-to-GDP ratio will grow until 2017, when it will reach 52.1%. The increase in general government debt will result mainly from the growth of National Road Fund (KFD) debt due to the execution of infrastructure projects.
In years 2015-2016 State Treasury debt servicing costs will continue on downward trend, both in nominal terms (from PLN 34.5bn in 2014 to PLN 31.8bn in 2016) and in relation to GDP (from 2.0% to 1.7%). It was assumed that the debt servicing costs-to-GDP ratio will continue to fall in subsequent years, reaching 1.49% - 1.54% in 2019.
7
This Strategy is a continuation of the strategy developed last year. The objective of minimisation of the long-term debt servicing costs subject to the adopted risk constraints remained unchanged. The tasks aimed at implementation of the Strategy objective, associated with the development of the financial market have been maintained, i.e. ensuring liquidity, efficiency and transparency of the Treasury Securities (TS) market. The previous year’s Strategy
task, related to the consolidation of the public finance sector liquidity management has been implemented and, as a consequence, it is not included in this document.
The following has been assumed for the accomplishment of the Strategy's objective for 2016- 2019:
the flexible approach towards shaping the financing structure in terms of selecting the market, currency and instruments shall be maintained, to the extent that cost minimisation is achieved, subject to the assumed risk level limitations and avoiding distortions of monetary policy;
the domestic market shall remain the main source of financing the State budget borrowing requirements;
the share of foreign currency debt will be reduced at a rate depending on market and budgetary conditions, ultimately to the level below 30%,
building of large and liquid fixed rate issue programmes, both in the domestic, as well as the euro market, shall be a priority of the issuance policy,
the average maturity of domestic debt shall be maintained at a level no less than 4 years, until the State budget borrowing requirements are lowered, aiming at increasing it to 4.5 years ultimately
the average maturity of the State Treasury (ST) debt shall be maintained at a level close to five years, with a possibility to shorten it, until the State budget borrowing requirements are lowered.
8
II. CHANGES IN THE VOLUME AND STRUCTURE OF PUBLIC DEBT
Subsequent subchapters present recent changes in the volume of public debt, the structure and servicing costs of the ST debt, as well as the volume of contingent liabilities resulting from guarantees and sureties. A separate subchapter discusses the impact of the public finance sector liquidity management consolidation on the volume of debt.
II.1. Volume of public debt and the costs of its servicing
The changes in the volume of public debt in years 2004-2014 resulted mainly from changes in the ST debt. Changes in nominal debt was primarily an outcome of financing of net borrowing requirements and fluctuation of PLN exchange rates. In 2014 a significant decrease of debt was recorded (according to both the national and the EU definition), mainly as a result of cancellation of the TS transferred by open pension funds (OFE) to Social Security Institution (ZUS) under the pension system reform. At the end of 2014, public debt (national definition) amounted to GDP 47.8%, and the general government debt (EU definition) reached the level of GDP 50.2%. The general government debt-to-GDP ratio was significantly lower than in the whole EU (86.9%) and euro area (92.2%)1.
The change in the ratio to GDP of both public debt and general government debt in individual years, with reference to the previous strategy, arose from the GDP revision due to the entry into force of ESA2010 provisions.
Chart 1. Public debt level in years 2004-20152
Chart 2. The influence of FX rate movements on ST debt in years 2004-2015
Similar to previous years, the difference between public debt and general government debt resulted primarily from the debt of the National Road Fund (KFD), which is included in general
1
The differences between the Polish and the EU definition are presented in Annex 2, whereas the comparison of the deficit and debt of the EU Member States is included in Annex 4.
2 Detailed information regarding the level of public debt is presented in Annex 6.
200 300 400 500 600 700 800 900 2004 2005 2006 2007 2008 2009 2010 2011 2012 2013 2014 VI 2015 PLN bn
State Treasury debt Public debt General government debt
43.4% 44.7% 44.9% 42.3% 44.6% 46.4% 48.8% 49.6% 49.1% 50.4% 45.1% 46.5% 47.4% 47.5% 44.4% 46.8% 49.2% 52.0% 52.5% 52.0% 53.1% 47.8% 45.3% 46.7% 47.1% 44.2% 46.6% 49.8% 53.6% 54.8% 54.4% 55.7% 50.2% 35% 40% 45% 50% 55% 60% 2004 2005 2006 2007 2008 2009 2010 2011 2012 2013 2014 GDP %
State Treasury debt Public debt General government debt
-20.0 -3.4 -4.2 -11.0 25.3 -4.1 0.4 28.6 -21.3 -1.9 2.0 3.6 44.0 40.7 42.6 33.9 43.1 65.7 69.9 40.7 44.0 46.1 -60.1 34.2 -90 -70 -50 -30 -10 10 30 50 70 2004 2005 2006 2007 2008 2009 2010 2011 2012 2013 2014 VI 2015
Change in ST debt without FX rate movements FX rate movments PLN bn 23.9 37.3 38.4 23.0 68.4 61.6 69.3 22.7 44.2 -58.1 37.9 -90 -70 -50 -30 -10 10 30 50 70 2004 2005 2006 2007 2008 2009 2010 2011 2012 2013 2014 VI 2015 Change of ST debt PLN bn
9
government sector according to the EU definition. In 2014, the following factors affected the differences between the public debt and the general government debt:
consolidation of a part of KFD bond liabilities, following their transfer to the Demographic Reserve Fund, as a result of the pension system reform (decrease in debt),
classifying new entities, in particular, PKP Polskie Linie Kolejowe S.A. company, to the general government sector (increase in debt),
adjustment (since1995) of the debt level according to the EU definition as a result of the change in the scope of the general government sector, following the application of ESA2010 provisions. In particular, the Bank Guarantee Fund (BFG) has been classified to the sector, resulting in debt reduction as a result of consolidation of TS held by BFG.
Chart 3. Differences in the level of debt according to national methodology and EU methodology
*) Consolidated within the general government sector
**) In compliance with Eurostat guidelines on sector classification of some infrastructure projects, general government debt figures include capital expenditures of the projects in question
***) Matured payables, debt assumption – activation of guarantees, currency-interest rate swaps, up-front payments on off-market swaps, restructured/refinanced trade credits
Chart 4. Factors influencing changes in debt-to-GDP ratio
*) Other factors include: other borrowing requirements (including: the balance of granted loans, and prefinancing), changes not resulting from borrowing requirements (changes of debt resulting from: changes of budget account balance, TS discount, TS capitalization and indexation, off-budget drawings, conversion of
0.3 0.4 0.5 1.2 1.7 2.3 2.5 2.6 1.8 0.1 0.2 0.3 0.6 0.7 0.7 0.7 0.7 -0.2 -0.3 -0.4 -0.4 -0.4 -0.4 -0.5 -0.5 -0.5 -0.6 -0.6 -0.6 0.1 0.1 0.6 -1.0 -0.5 -0.4 -0.4 -0.4 -0.3 -0.2 -0.2 -0.2 -0.1 -0.1 -2 -1 0 1 2 3 4 2004 2005 2006 2007 2008 2009 2010 2011 2012 2013 2014 GDP %
Differences concerning debt instruments*** Debt of other general government sector units
T-Securities held by BFG T-Securities held by funds managed by Bank Gospodarstwa Krajowego
Aquisition of infrastructure assets** Debt of KFD*
Difference between general government and public debt
` 2.0 0.3 -0.3 -1.0 -0.6 0.7 -0.7 2.0 2.0 2.0 1.7 1.4 1.6 1.6 1.5 1.7 1.6 1.4 0.5 0.5 0.6 0.6 0.6 0.7 0.8 0.8 0.9 1.0 0.6 0.7 0.8 -0.4 1.1 1.3 1.4 1.4 1.6 1.5 1.6 1.0 0.5 0.6 0.5 -0.8 -0.3 -0.4 -1.6 -2.2 -0.3 -0.4 -0.9 2.0 -0.3 0.0 1.8 -1.3 0.8 -4.0 -2.5 -3.4 -4.6 -3.0 -2.8 -2.4 -3.7 -1.9 -1.4 -1.9 -0.1 0.3 0.3 0.3 0.0 1.5 1.2 0.6 1.2 -7.5 -10 -8 -6 -4 -2 0 2 4 6 8 2004 2005 2006 2007 2008 2009 2010 2011 2012 2013 2014 GDP %
TS cancellation under pension system reform Other factors*
Nominal GDP growth FX rate movements
Public finance sector liquidity management Net proceeds from privatisation
Funds transferred to FUS as a compensation for the contribution transferred to OFE EU funds budget balance
10
FUS debt to OFE securities) and changes in other ST debt (among others: matured payables and funds deposited with Minister of Finance under the public finance sector liquidity management).
Changes in the level of ST debt servicing costs resulted from the changes in debt volume as well as interest rates and exchange rates. At the same time, measures aimed at their smoothing over time were undertaken. These included:
derivatives - in use since the end of 2006,
setting coupons of newly issued bonds at levels close to their yields to reduce the accumulation of discount costs at maturity,
switching auctions, in use since 2001, and buy-back auctions aimed primarily at reducing refinancing risk, but allowing also for the redistribution of debt servicing costs over time. Chart 5. State Treasury debt servicing costs in years 2004-2014
Foreign debt servicing costs were much lower than those of domestic debt, due to the lower share of foreign debt in ST debt, and the difference in interest rates on domestic and major foreign markets. The significant growth in debt servicing costs in 2009-2012 resulted from an increased importance of foreign financing and depreciation of the Polish zloty as well as from higher discount expenses from redeemed securities, which was the effect of the structure of debt issued in previous years. Following the stabilisation in 2013, a significant decline in debt servicing costs occurred. Nominal debt servicing costs in 2014 were decreased by PLN 8.0bn, including PLN 4.6bn resulting from cancellation of TS transferred by OFE to ZUS under the pension system reform. The reduction of debt servicing costs was also affected by the significant decrease of yields and the issuance policy consisting of increased share of floating rate instruments, which enabled faster adjustment of debt servicing costs to the declining interest rates. Debt servicing costs were decreased by GDP 0.6% (from 2.6% to 2.0%), and the average interest rate on debt decreased to 4.3%. It is still a significantly higher level than the current cost of market financing, which results from servicing of debt incurred in the past at higher yields. Chart 6. Market interest rates and average servicing costs of foreign and domestic debt
* Average ST debt servicing costs were calculated as a ratio of the difference between debt servicing costs and revnues in a particular year to the average debt volume in this year
** In domestic currency 18.5 21.3 23.3 22.6 20.0 25.6 26.8 27.1 31.8 32.3 24.8 4.2 3.7 4.5 5.0 5.1 6.7 7.4 8.8 10.3 10.1 9.6 22.7 25.0 27.8 27.6 25.1 32.2 34.1 36.0 42.1 42.5 34.5 10 15 20 25 30 35 40 45 2004 2005 2006 2007 2008 2009 2010 2011 2012 2013 2014 PLN bn
Domestic debt Foreign debt
2.0% 2.2% 2.2% 1.9% 1.6% 1.9% 1.9% 1.7% 2.0% 1.9% 1.4% 0.5% 0.4% 0.4% 0.4% 0.4% 0.5% 0.5% 0.6% 0.6% 0.6% 0.6% 2.4% 2.5% 2.6% 2.3% 2.0% 2.4% 2.4% 2.3% 2.6% 2.6% 2.0% 0.0% 0.5% 1.0% 1.5% 2.0% 2.5% 3.0% 2004 2005 2006 2007 2008 2009 2010 2011 2012 2013 2014 GDP %
Domestic debt Foreign debt Total debt
6.4% 5.9% 6.1% 5.8% 4.7% 5.4% 5.2% 5.0% 5.5% 5.2% 4.6% 3.4% 3.0% 3.2% 3.9% 3.7% 4.1% 4.1% 3.9% 4.1% 4.0% 3.8% 5.5% 5.1% 5.3% 5.3% 4.4% 5.0% 4.9% 4.7% 5.0% 4.8% 4.3% -2% 0% 2% 4% 6% 8% 2004 2005 2006 2007 2008 2009 2010 2011 2012 2013 2014
Average ST debt servicing costs*
Domestic debt Foreign debt Total debt
-2% 0% 2% 4% 6% 8% 2003 2004 2005 2006 2007 2008 2009 2010 2011 2012 2013 2014 2015
5Y Treasury bond yields**
11
II.2. Impact of the public finance sector liquidity management consolidation on public finance
In May 2011 came into force the amendment to the Public Finance Act, which introduced the public finance sector liquidity management consolidation. It included the introduction of:
the obligation to deposit liquid funds on the account of the Minister of Finance by:
− state special-purpose funds (excluding funds under the management of ZUS and KRUS), − executive agencies,
− National Health Fund,
− other state legal entities founded under separate acts, including the National Fund of Environmental Protection and Water Management and State Fund for Rehabilitation of Disabled Persons;
a possibility to deposit liquid funds by local government units and other public finance sector entities, in the form of a deposit with the Minister of Finance.
The liquidity management consolidation is aimed at implementation of the first aspect of the
Strategy’s objective, i.e. minimisation of the debt servicing costs through the appropriate selection of debt management instruments. The objective of the consolidation is more efficient management of liquid funds collected in the public sector, and thus reduction of the state budget borrowing requirements and decrease of public debt and debt servicing costs. The consolidation leads to increasing the effectiveness of sector's assets management, while maintaining the autonomy of entities in disposal of funds needed for implementation of their tasks. In accordance with the assumptions of The Public Finance Sector Debt Management Strategy in the years
2014-2017 and The Public Finance Sector Debt Management Strategy in the years 2015-2018,
the liquidity management consolidation was continued. The implementation of this task comprised the following measures:
in September 2013, introduction of a uniform mechanism for the management of foreign currency funds at the disposal of the Minister of Finance, that encompassed both funds from debt management and the European Union funds. The aim of the consolidation of foreign currency funds at the disposal of the Minister of Finance was to increase:
− the effectiveness of depositing foreign currency funds (through their depositing under more favourable conditions and gaining higher interest),
− the flexibility of foreign currency funds management process (including the sales of foreign currency), through separation of foreign currency operations and supply of the EU funds budget with funds in PLN,
− the liquidity cushion of the State budget, which may also temporarily reduce public debt.
as of February 2014, the use of funds deposited in the State Treasury surety and guarantee reserves account in the process of financing State budget borrowing requirements;
the amendment to the Public Finance Act which entered into force as of January 1, 2015, comprises broadening the group of public finance units covered by the funds consolidation obligation to include:
− institutions of budgetary management, − state institutions of culture,
− PAN (Polish Academy of Sciences) and the organisational units founded by it, − governmental independent public health care units (SPZOZ),
− Regional Funds of Environmental Protection and Water Management,
as well as placing court deposits on the account of the Minister of Finance in the state owned bank – BGK (instead of bank accounts of courts) and entitling the Minister of Finance to temporary use these funds.
The units covered by liquidity management consolidation deposited the majority of liquid funds (over PLN 29bn as of the end of June 2015) as term deposits, specifying the amount and
12
the term of the deposit. At the end of a given day, any unused funds were deposited overnight (O/N), without the requirement to submit a separate instruction, and returned to the account of the unit on the following morning. In accordance with the adopted mechanism, court deposits were deposited only overnight (O/N).
Chart 7. Funds deposited on the account of the Minister of Finance under the public finance sector liquidity management consolidation in years 2011-2015 by the type of deposit
Until the end of June 2015, within the process of depositing funds by new units and placing court deposits, the amount of PLN 7.8bn has been acquired, translating into the reduction of state budget borrowing requirements. Due to the fact that some new deposits (i.e. the majority of court deposits) come from entities outside the public finance sector, the estimated reduction of public debt level amounts to ca. PLN 3.9bn.
As of the end of June 2015 the cumulative effect of all the aforementioned measures comprising the liquidity management consolidation is the reduction of borrowing requirements by ca. PLN 39bn and public debt by ca. PLN 32bn.
Chart 8. Funds deposited on the account of the Minister of Finance under the public finance sector liquidity management consolidation in years 2011-2015 by the type of institution
II.3. Structure of the State Treasury debt
Changes in the ST debt structure resulted from implementation of the Strategy objective, i.e. long-term costs minimisation subject to risk constraints. The flexible issuance policy and operations on debt kept the risk related to the ST debt structure on a safe level.
Refinancing risk
The domestic debt refinancing risk had been gradually reduced since 2004, and from 2007 to 2013 it was subject to relative stabilisation. Since 2014 the refinancing risk parameters have slightly deteriorated, which resulted mainly from the pension system reform and the cancellation
21.8 24.7 21.8 24.1 29.1 2.7 3.7 6.3 4.1 5.6 4.0 24.5 28.4 28.1 28.2 38.7 0 10 20 30 40 2011 2012 2013 2014 VI 2015 PLN bn
Term deposits Overnight Court deposits
14.1 18.9 18.2 17.0 17.4 6.8 5.6 5.3 5.5 6.9 2.7 2.8 3.7 4.8 5.1 0.9 1.0 1.0 0.9 1.5 3.7 4.0 24.5 28.4 28.1 28.2 38.7 0 10 20 30 40 2011 2012 2013 2014 VI 2015 PLN bn
Court deposits Units included since 2015 Executive agencies National Health Fund
13
of TS, comprising predominantly long-term instruments. The level of refinancing risk was a resultant of:
the growing importance of medium and long-term bonds in financing the borrowing requirements, and at the same time, the decreasing role of T-bills, up to the complete discontinuation of their issuance as of 2013 (risk reduction);
large scale of switching auctions (risk reduction);
aging of the existing debt (risk increase);
prefinancing of the following year State borrowing requirements in the 4th quarter of the preceding year (risk reduction);
maintaining the liquidity reserve of the State budget (risk reduction - a qualitative factor not affecting the average debt maturity).
Chart 9. Residual maturity of ST debt in years 2004-2015
Chart 10. ATM of ST debt in years 2004-2015
Since 2005 the average maturity of the ST debt has remained at a level above five years, adopted in the strategy as of 2012. In 2014 the decline in the average maturity of the ST debt was recorded, resulted mainly from the reduction in the average maturity of the domestic debt (to 4.19 years) due to the significant share of long-term instruments in TS cancelled under the pension system reform. As at the end of June 2015 the average maturity of the ST debt amounted to 5.09 years and in case of the domestic debt - to 4.16 years.
The sharp reduction in refinancing risk of the foreign debt in 2005 resulted from the early repayment of a part of the Paris Club debt which was refinanced by issuing bonds with a significantly longer maturity. The refinancing risk of the foreign debt, as compared to the domestic debt, is significantly lower, although its average maturity was gradually decreasing as of 2010, to reach the level of 6.79 years at the end of June 2015.
Foreign exchange risk
The increase of the role of foreign currency debt since 2008 has been the result of volatility of the Polish zloty exchange rate and increase in borrowing requirements, which justified the flexible approach to implementing the objective of minimising the debt servicing costs subject to
14
foreign exchange risk constraints. Temporary increase in foreign financing was allowed, if justified by striving towards the domestic market stabilisation, diversification of sources of capital and taking advantage of the possibility of issuing bonds with a yield lower than that prevailing in the domestic market and incurring low interest loans in international financial institutions (IFI). The share of debt denominated in foreign currency in the ST debt in the years 2011-2013 slightly exceeded 30%. At the end of 2014 this share increased to 35.5%, which resulted mainly from the pension system reform. In the 1st half of 2015 the share of debt denominated in foreign currency decreased to 34.1%.
Chart 11. Currency structure of ST debt in years 2004-2015
Interest rate risk
Interest rate risk of the domestic and foreign debt was subject to similar trends as the refinancing risk. In the recent years increase in the share of floating interest rate debt, both domestic (from 12.0% at the end of 2009 to 22.4% in June 2015), and foreign (from 9.6% to 18.3%, respectively) was recorded, which contributed to the reduction in ST debt servicing costs in the period of significant decline in interest rates in financial markets.
Chart 12. ATR and duration of ST debt in years 2004-2015
II.4. Volume and structure of other public finance sector debt
At the end of 2014, the unconsolidated debt of units other than ST amounted to 13.2% of public debt (the ratio for consolidated debt was 8.9%), compared to 11.3% for unconsolidated debt (8.0% for consolidated debt) at the end of 2013. After the first half of 2015 these values reached the level of 12.8% and 8.5%, respectively.
15
Chart 13. Share of debt of public finance sector units other than ST in public finance sector debt and as a GDP ratio.
The local government sector debt, in particular that of local government units (LGU), had the highest share in this part of the debt. The share of social security sector unconsolidated debt in the overall debt had been steadily decreasing until 2008, to increase to 4.7% since 2009. The difference between the social security sector unconsolidated and consolidated debt that has been growing since 2009 is a consequence of the fact that shortages of funds in the Social Security Fund (FUS) were financed with loans from the State budget.
Chart 14. Debt of public finance sector units other than ST by sectors.
Chart 15. Unconsolidated debt of public finance sector units other than State Treasury
The following part of the subchapter focuses on the analysis of unconsolidated debt of public finance sector (PFS) entities other than ST.
II.4.1. Debt of local government units (LGUs)
The highest dynamics in LGU debt was recorded in 2009 – growth of unconsolidated debt by 40.3% and consolidated debt by 45.7%. In the subsequent years, the growth rate was gradually
8.6% 7.7% 7.7% 6.7% 6.5% 9.0% 9.9% 10.5% 10.8% 11.3% 13.2% 12.8% 3.8% 3.5% 3.4% 2.8% 2.9% 4.4% 5.0% 5.6% 5.9% 6.6% 6.9% 0% 2% 4% 6% 8% 10% 12% 14% 2004 2005 2006 2007 2008 2009 2010 2011 2012 2013 2014 VI 2015 Unconsolidated
Percentage of total debt In relation to GDP
7.0% 6.0% 5.9% 5.4% 5.4% 7.1% 7.6% 8.3% 8.5% 8.0% 8.9% 8.5% 3.2% 2.9% 2.8% 2.4% 2.5% 3.5% 3.9% 4.4% 4.4% 4.2% 4.2% 0% 2% 4% 6% 8% 10% 12% 14% 2004 2005 2006 2007 2008 2009 2010 2011 2012 2013 2014 VI 2015 Consolidated
Percentage of total debt In relation to GDP
2.4 2.1 3.6 2.1 2.8 4.4 4.1 1.5 1.8 1.9 1.8 1.9 24.5 27.3 30.9 31.1 33.9 45.3 59.9 70.4 72.8 74.1 77.1 76.3 10.8 7.5 5.1 2.7 2.8 12.5 12.9 18.2 21.1 31.3 39.9 41.8 37.7 36.9 39.7 35.9 39.4 62.1 76.8 90.1 95.8 107.2 118.9 120.0 0 10 20 30 40 50 60 70 80 90 0 20 40 60 80 100 120 2004 2005 2006 2007 2008 2009 2010 2011 2012 2013 2014 VI 2015 PLN billion Unconsolidated
Central government Local government Social security funds
1.6 0.9 1.4 1.3 1.4 1.2 1.2 1.3 1.7 1.7 1.7 1.7 18.4 20.2 23.3 24.5 28.1 39.3 53.5 64.3 67.4 68.4 71.6 71.1 10.1 7.1 5.1 2.7 2.8 7.0 2.0 2.3 2.3 0.4 0.1 0.1 30.1 28.2 29.7 28.5 32.3 47.5 56.7 67.8 71.3 70.5 73.4 72.9 0 10 20 30 40 50 60 70 0 20 40 60 80 100 120 2004 2005 2006 2007 2008 2009 2010 2011 2012 2013 2014 VI 2015 PLN billion Consolidated
Central government Local government Social security funds
6.2 6.7 6.8 5.9 5.8 5.3 5.2 5.2 5.7 5.2 5.3 5.7 19.1 21.3 25.1 26.0 29.0 40.7 55.5 66.1 68.2 69.5 72.4 71.3 10.1 7.1 5.1 2.7 2.8 12.5 12.9 18.2 21.1 31.3 39.9 41.8 1.6 4.6 4.8 1.8 3.6 3.3 0.6 0.8 1.2 1.2 1.2 36.9 39.7 35.9 39.4 39.4 62.1 76.8 90.1 95.8 107.2 118.9 120.0 0 10 20 30 40 50 60 70 80 90 0 20 40 60 80 100 120 2004 2005 2006 2007 2008 2009 2010 2011 2012 2013 2014 VI 2015 PLN billion
16
reduced, and since 2012 it has not exceeded 5%. In 2014 the dynamics of debt of LGUs and their associations reached 4.3% for unconsolidated and 4.7% for consolidated debt.
The debt of LGUs and their associations has been gradually increasing, reaching PLN 72.4bn at the end of 2014, corresponding to the growth of PLN 2.9bn as compared to the end of 2013, with the deficit at a level of PLN 2.3bn. In the first half of 2015 a decline in the debt of LGUs of PLN 1.2 bn was recorded (with a budget surplus of PLN 10.4bn). A similar situation occurred in 2014. In the first half of 2014, the debt decreased by PLN 1.9bn (with a budgetary surplus in the amount of PLN 9.6bn), but in the second half of the year growth of PLN 4.8bn was recorded. LGUs incurred liabilities primarily in the last quarter of the year, which is associated with highly seasonal nature of their results, although in 2009-2011, a significant increase in debt was also recorded in the second and third quarter of the year.
Chart 16. Debt of local government units and their associations: quarterly changes and yearly dynamics
As of 1 January 2014 an individual LGU debt repayment indicator has been applicable, as defined in Article 243 of the Public Finance Act of 27 August 2009.
According to the data contained in resolutions of local government units concerning multiannual financial forecasts, in 2014, 64 units did not accomplish the individual debt repayment indicator defined in Article 243 of the Public Finance Act, including: 47 municipalities, 16 counties and one city with county rights.
Chart 17. The debt structure of LGUs and their associations according to the levels of local government.
The majority of total liabilities incurred by all local government units are the liabilities of cities with county rights (45.0% in 2014 and 45.7% in the first half of 2015). The share of liabilities of municipalities in 2004-2014 remained at a level of ca. 36-40% (at the end of 2014 the shares reached 36.7%, and at the end of the 1st half of 2015 - 36.3%). Over the recent years, the share of liabilities of voivodeships and counties stabilised at a level of ca. 8-10% (at the end of the 1st half of 2015, it amounted to 9.8% and 8.1%, respectively).
The structure of local government liabilities was dominated by domestic debt, although the share of foreign debt has been increasing steadily, reaching 21% at the end of June 2015. Loans
-0.7 -0.1 0.9 1.8 -0.8 -0.4 0.3 3.1 -0.7 0.1 1.1 3.3 -1.0 -0.5 0.1 2.4 -1.1 -1.1 0.4 4.9 -0.4 1.4 3.0 7.6 -0.9 1.8 4.1 9.8 0.4 0.5 3.3 6.5 -1.0 -0.4 0.4 3.1 -1.1 -0.2 0.3 2.2 -0.6 -1.3 0.7 4.1 -0.9 -0.3 -2.0 -1.0 0.0 1.0 2.0 3.0 4.0 5.0 6.0 7.0 8.0 9.0 10.0 2004 2005 2006 2007 2008 2009 2010 2011 2012 2013 2014 2015
PLN billion Quarterly change in
10.6% 11.3% 17.8% 3.7% 11.7% 40.3% 36.2% 19.2% 3.2% 1.9% 4.3% 11.3% 11.7% 16.5% 6.1% 17.7% 45.7% 39.0% 21.0% 4.6% 1.9% 4.7% 0% 10% 20% 30% 40% 50% 2004 2005 2006 2007 2008 2009 2010 2011 2012 2013 2014
Unconsolidated debt dynamics Consolidated debt dynamics
40% 38% 38% 38% 38% 36% 40% 40% 39% 37% 37% 36% 50% 49% 45% 44% 44% 46% 43% 43% 44% 45% 45% 46% 8% 9% 10% 10% 10% 10% 10% 9% 9% 8% 8% 8% 3% 4% 6% 8% 8.0% 8% 8% 8% 9% 10% 10% 10% 0% 10% 20% 30% 40% 50% 60% 70% 80% 90% 100% 2004 2005 2006 2007 2008 2009 2010 2011 2012 2013 2014 VI 2015
17
prevailed in the structure of liabilities of LGUs and their associations (94% at the end of June 2015).
Chart 18. Structure of debt of LGUs and their associations.
II.4.2. Debt of independent public health care units
At the end of 2014, the debt of independent public health care units (SPZOZ) amounted to PLN 5.3bn, and to PLN 5.7bn at the end of June 2015, compared to PLN 5.2bn in 2013. Since 2007, loans have been the dominant component of the debt. Matured payables which have arisen as a result of untimely settlement of liabilities continue to be a significant component of debt. Changes in the debt structure in 2005-2008 resulted from the reduction of the growth rate of matured payables while pursuing remedial procedures at the same time.
Chart 19. Debt volume and structure of independent public health care units.
In 2006-2014, the debt of SPZOZ’s owed to the public finance sector decreased to ca. PLN 0.8bn at the end of 2014. In the 1st half of 2015, the growth of SPZOZ liabilities towards other PFS entities by PLN 0.03bn was recorded. The level of debt of all SPZOZ was influenced by the commercialisation of SPZOZ conducted pursuant to the Act on therapeutic activity. In accordance with the provisions of the Act, the entity founding the SPZOZ is obliged to cover its deficit during three months after the deadline set for approval of the financial statement. Otherwise, the founding entity shall be bound to change the organisational and legal form of the SPZOZ or to perform its liquidation. In addition, entities which decided to perform the restructuring of hospitals into companies until 31 December 2013 had the opportunity to take advantage of cancellation of the public-law liabilities taken over from the restructured SPZOZ.
92% 89% 90% 89% 85% 82% 83% 82% 81% 80% 79% 79% 8% 11% 10% 11% 15% 18% 17% 18% 19% 20% 21% 21% 0% 20% 40% 60% 80% 100% 2004 2005 2006 2007 2008 2009 2010 2011 2012 2013 2014 VI 2015 By place of issue
Domestic debt Foreign debt
82% 83% 84% 84% 90% 87% 92% 92% 92% 92% 94% 94% 16% 15% 15% 16% 10% 13% 8% 8% 7% 7% 6% 6% 2% 1% 1% 1% 1% 0% 1% 0% 0% 1% 0% 0% 0% 20% 40% 60% 80% 100% 2004 2005 2006 2007 2008 2009 2010 2011 2012 2013 2014 VI 2015 By instrument
Loans Securities other than shares Other liabilities
5.2 5.8 5.6 4.9 4.7 4.4 4.2 4.1 4.4 3.9 4.0 4.3 0.9 1.0 1.2 1.0 1.1 0.9 1.0 1.1 1.3 1.3 1.3 1.4 6.2 6.7 6.8 5.9 5.8 5.3 5.2 5.2 5.7 5.2 5.3 5.7 0 1 2 3 4 5 6 7 8 0 1 2 3 4 5 6 7 8 2004 2005 2006 2007 2008 2009 2010 2011 2012 2013 2014 VI 2015 PLN billion
Local public health care units Central public health care units
92% 72% 53% 44% 41% 44% 44% 44% 42% 37% 34% 36% 8% 28% 46% 55% 59% 56% 56% 56% 58% 63% 66% 64% 0% 10% 20% 30% 40% 50% 60% 70% 80% 90% 100% 2004 2005 2006 2007 2008 2009 2010 2011 2012 2013 2014 VI 2015
18
Chart 20. Debt of independent public health care units owed to public finance sector and other units.
II.4.3. Debt of the Social Insurance Fund and other entities
Among other entities, the debt of the Social Security Institution (ZUS) and funds managed by ZUS, consisting almost entirely of liabilities incurred by the FUS, constituted the biggest share in 2002-2014. In 2009 and subsequent years, there was a significant increase of the FUS debt, up to the level of PLN 39.9bn at the end of 2014 and PLN 41.8bn at the end of June 2015. It resulted from the structural imbalance of the fund financed, besides the budgetary subsidy, also by the loan from the State budget. In mid-2015, it accounted for 99.7% of the total debt of the fund, with the lack of debt in commercial banks.
The debt of other entities constituted an insignificant share of public debt (0.1% of the unconsolidated PFS debt, both at the end of 2014 and in mid-2015).
Chart 21. Debt of Social Security Fund other public finance sector entities.
II.5. Guarantees granted by public finance sector entities
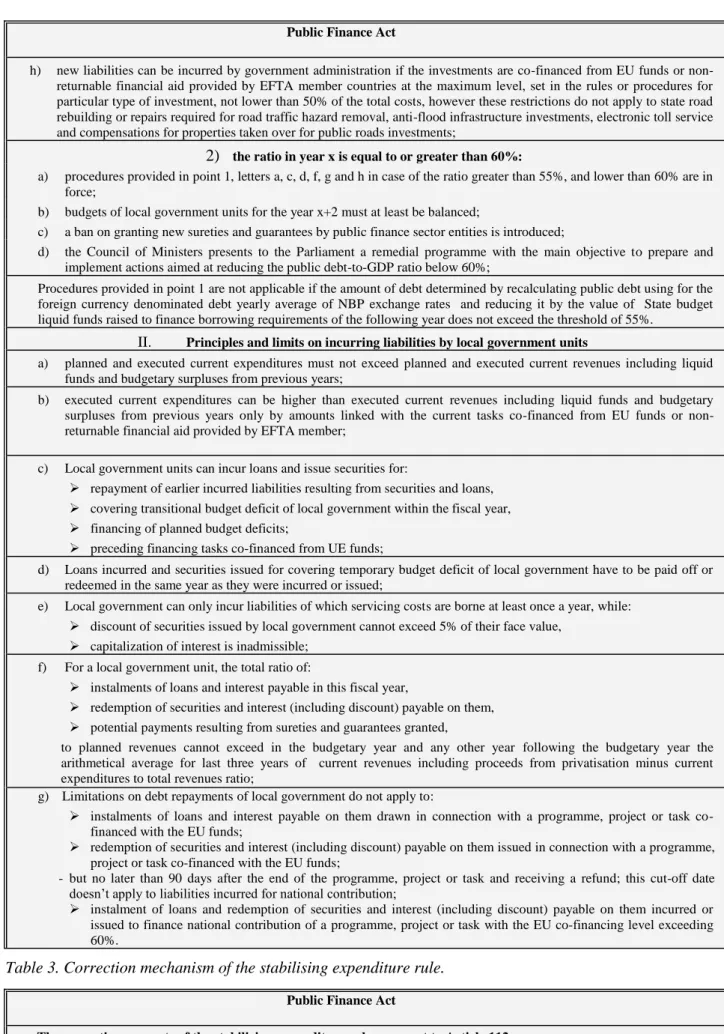
Contingent (undue) liabilities arising from guarantees granted by public sector entities at the end of the first half of 2015 amounted to PLN 112.9bn, compared to PLN 114.5bn, i.e. 6.6% of GDP in 2014 and PLN 108.9bn, i.e. 6.5% of GDP in 2013.
Liabilities due to guarantees granted by the ST had a dominant share in the potential liabilities. At the end of the 1st half of 2015 they amounted to PLN 109.0bn, as compared to PLN 110.8bn, i.e. 6.4% of GDP in 2014 and PLN 104.8bn, i.e. 6.3% of GDP in 2013. The increase in contingent liabilities until the end of 2014 resulted mainly from a large volume of guarantees granted to support the development of infrastructure.
The hitherto ST operations related to guarantees do not pose significant risks to public finance. At the end of 2014, c.a. 85% of contingent liabilities due to guarantees granted by the ST belonged to the low-risk group. The forecasted payments due to guarantees increased from
2.6 3.3 2.9 2.0 1.9 1.7 1.5 1.3 1.2 0.9 0.8 0.9 4.2 3.5 3.1 3.8 3.4 3.5 3.8 4.4 4.0 4.3 4.5 4.8 6.7 6.8 5.9 5.8 5.3 5.2 5.2 5.7 5.2 5.2 5.3 5.7 0 1 2 3 4 5 6 7 8 0 1 2 3 4 5 6 7 8 2004 2005 2006 2007 2008 2009 2010 2011 2012 2013 2014 VI 2015 PLN billion
Public finance sector units Other units
10.1 7.1 5.1 2.7 2.8 12.5 12.9 18.2 21.1 31.3 39.9 41.8 2.3 1.8 2.8 1.2 1.8 3.6 3.3 0.6 0.8 1.2 1.2 1.2 12.4 8.9 7.9 4.0 4.6 16.0 16.2 18.8 21.9 32.5 41.1 43.0 0 5 10 15 20 25 30 35 40 45 50 2004 2005 2006 2007 2008 2009 2010 2011 2012 2013 2014 VI 2015 PLN billion
19
ca. PLN 6.2bn in nominal terms at the end of 2013, to ca. PLN 6.3bn at the end of 2014, reaching 0.36% and 0.37%, respectively, in relation to GDP. At the end of 2014, the long-term risk factor for the entire portfolio of guarantees and sureties stood at less than 6%.
The biggest amounts of ST contingent liabilities (status as at 30 June 2015) resulted from: - guarantees granted for Bank Gospodarstwa Krajowego,
including the support for the National Road Fund (KFD)
PLN 76.2bn PLN 74.4bn - guarantees granted for PKP Polskie Linie Kolejowe S.A. PLN 9.9bn - guarantees of payments from the KFD for Gdańsk
Transport Company S.A.
PLN 8.6bn - guarantees of payments from the KFD granted for Autostrada
Wielkopolska II S.A.
PLN 6.8bn - guarantees granted for Autostrada Wielkopolska S.A. PLN 3.3bn
- guarantees granted for PKP Intercity S.A. PLN 1.8bn
Chart 22. Contingent liabilities under guaranties and sureties granted by the ST and the public finance sector. 3.2% 3.2% 3.0% 2.7% 2.5% 3.6% 5.2% 6.2% 6.1% 6.3% 6.4% 3.2% 3.3% 3.1% 2.8% 2.6% 3.8% 5.4% 6.4% 6.3% 6.5% 6.6% 2.0% 2.5% 3.0% 3.5% 4.0% 4.5% 5.0% 5.5% 6.0% 6.5% 7.0% 2004 2005 2006 2007 2008 2009 2010 2011 2012 2013 2014 % PKB
Contingent liabilities under ST guarantees
20
III. EVALUATION OF IMPLEMENTATION OF THE STRATEGY OBJECTIVE
In 2014 and the first half of 2015, debt management was conducted in accordance with The Public Finance Sector Debt Management Strategy in the years 2014-2017, adopted by the Council of Ministers in September 2013 and The Public Finance Sector Debt Management Strategy in the years 2015-2018 adopted in September 2014. Table 2 presents the evaluation of the progress in implementing the Strategy objective, including the risk constraints in 2014 and in the first half of 2015.
Table 2. Evaluation of the progress in implementing the Strategy objective in 2014 and in the first half of 2015.
I. Strategy objective – minimisation of debt servicing costs Level of implemen tation* Implementation method High 1. Selection of instruments
The domestic market was the basic source of financing borrowing requirements. In 2014, the face value of TS issuance amounted to PLN 116.9bn in the domestic market (including PLN 33.7 bn with floating interest rate), and funds with the face value amounting to PLN 27.4bn were raised in foreign markets (including PLN 10.0bn from IFIs); in the first half of 2015, this amount reached, respectively, PLN 56.0bn (including PLN 15.3bn with floating interest rate), and PLN 6.7bn (including PLN 0.3bn from IFIs). Main factors taken into account while deciding on the financing structure in 2014 and in the first half of 2015 included:
external factors, in particular:
o the monetary policy carried out by the main central banks:
in the euro area: two reductions of interest rates by the ECB by 10 basis points each, in June and September 2014 to the all-time lows (including the reduction of the deposit rate to -0.20%), announcement of the package of measures stimulating the economy (June 2014), initiation of the purchase programme for ABSs and covered bonds in October 2014 and extending the programme by government bonds as of March 2015 in the total amount of EUR 60bn per month (the value of the entire programme amounts to EUR 1.2bn);
in the USA: termination of the quantitative monetary policy easing programme (QE3) and expectations on the timing of monetary policy normalisation;
in Japan: increasing the asset purchase programme from JPY 50bn to JPY 80bn;
in Switzerland: discontinuing the minimum Swiss franc to Euro exchange rate and lowering interest rates by 50 basis points, resulting in strong Swiss franc appreciation against other currencies, including Polish zloty, and temporary strong weakening of Polish zloty against Euro and US dollar;
o economic rebound in the EU member states and recovery in the USA, while loweringthe economic growth rate in China and recession in the eastern trading partners, i.e. in Russia and Ukraine;
o escalation of the geopolitical conflict in Ukraine (as of February 2014) resulting in risk aversion and temporary weakening of the domestic bonds and Polish zloty;
o uncertainty as for reaching the agreement between Greece and its creditors concerning the financial assistance and the breakdown of negotiations (June 2015) resulting in reducing of Greece rating to the junk rating grade by major rating agencies, have led to strong risk aversion and significant weakening of bonds denominated in Polish zloty as well as the domestic currency;
o strong Euro depreciation against US dollar (by 19% in the period under discussion). local factors, in particular:
o monetary policy of the Monetary Policy Council (RPP) – expectations related to interest rate cuts, followed by two reductions, in total, by 100-150 basis points (in October 2014 and in March 2015, including the reduction of the reference rate to the all-time low of 1.5%) and the announcement of keeping the interest rates unchanged in the long run ;
o marked acceleration of economic growth rate of Poland in 2014 (3.4% YoY against 1.7% YoY in 2013) and its continuation in 2015 under the lack of inflation pressure and deflation YoY as of July 2014;
o the positive perception of Poland both by foreign investors and by rating agencies (upgrading the rating perspective from stable to positive by S&P agency in February 2015);
o the continuing moderate interest of foreign investors in the TS market (inflow of foreign capital in the amount of PLN 2.8 bn in 2014 and PLN 7.7 bn in the first half of 2015);
o fluctuations in the exchange rate of Polish zloty: in 2014, the EUR/PLN exchange rate was fluctuating in the range of 4.09-4.38 (volatility at a level of 5.2%), and USD/PLN exchange rate - in the range of 3.0-3.59 (8.1%), against the EUR/USD volatility at a level of 6.2%. In the first half of 2015 the EUR/PLN exchange rate was fluctuating in the range of 3.99-4.33 (volatility of 5.7%), and the USD/PLN exchange rate - in the range of 3.52-3.95 (10.2%), against the EUR/USD volatility at a level of 9.4%.
21
o decrease in yields of the domestic Treasury bonds in 2014 and at the beginning of 2015 to all-time lows (10-year bondsbelow 2%) and increase in yields as of February 2015 (mainly as a result of the financial crisis in Greece and expectations regarding the interest rates increases by Fed);
uneven distribution over time of the State borrowing requirements, arising from budget execution and the redemption of large series of bonds in January, April and July;
flexible approach to the choice of instruments and timing of issuance in order to adjust the size and structure of the offer to current and expected market conditions;
implementation of the second stage of liquidity management consolidation (details are presented in Chapter II.2); maintaining a safe level of state budget liquidity, as reflected in prefinancing of a significant part of gross borrowing
requirements of the next year (respectively, 28% of the requirements planned for 2014 and ca. 33% for 2015) at the end of the preceding year.
As far as foreign debt is concerned, the most important operations included:
regular issuance in the Euro market (in 2014, the total value of TS issued in the Euro market was EUR 2.3bn, while in the first half of 2015, it amounted to EUR 1.0 bn) and for the US dollar market - the issue of bonds with the value of USD 2.0 bn in January 2014;
maintaining the Polish presence in other major markets. In 2014 in the Swiss franc market - the issuance of TS with the value of CHF 500 million, and in April 2015 - with the value of CHF 580 million (historically, the first Polish issuance with the negative yield and, at the same time, the largest foreign bond issue with the negative yield in the Swiss market);
drawing credits from IFIs (in 2014 and in the first half of 2015, the total of EUR 2.5bn, including EUR 1.7bn from the EIB and EUR 0.7bn from the World Bank; in the second half of 2015 drawings of credits from the EIB and the World Bank are planned);
market FX swap transactions, CIRS type, enabling usage of held foreign currency funds for the service of liabilities denominated in the currency with a lower interest rate. In 2014 transactions with the total value of USD 1.0 bn were concluded, whereas those concluded in the first half of 2015 amounted to EUR 0.9bn. 2. Efficiency of the TS market
The main measures aimed at cost minimisation included:
the policy providing liquid benchmark bond issues in the domestic market. In mid-2015, 15 issues of bonds exceeded PLN 20 bn (12 at the end of 2014). The share of benchmark issues in the face value of fixed rate medium-term and long-term bonds outstanding, following the decline from 96.6% at the end of 2013 to 47.8% at the end of February 2014, arising from the cancellation of bonds as a result of the pension system reform, increased to 69.8% in June 2015. The average liquidity ratio3 having increased to 190.6% in 2014, reached 162.1% in the first half of 2015 (as a result of the reduction in turnover in the secondary market);
issuance of liquid bonds series (with face value ensuring the liquidity of a given issue) in the Euro and US dollar markets;
adjusting the level and structure of the TS supply to the current market situation and influencing this situation through information policy;
introduction in February 2014, following the entry into force of the ban on OFE investment in the TS, of the mechanism supporting the clearing under the circumstances of temporary and very limited availability of bonds of a given series in the secondary market, through the possibility of concluding the Sell/Buy Back transactions with BGK by authorised entities, i.e. Treasury Securities Dealers (PD) and PD candidates, under special terms. The limited scale of transactions (in 2014 and in the first half of 2015 transactions with the face value of PLN 4.3bn were concluded, i.e. 0.04% of all Sell/Buy Back transactions) confirmed the appropriate functioning of the bond secondary market after the changes in OFE;
issues of short-term saving bonds, so-called KOS, in February 2014 (7-month bonds, sale: PLN 282.2 million) and in December 2014 (14-month bonds, sale: PLN 485.4 million) aimed at occasional extension of the standard offer corresponding to the preferences of individual purchasers and enabling the continuation of saving to holders of maturing bonds, under attractive terms.
22
II. Constraints of the objective
Constraint
Level of implementa
tion*
Implementation method Measure
Value 2013 2014 June 2015 Ref ina ncing risk Satisfactory
Lack of Treasury bill issues since 2013;
High sale of medium and long-term bonds in 2014 and in the first half of 2015 (respectively, 69.3% and 72.0% of all TS sold at outright and switching auctions) under favourable market conditions;
High importance of switching auctions (in the period from January 2014 to June 2015 39% of the initial debt in bonds maturing in that period was bought back at switching auctions);
Decrease in the average maturity of domestic debt arising from the portfolio of the TS cancelled in February 2014, and the decline in the average maturity of the ST debt which, however, remained above the level of 5 years defined in the Strategy;
Decrease in the average maturity of foreign debt associated with the debt ageing and strong
appreciation of US dollar, as well as the significantly lower average maturity of debt denominated in USD as compared to debt denominated in EUR;
Increase in the share of instruments of up to 1 year in the domestic debt resulted from the decline in the domestic debt (cancelling of TS, mainly medium and long-term) and the debt ageing process.
ATM (in years) - domestic - foreign - total 4.49 7.19 5.33 4.19 7.08 5.24 4.16 6.79 5.09 Share in domestic TS: - TS up to 1 year - T-bills 8.1% 0.0% 12.3% 0.0% 15.4% 0.0% F o re ig n e x cha ng e risk Satisfactory
Share of foreign debt, following the growth in 2014 resulting from cancellation of domestic TS, decreased in 2015, in accordance with the assumptions of the Strategy;
Share of euro denominated debt in the foreign debt remained above the minimum level assumed in the
Strategy (70%);
Continuation of long-term non-marketable financing from IFIs.
Share of foreign debt in ST debt 30.3% 35.5% 34.1% Share of euro denominated debt in foreign debt 70.9% 70.9% 70.5% Inte re st ra te risk High
ATR of domestic debt remained within the range set in the Strategy:2.8 -3.8 years;
Risk of foreign debt, despite a slight increase, remained at a safe level and did not result in constraints for the cost minimisation objective; Lowering the risk parameters resulted from the high
sale of medium and long-term bonds, debt ageing (an increased share of TS with time to maturity less than one year) as well as the increased exposure to instruments with floating interest rate, which enabled faster adjustment of debt servicing costs to the decreasing interest rates in the financial market.
ATR (in years)
- domestic - foreign - total 3.28 5.69 4.03 3.17 5.38 3.98 3.09 5.21 3.84 Duration (in years) - domestic - foreign - total 3.00 4.77 3.59 2.93 4.79 3.63 2.78 4.55 3.42
23
*) In accordance with the following scale: high, satisfactory, moderate and low.
III. Constraints of the objective - cont.
Constraint Level of implemen t tation* Implementation method L iqui di ty ri sk High
The main instruments used in liquidity risk management included:
switching auctions (in 2014, bonds of the face value of PLN 29.7bn were bought back, while in the first half of 2015, the value reached PLN 8.2 bn);
interest-bearing PLN-denominated deposits at the NBP- deposits of the total value of PLN 92.0bn were made in 2014, while those made in the first half of 2015 amounted to PLN 56.8bn;
PLN-denominated deposits where BGK acted as an intermediary. In 2014 transactions of the total value of PLN 1,064.7bn were concluded, whereas those concluded in the first half of 2015 amounted to PLN 464.8bn;
FX swap transactions enabling temporary usage of foreign currencies held, in order to raise funds denominated in PLN. In 2014, transactions amounting to the equivalent of EUR 0.1bn were performed;
foreign currency deposits - in 2014 the deposits amounting to EUR 190.8bn were made, and in the first half of 2015 - amounting to EUR 55.9bn; sale of a part of foreign currency resources from the EU funds and those associated with the debt servicing in the foreign exchange market (in 2014 foreign currencies equivalent of EUR 9.9bn were sold) and at the NBP (EUR 3.0bn in 2014);
deposits of liquid funds of public finance sector entities in the accounts of the Ministry of Finance in BGK as part of the public finance sector liquidity management consolidation. At the end of 2014, the accumulated funds amounted to PLN 28.2bn, and at the end of June 2015 PLN 38.7bn (effect of implementation of the second stage of liquidity management consolidation in 2015).
The level of State liquid assets in 2014 and in the first half of 2015 provided for smooth execution of budgetary flows. C redi t ri sk High
Deposits in BGK, secured with TS, did not generate credit risk;
For unsecured deposits in BGK, a system of credit limits is in place;
Credit risk connected with derivatives is limited by selection of counterparties with high credit rating;
A collateral system related to transactions on derivatives in the form of blocking TS in the National Depository Securities (KDPW) is in force. Secured transactions do not generate credit risk;
The credit risk generated by unsecured transactions is diversified through limits imposed on the total value of transactions made with individual partners. Creditworthiness of potential partners is monitored on an on-going basis;
R
isk
ri
sks High
Debt management conducted in one department in the Ministry of Finance;
Technical infrastructure adequate to the requirements of conducting market transactions;
Security of information related to debt management;
Integrated database of the ST debt.
D ist ri buti on of debt se rvi ci ng cost s over t im e High
The level of servicing costs in 2014 and 2015 was affected by swap transactions concluded in 2014 within the management of the Budget Act limit and the distribution of costs between years (increase in costs by PLN 1.95bn in 2014 and reduction of costs by PLN 1.97bn in 2015);
Coupons of new issues were set close to their yields;
Switching auctions of T-bonds on domestic market and USD denominated bond buy-back auctions contributed to smooth distribution of costs.
24 IV. ASSUMPTIONS OF THE STRATEGY
The following subchapters present the main macroeconomic assumptions of the Strategy and the market conditions that affect debt management. The issues discussed include the role of both domestic and foreign investors in the domestic TS market and the development of the situation in the main international markets.
IV.1. Macroeconomic assumptions of the Strategy
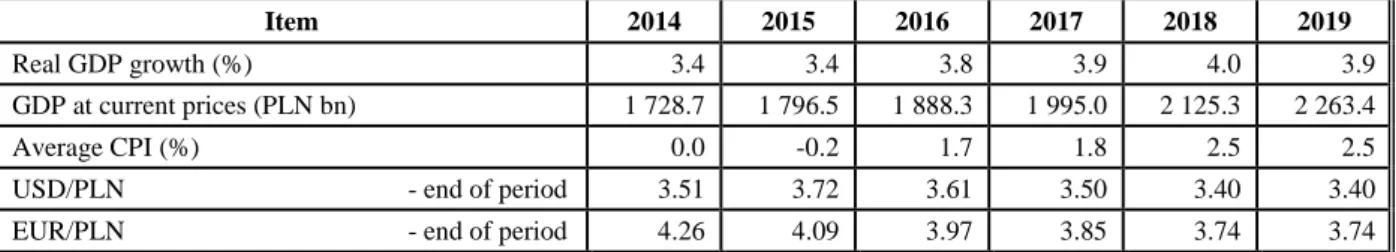
The assessment of the macroeconomic situation and directions of the fiscal policy is presented in the justification to the draft Budget Act for 2016. Table 3 presents the macroeconomic assumptions of the Strategy, compliant with the assumption of the draft budget. Table 3. Macroeconomic assumptions of the Strategy
Item 2014 2015 2016 2017 2018 2019
Real GDP growth (%) 3.4 3.4 3.8 3.9 4.0 3.9
GDP at current prices (PLN bn) 1 728.7 1 796.5 1 888.3 1 995.0 2 125.3 2 263.4
Average CPI (%) 0.0 -0.2 1.7 1.8 2.5 2.5
USD/PLN - end of period 3.51 3.72 3.61 3.50 3.40 3.40 EUR/PLN - end of period 4.26 4.09 3.97 3.85 3.74 3.74
IV.2. The domestic Treasury securities market
The level of development of the domestic financial market, including the domestic investor base, as well as the role of foreign investors in the domestic market are the significant determinants
of debt management. Under the conditions of free capital flow, a well-developed and deep domestic market allows for absorption of external shocks and outflows of foreign capital.
Over the recent years, in the holder’s structure of domestic TS the following changes were recorded:
in the years 2009-2012, an intensive inflow of foreign investors to the domestic TS market occurred (in total, by PLN 134.6bn, to PLN 190.5bn), which implied the significant growth in their share in domestic Treasury bonds from 13.3% to 35.7%. From 2013 to June 2015 non-residents continued to increase their TS holdings, however, on a significantly lower scale than in the previous years (by PLN 13.2bn in total).
as a result of the pension system reform and cancellation of domestic Treasury bonds transferred from OFE to ZUS in February 2014, the domestic non-banking sector has lost its dominant share among investors holding domestic TS, in favour of foreign investors; in addition, the share of the domestic banking sector has also increased.
from 2013 to June 2015 the domestic banking sector definitely dominated among domestic TS purchasers, partly replacing foreign investors and OFE in this role. In this period, banks increased their domestic TS holdings by PLN 74.7bn, to PLN 166.3bn.
25
Chart 24. Changes in domestic TS portfolio held by main group of investors
*) Excluding effect of cancellation of TS of nominal value of PLN 130.1bn in February 2014
IV.2.1. Domestic investor base
Due to the changes introduced in the pension system the share of domestic investors in the holder’s structure of debt in domestic TS decreased from 66.4% at the end of 2013 to 60.2% at the end of 2014. In the first half of 2015 this share increased slightly, amounting to 60.7% at the end of June 2015, including portfolios of the domestic banking and non-banking sector constituting 32.1%, and 28.6%, respectively.
The share of banks in the holder’s structure of TS debt has been growing systematically since 2013. In 2014 it increased by 10.7 pp, to 30.7%, mainly as a result of the pension system reform, but the relatively high growth in banks' domestic TS holdings was a significant factor as well. In the first half of 2015 the share of banks increased to 32.1%, which resulted from the relatively high growth in TS portfolios of these entities.
The relatively high demand of the domestic banking sector for domestic TS in the recent years, implying the growing share of banks in the structure of TS debt, was related to the continuing over-liquidity in this sector. Moreover, banks absorbed TS supply under the limited growth in holdings of foreign investors and the domestic non-banking sector.
In 2014, over-liquidity of the banking sector slightly decreased (to PLN 108.8bn compared to the record level of PLN 126.5bn in 2013) and according to the "Assumptions of the monetary policy for 2014" presented by the Monetary Policy Council, in 2015 it will remain at the level similar to that recorded in 2014. These factors, as well as the high growth in TS in banks' assets since the beginning of 2013 (PLN 74.7 bn, whereas in the years 2004-2012 the growth in holdings amounted to PLN 8.9 bn) and the continued economic growth (fostering the increase in the scale of loans granted) may influence on restricting the possibility of the banking sector to absorb TS supply in the future.
Beside the banking sector, entities representing the non-banking sector constitute the second major group of domestic investors. Their share in the domestic TS debt, following the decline to the level of 29.5% in 2014 (from 46.4% at the end of 2013) as a consequence of the pension system reform, decreased to 28.6% in the first half of 2015, which resulted from the relatively limited growth in the TS portfolio held by this group of entities.
Due to the long-term, stable investment policy, investment funds and insurance companies represent particularly important entities among non-banking investors. The total share of these entities in the domestic TS amounted to 20.3% at the end of 2014 (compared to 17.2% at the end of 2013), whereas in June 2015 it has reached the level of 19.8%, decreasing slightly since the beginning of 2015.
The main factor affecting the value of TS portfolio held by investment funds and insurance companies is the value of assets of these entities. Over the recent years, a systematic growth in assets managed by these institutions has been observed. The upward trend is particularly visible
26
in case of investment funds which assets have doubled from 2012 to June 2015. In the same period, assets under management of insurance companies increased by 23.3%. The share of TS in assets of investment funds has slightly decreased in the recent years, amounting to ca. 23% at the end of June 2015, whereas for insurance companies it remains at a stable level, constituting ca. 1/3 of the value of assets.
Chart 25. Assets of non-banking financial institutions and TS share in their assets*
*) For OFE and investment funds net assets are presented (assets reduced by liabilities)
The main factors to determine the value of the assets under management of non-banking financial institutions in the forthcoming years include:
further development of the insurance and investment funds market;
changes in the level of domestic savings;
situation in the stock market, which is one of the factors determining the decisions on savings allocation by households.
Besides the aforementioned factors related to the value of assets and the investment portfolio management policy, the developments in the share of domestic investors in the holder’s structure of domestic TS debt in the forthcoming years will also depend, to a major extent, on the level of borrowing requirements, determining the level of TS supply offered to investors. The increase in domestic investors' share will be possible under the condition of continued fiscal consolidation process, which enable to limit borrowing requirements and prevent facing the absorption barrier for domestic investors.
IV.2.2. Role of foreign investors
Foreign investors play a significant role in financing the State budget borrowing requirements on the domestic market. Their demand strongly depends on the international situation.
From the beginning of 2009 to April 2013 the significant upward trend of domestic TS portfolio held by foreign investors was recorded – the holdings of this group of investors increased almost 4-fold over the entire period. In the second half of 2013 and in the first quarter of 2014, the reversal of this trend occurred, affected by such contributing factors as the monetary policy of Fed and the increase in risk aversion due to the conflict in Ukraine. In the second quarter of 2014, under the influence of the expansive ECB policy, a growth in non-residents’ domestic TS holdings was observed (up to record in this year level of PLN 199.8bn at the end of June). In the second half of 2014, foreign capital flows developed under the influence of, on the one hand, expansive ECB monetary policy and, on the other hand, the expected further easing of the monetary policy by the RPP as well as situation in Ukraine. In total, in 2014 non-residents increased their domestic TS holdings by PLN 2.8bn, to PLN 196.0 bn, which represented 39.8% of debt in those instruments (compared to 33.6% at the end of 2013). This growth in share was mainly the statistical effect of the pension system reform. In the first half of 2015 the value of TS portfolio held by non-residents increased by PLN 7.7bn, to PLN 203.7bn (39.3% share in domestic TS). It was mainly the result of the expansive ECB monetary policy, the debt crisis in Greece as well as expectations related to the rise of interest rates by Fed.
27
Chart 26. Monthly changes in domestic TS portfolio held by foreign investors
The detailed data available to the Ministry of Finance since April 2014 indicates that the structure of foreign investors holding domestic TS is well-diversified, both in institutional and in geographical terms. It significantly reduces the risk related to a sudden, massive outflow of non-residents from the Polish TS market - the higher the diversification, the lower the risk of single-track actions of these investors.
In the structure of debt in domestic TS held by foreign investors (according to the data for June 2015), stable institutional investors play a dominant role, including: investment funds (42.6%), pension funds (7.4%), insurance companies (6.6%). The growing TS holdings of central banks and public institutions, recognised as the most stable, long-term investors, draws particular attention. In June 2015 the share of these entities reached 19.1% and it has almost doubled since data is available, which resulted mainly from the systematic inflow of capital from Asia (62.3% share in debt held by central banks and public institutions). Significant purchasers of domestic TS are central banks and public institutions from the non-EU European countries (25.7%) and the Middle East (11.7%) as well.
Chart 27. Domestic TS debt towards non-residents by holder and domestic TS debt towards central banks and public institutions by region (data as of June 30, 2015)
*) Excluding omnibus accounts
The geographical structure of foreign investors includes non-residents from the Eurozone countries (29.8% share in June 2015), Asia (28.7%), North America (24.7%), as well as other regions (16.9% in total). The largest growth in domestic TS holdings since April 2014 applied to Asian investors (PLN +22.1bn, increase in the share by 12.1 pp). The decline in TS holdings applied mainly to non-residents from North America and Eurozone countries, by PLN 7.5bn (decrease in the share by 6.5 pp) and by PLN 4.8bn (decrease in the share by 5.1 pp), respectively.
At the end of June 2015 domestic TS were held in portfolios of foreign investors representing 59 countries, including the US (27.6%), Luxembourg (18.3%), Japan (12.9%), Norway (5.7%),