University of Wollongong
Research Online
Faculty of Engineering and Information Sciences-Papers: Part A Faculty of Engineering and Information Sciences
2016
Effect of deformation on microstructure and
mechanical properties of dual phase steel produced
via strip casting simulation
Zhiping Xiong
University of Wollongong, [email protected]
Andrii Kostryzhev
University of Wollongong, [email protected]
Nicole Stanford
Centre for Material and Fibre Innovation, Deakin University, [email protected]
Elena V. Pereloma
University of Wollongong, [email protected]
Research Online is the open access institutional repository for the University of Wollongong. For further information contact the UOW Library: [email protected]
Publication Details
Xiong, Z. P., Kostryzhev, A. G., Stanford, N. & Pereloma, E. V. (2016). Effect of deformation on microstructure and mechanical properties of dual phase steel produced via strip casting simulation. Materials Science and Engineering A: Structural Materials: Properties, Microstructure and Processing, 651 291-305.
Effect of deformation on microstructure and mechanical properties of dual
phase steel produced via strip casting simulation
Abstract
The strip casting is a recently appeared technology with a potential to significantly reduce energy consumption in steel production, compared to hot rolling and cold rolling. However, the quantitative dependences of the steel microstructure and mechanical properties on strip casting parameters are unknown and require investigation. In the present work we studied the effects of strain and interrupted cooling temperature on microstructure and mechanical properties in conventional dual phase steel
(0.08C-0.81Si-1.47Mn-0.03Al wt%). The strip casting process was simulated using a Gleeble 3500 thermo-mechanical simulator. The steel microstructures were studied using optical, scanning and transmission electron microscopy. Mechanical properties were measured using microhardness and tensile testing. Microstructures consisting of 40-80% polygonal ferrite with remaining martensite, bainite and very small amount of Widmanstätten ferrite were produced. Deformation to 0.17-0.46 strain at 1050. °C refined the prior austenite grain size via static recrystallisation, which led to the acceleration of ferrite formation and the ferrite grain refinement. The yield stress and ultimate tensile strength increased with a decrease in ferrite fraction, while the total elongation decreased. The improvement of mechanical properties via deformation was ascribed to dislocation strengthening and grain boundary strengthening.
Keywords
effect, deformation, microstructure, mechanical, casting, properties, simulation, dual, phase, steel, produced, via, strip
Disciplines
Engineering | Science and Technology Studies
Publication Details
Xiong, Z. P., Kostryzhev, A. G., Stanford, N. & Pereloma, E. V. (2016). Effect of deformation on
microstructure and mechanical properties of dual phase steel produced via strip casting simulation. Materials Science and Engineering A: Structural Materials: Properties, Microstructure and Processing, 651 291-305.
1
Development of a novel phase change emulsion material for cooling systems
Jingjing Shaoa,*, Jo Darkwaa and Georgios Kokogiannakisb
a Department of Architecture and Built Environment, Faculty of Engineering, University of Nottingham,
University Park, NG7 2RD Nottingham, UK
b Sustainable Buildings Research Centre, University of Wollongong, Wollongong NSW 2522, Australia
Correspondence information:
Corresponding author: Jingjing SHAO, PhD candidate
Add: Department of Architecture and Built Environment, University of Nottingham, University Park,
Nottingham, UK, NG7 2RD
Tel: +44 (0) 7436993953
2
Development of a novel phase change emulsion material for cooling systems
1
Jingjing Shaoa,1Jo Darkwaa and Georgios Kokogiannakisb
2
aFaculty of Engineering, University of Nottingham, University Park, NG7 2RD Nottingham, UK 3
b
Sustainable Buildings Research Centre, University of Wollongong, Wollongong NSW 2522, Australia
4
Abstract
5
In this paper, a novel phase change emulsion material (PCE-10) consisting of an organic 6
PCM (RT10) and water has been developed. Its thermophysical properties such as heat of 7
fusion, viscosity and sub-cooling temperature have been established. The chemical stability 8
during both storage and discharge periods have also been evaluated. The results indicate low 9
sub-cooling temperature and relatively long period of stability without any sign of 10
segregation but the viscosity was found to be much higher than that of water. 11
Further improvement and experimental studies into its flow characteristics are therefore 12
being encouraged. 13
Keywords: PCM emulsion; preparation method; thermo-physical properties; stability
14 15
Nomenclature
16
Tm Melting point △hf Latent heat capacity
Cp Specific heat capacity Δhe Heat storage capacity
η Viscosity Δhs Sensible heat capacity
φ Volume fraction T Temperature
X Weight fraction V Volume
Subscripts
e Emulsion S surfactant
p Paraffin separate Separated phase
w Water
17
1
3
1. Introduction
18
Over last few years, chilled water system powered by environmental friendly energy 19
resources has attracted great attention. However, the availability of renewable energy, such as 20
solar and wind, is uncontinuous. Efficient thermal energy storage (TES) for reducing the 21
mismatch between energy supply and demand for cooling applications is necessary [1]. In 22
addition, chilled water circulation pumps are responsible for roughly 15%-30% of the overall 23
energy consumption [2]. 24
To this end, some researchers have suggested replacing water with phase change 25
emulsions (PCMEs) as cooling media which consist of phase change materials (PCMs) and 26
carrier fluids such as water. This is based on the fact that, they possess higher heat capacities 27
and therefore capable of reducing volume flow rates and energy consumption in pumps [4]. 28
PCMEs could also act as the thermal storage material simultaneously, reducing the mismatch 29
between energy supply and demand for cooling applications [5]. 30
However, most of the commercially available PCMEs do experience high levels of sub-31
cooling temperatures which tend to affect the performance of refrigeration equipment. For 32
instance Huang et al. [6] observed poor performance in a refrigeration system at high sub-33
cooling temperatures of 4.3K and 14.7K when tetradecane/water and hexadecane/water 34
PCMEs were used respectively. Royon and Guiffant [7] also observed poor performance at a 35
sub-cooling temperature of 5.6 K when aliphatic hydrocarbons-water emulsion was tested. 36
Another main barrier affecting the application of PCMEs is the thermal instability that 37
they experience after a period of usage and storage. Typically, air conditioning systems 38
operate for a period of six months each year [8]. Therefore the PCMEs should be able to 39
remain stable for at least six months and also not experience any temperature stratification 40
when the air conditioning systems are in operation. Literature review shows that most of the 41
currently available PCMEs fail to meet these requirements. For example, the emulsion 42
4
developed by Xu et al. [9] with tetradecane and water was stable for only 40-50s. The sample 43
tested by Schalbart et al. [10] achieved a short period of storage stability at room temperature. 44
Vilasau et al. [11] also tested the freeze-thaw stability of a paraffin emulsion and achieved 45
stability for only 5 cycles. The PCME developed by Huang [12] experienced instability after 46
a short storage period of one month and 100 melting/freezing thermal cycling. 47
This study is therefore intended to develop a novel phase change emulsion material that is 48
capable of overcoming these technical barriers. 49
2. Development of PCME
50
2.1 Selection of Paraffin
51
According to Huang et al [12], selection of PCMEs for air conditioning application should 52
be based on properties such as high heat capacity, low sub-cooling temperature, long term 53
storage stability and low viscosity. Paraffin materials such as tetradecane CH3-(CH2)12-CH3 54
(Tm=5.8°C, △hf=227 kJ∙kg-1) and pentadecane CH3-(CH2)13-CH3 (Tm=9.9°C, △hf=206 kJ∙kg-1) 55
are typical pure organic PCMs which may be combined with water to form PCMEs for 56
cooling applications within a phase transition temperature range of 7-12°C. However, due to 57
the relatively high cost of pure PCM, commercially available blended paraffin such as RT6 58
and RT10, are widely used for practical application. It should be noted that since the RT 59
series are mixtures of different paraffin their melting/freezing processes do not occur at 60
specific temperatures but rather over a temperature range. 61
The properties of RT10 and RT6 are listed in Tab. 1 [13]. For this development, RT10 was 62
selected as the core material because its melting/freezing temperature falls within the working 63
temperature of air conditioning systems. It also has higher heat of fusion and lower sub-64
cooling temperature than RT6. 65
66 67
5 68
Table 1: Thermo-physical properties of RT6 and RT10 [14] 69
RT6 RT10
Density (g/cm3) 0.73 0.8
Melting temperature range Te (°C) 2.8-8.3 2.3-12
Peak melting point Tp,m(°C) 7 9
Freezing temperature range Tp,f (°C) 3.5-7.2 5.1-11.8
Subcooling (°C) 1.1 0.2
Heat of fusion (kJ kg-1) 132 135
Conductivity (W m-1K-1) 0.19 0.21
Viscosity (mPas) 18 22
70
2.1.1 Determination of Paraffin Concentration
71
PCMEs are expected to have at least heat capacity of twice as high as that of water [14]. In 72
the temperature range of 7–12°C, water has a sensible heat capacity of 20.9 kJ∙kg-1, and 73
therefore the PCME should have at least a heat capacity of 40 kJ∙kg-1. 74
In the temperature range from T1 to T2, total heat storage capacity of PCME Δhe is the sum 75
of latent heat capacity of the emulsion Δhf,e, the sensible heat capacity of water Δhs,w and that 76 of paraffin Δhs,p as follows [15]: 77 ) ( ) ( 2 1 , 2 1 , p f, p s, w s, e f, e h h h X h X C T T X C T T h p W pW p pp (1) 78
Where, Xw and Xp are the weight fractions of paraffin and water, Δhf,p is the heat of fusion 79
of paraffin in the temperature range of T1 to T2. Cp, w and Cp, p are the specific heat capacity of 80
water and the average specific heat capacity of the paraffin, respectively. 81
In the temperature range of 7–12°C, 25wt% PCME has a total heat capacity of 41 kJ∙kg-1, 82
which is almost 2 times as high as that of water. As indicated in Equ. 1, the heat capacity of 83
PCME is proportional to concentration of paraffin [12]. For paraffin concentration lower than 84
25wt%, the total heat capacity of the sample would fall short of the above criteria hence the 85
limit for this case.. 86
Appropriate PCME for application in air conditioning systems should also have low 87
viscosity to ensure an acceptable level of pressure drop in pumps. Zhao [16] proposed the 88
following equation for predicting the kinematic viscosity of a two liquid mixture. 89
6
ek
w (2)
90
Where, η and ηw are the viscosities of emulsion and water respectively, φ is the volume 91
fraction of oil phase and k is a constant which equals to 7 when φ ≤0.74. 92
For PCM concentrations over 35wt%, the viscosity of emulsions will be 15 times that of 93
water. PCME is required to have a low viscosity for applications in pump systems. Thus, the 94
paraffin weight fraction should not be more than 35wt% for this case. 95
Based on the theoretical analysis, different samples of emulsions consisting of 25wt%, 96
30wt% and 35wt% concentration levels of paraffin were prepared for evaluation as 97
summarised in Tab. 2. Analysis of the results shows that the sample containing 25wt% of 98
paraffin is the most appropriate type with the acceptable level of heat of fusion and the 99
highest thermal conductivity. It also has the lowest viscosity value and therefore suitable for 100
reducing energy consumption in pumping systems. 101
102
Table 2: Physical properties of 25-35wt% of RT10/Water emulsion 103 Paraffin (RT 10) Concentration (wt%) Heat of fusion (kJ∙kg-1) Heat storage capacity (KJ∙kg-1)
Heat storage ratio PCME-to water ratio
Viscosity (mPas) Conductivity (W∙m-1∙K-1) 25 30.8 42 1.99 21 0.40 30 31.2 42.2 2.01 30 0.34 35 31.5 42.6 2.03 36 0.33 0% - 21 - 1.3 0.60 104 2.2 Selection of Surfactant 105
Since paraffin and water are immiscible, the emulsion has to be stabilised with surfactant 106
to prevent segregation of different components. The Hydrophile-Lipophile Balance (HLB) 107
method was therefore adopted to determine the appropriate type of surfactants needed to 108
stabilize the RT10/water emulsion. The principle of this method is to match the specific HLB 109
requirement (RHLB) of the oil phase against the HLB value of the surfactant in order to 110
7
obtain an optimum emulsification. HLB values can range from 0 to 20 depending upon the 111
composition of the surfactant. As the HLB value increases, the surfactant becomes more 112
hydrophilic and less lipophilic. In a situation where two or more surfactants are mixed 113
together, the resulting HLB may also be calculated by using the following formula [17, 18]: 114 ... 2 , 2 , 1 , 1 , X HLB X HLB HLB S S S S (3) 115 2.2.1 Determination of RHLB 116
For the required HLB of oil phase, a series of emulsions will be made. Each emulsion will 117
have the same amount of oil phase, water and surfactants but at a different HLB value. Any 118
pair of non-ionic surfactants can be used to determine the appropriate values of HLB but one 119
of them should have a low HLB number (<6) and the other a high HLB number (>14). In this 120
study, two types of surfactants Brij 52 (HLB=5) and Tween 20 (HLB=16.7) were selected to 121
produce five different emulsions and Eq. (3) was used to obtain their corresponding HLB 122
values. The blended samples were then kept in test tubes and observed over a period of time 123
in order to evaluate their chemical stability levels. As summarised in Tab. 3 sample No. 3 124
achieved the longest period of chemical stability. Based on this result, the HLB requirement 125
of the system is closest to 10.9. 126
127
Table 3: Required HLB values 128 Sample No. Surfactants Calculated HLB Chemical separation period (min) Brij 52 Tween 20 1 100% 0% 5.0 ≤5 2 60% 40% 9.7 ≤90 3 50% 50% 10.9 >90 4 40% 60% 12.0 ≤30 5 0% 100% 16.7 ≤5
8 129
2.2.2 Optimised blend of surfactants
130
Even though sample No. 3 appears to be the best candidate, it may not be the best 131
combination as their chemical structures can affect the stability of the emulsions. For instance, 132
surfactants with longer hydrocarbon tails are more effective in stabilizing dispersions than 133
those with shorter carbon chain lengths [19]. For these reasons different types of non-ionic 134
surfactant and an ionic surfactant (HTAB) with mixture HLB values around 10.9 were 135
blended and tested for stability after 48-hour storage period. This was assessed through their 136
separation rates by dividing the sum of the volume of water separated in the test tubes plus 137
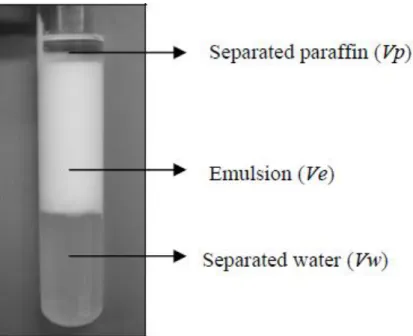
that of paraffin (Vseperate = Vw + Vp) by the total sample volume (Vtotal= Vw + Vp + Ve). This is 138
explained in Fig. 1 and expressed mathematically in Eq. (4) as: 139 % 100 % 100 %V V V V V V V V seperate total w p w p e (4) 140
Analysis of the results in Tab. 4 shows that the blend of Tween 60 and Brij 52 surfactants 141
achieved the highest level of stability without any sign of separation after the monitored 142
period and was attributed to their combined long hydrocarbon tails of 18 and 16 carbon atoms 143
respectively in the alkyl chain. This is further supported by previous research [19] which 144
indicated that long hydrocarbon tail can also act as nucleation centre for activating 145
crystallization and for reducing sub-cooling. To this end, 60% Tween60 and 40% Brij52 146
surfactants were selected for the optimum surfactant blend. 147
9 149
Figure 1: Emulsion separation 150
151
Table 4: Optimised surfactant blends 152
Sample No. Surfactant types Calculated HLB Separation
Rate Blends of surfactants %wt ratio
6 Brij 35/Brij 52 50:50 11.0 60% 7 HTAB/Brij 52 55:45 10.9 60% 8 Tween 60/Brij 52 60:40 10.9 0 9 Tween 20/Brij 52 50:50 10.9 20% 10 Brij 58/Brij 52 50:50 10.5 50% 153 2.2.3 Concentration of Surfactant 154
Regarding the level of concentration of surfactant, Wang et al [20] suggested that 10-25% 155
of dispersed phase of surfactant would be effective in ensuring the stability of PCME under 156
either storage or mechanical-thermal cycling condition. However, other investigations 157
revealed that, concentration level should not be lower than 5wt% of total emulsion mixture 158
[21, 22]. 159
In order to establish the appropriate level of concentration, 25% RT10 and water 160
emulsions with different mass fractions of the blended surfactant (5-20% of oil phase) were 161
prepared and tested for storage stability over a period of 72 hours. As summarised in Tab. 5, 162
10
sample No. 4 achieved the best stability result with no sign of chemical separation whereas 163
samples No. 1-3 suffered from rapid chemical separation of various components before the 164
end of testing period. Sample No. 5 (20% Surfactant/oil phase ratio) produced the worst 165
result with large amount of bubbles during the emulsification process and was therefore 166
considered unsuitable for testing. 167
168
Table 5: Evaluation test results for blended surfactants 169 Sample No. RT10 Concentration Water Concentration Blended surfactant Tween 60/Brij 52(3:2) Chemical separation period (min) Separation rate at 72hr Concentration of surfactant Surfactant/oil ratio 1 25% 74.75% 1.25% 5% <6 60% 2 25% 73% 2% 8% ≤20 45% 3 25% 72.5% 2.5% 10% ≤48 50% 4 25% 71.25% 3.75% 15% >72 0 5 25% 70% 5% 20% Not applicable Not applicable 170 2.3 Preparation of PCME 171
Phase change emulsion was prepared by the so-called “mixing film synthesis”. All the 172
constituents were initially weighted by a precision weighing scale as given in Tab. 6. The 173
lipophilic surfactant Brij 52 was then dissolved in RT10 (Mixture A) while hydrophilic 174
surfactant Tween 60 was mixed with deionized water (Mixture B). The mixtures were heated 175
separately to about 50- 55°C before being added together and pre-emulsified using a 176
magnetic hot plate stirrer at a speed of 500rpm and at 50°C for 15 minutes. Final 177
emulsification was carried out by passing the coarse emulsion through a rotor-stator machine 178
type ULTRA-TURRAX T18 at an emulsifying speed of 7200rpm for another 45 minutes. 179
The developed sample which was named as PCE-10 could be described as a white milky Oil-180
in-Water emulsion. 181
11
Table 6: Composition of PCME 183 Components Wt% RT10 25.0 Tween 60 2.25 Brij 52 1.5 Water 71.25 184
3. Characterisation of developed emulsion (PCE-10)
185
3.1 Particle Sizing
186
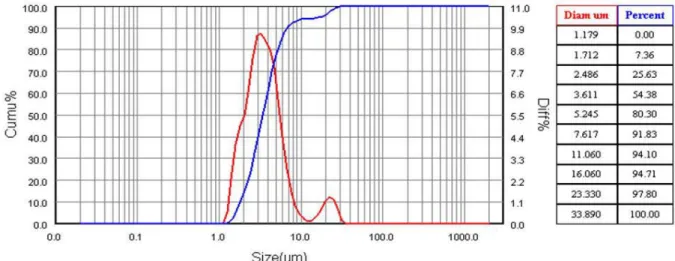
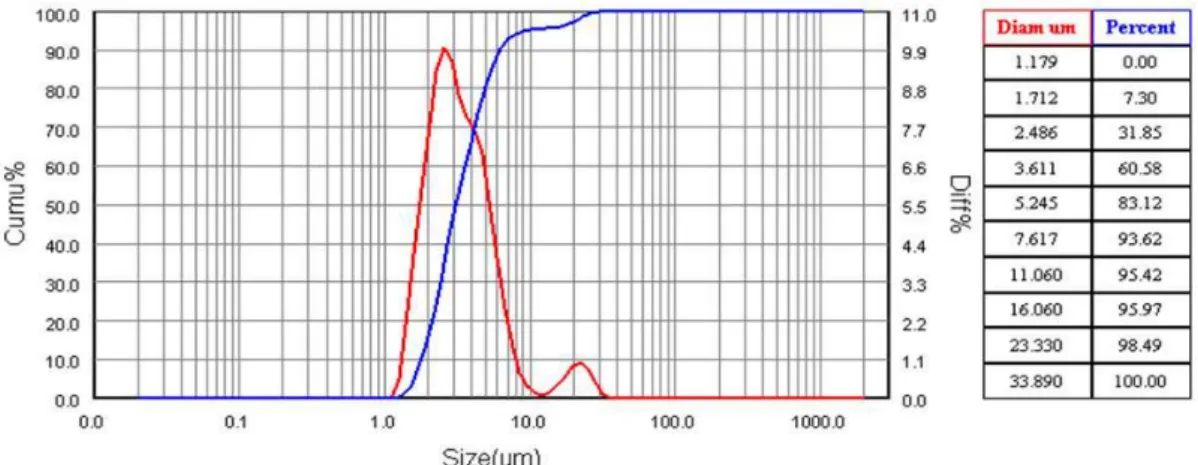
Particle sizing and their distribution profiles are important parameters for specifying 187
emulsions. Normally, dispersions with smaller particle sizes represent increased stability than 188
those with coarse droplets. On the other hand, viscosity generally increases significantly with 189
smaller particle sizes for a given mass or volume concentration in the dispersed phase. This is 190
confirmed by Schramm et al. [23] which reported that the size and characteristics of particles 191
do affect the stability, viscosity and thermal properties of emulsions. In this regard, a laser 192
particle size analyser was used to establish the size of the PCE-10 and as a reference for the 193
stability test. As presented in Fig. 2, the mean particle size was obtained as 3.14μm. 194
195
196
Figure 2: Laser Particle sizing of PCE-10 197
12
3.2 Thermal Conductivity
199
The thermal conductivity of the sample was determined with a KD2 Pro Thermal 200
Properties Analyser, which has the ability to test liquid samples with accuracy of ±5%. After 201
repeated tests the average thermal conductivity of the PCE-10 was obtained as 0.4 W∙m-1∙K-1 202
at a temperature of 25°C as summarised in Tab. 7. 203
204
Table 7: Thermal Conductivity Results 205
Test No. Temperature (°C) Thermal Conductivity (W∙m-1∙K-1) 1 24.94 0.409 2 25.00 0.406 3 25.22 0.400 Average 25.11 0.403 206
3.3 Phase Transition Temperature and Heat Capacity
207
The phase change temperature and the heat of fusion tests were conducted on 5mg sample 208
of the PCE-10 with a Differential Scanning Calorimetry (DSC) apparatus type EXSTAR SII 209
DSC6220 at a scanning rate of 1 °C∙min-1. DSC enables heat associated with flow in a sample 210
to be evaluated as a function of temperature. This may be achieved by recording the 211
difference in heat flow between a sample and a reference material as a function of 212
temperature as expressed mathematically in Eq. 5 [24]. 213 ) ( ) ( dt dH dt dH dt dH reference sample (5) 214
As presented in Fig. 3, an average value for the heat of fusion was obtained as 30.5 kJ∙kg-1 215
(Δhf,p)within a temperature range of 4 °C (Te) and 11.94°C (Tc). Now by using Eq. (1), the 216
heat storage capacity was calculated as 60.5 kJ∙kg-1 which is 1.8 times of water i.e. 33.4 217
kJ∙kg-1 within the same temperature range. 218
13 220
Figure 3: DSC curves of PCE-10 221
222
3.4 Sub-cooling temperature
223
Sub-cooling lowers the crystallization temperature of a liquid or a gas, thus latent heat is 224
released at a lower temperature or in a wider temperature range [25]. A large sub-cooling 225
temperature is therefore not acceptable because it would enlarge the operating temperature 226
range of a cooling system and thus affects its performance. 227
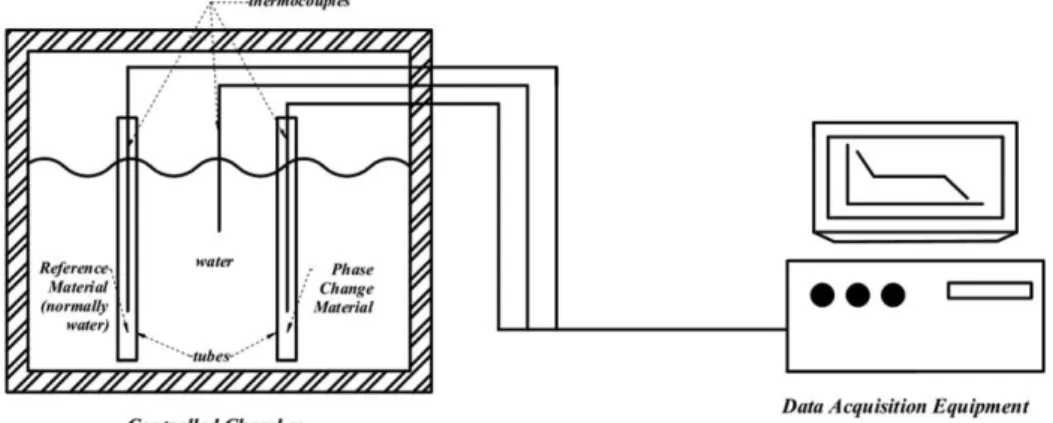
The sub-cooling test was conducted with the T-history method which is normally used in 228
measuring the thermal properties of bulk materials [26]. As demonstrated in Fig. 4, one of the 229
test tubes was filled with PCM and the other with a reference material, usually water, due to 230
its well-known thermo-physical properties. The tubes were then preheated above the melting 231
temperature of the PCM and then simultaneously exposed to the ambient temperature to 232
obtain the temperature history (T versus t) curves. A typical T-history curve of PCM with 233
sub-cooling is as presented in Fig. 5. The ΔTm (=Te-Tc) is the sub-cooling degree. 234
14 236
Figure 4: Schematic setup for T-history method 237
238
239
Figure 5: A typical T-history curve of PCM [26] 240
241
The T-history curve of PCE-10 was shown in Fig. 6. Analysis of the curves showed a 242
small sub-cooling degree of 0.2°C in the developed sample. 243
15 245
Figure 6: T-history curve of PCE-10 246
247
3.5 Viscosity Test
248
Kinexus Lab+ Rotational Rheometer was used to determine the viscosity of PCE-10. The 249
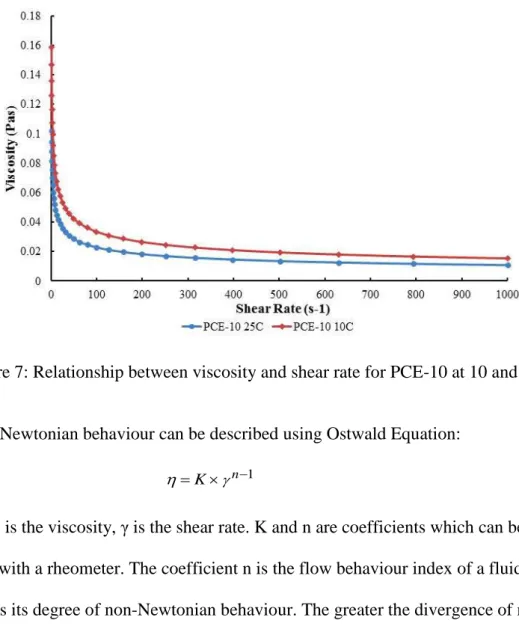
plate diameter is 50mm, the cone diameter is 50mm, and the cone angle is 1°. Fig. 7 250
illustrates the relationship between viscosity and shear rate for the developed PCME at 25°C 251
and 10°C. The emulsion is a pseudo-plastic fluid and shows a shear thinning behaviour. The 252
viscosity of the emulsion reduced rapidly with increasing shear rate but stabilised at around 253
13mPas after 600s-1. However, the viscosity appears quite high since it is about 13 times 254
higher than that of water. 255
16 257
Figure 7: Relationship between viscosity and shear rate for PCE-10 at 10 and 25°C 258
259
The non-Newtonian behaviour can be described using Ostwald Equation: 260
K n1
(5) 261
Where, η is the viscosity, γ is the shear rate. K and n are coefficients which can be 262
determined with a rheometer. The coefficient n is the flow behaviour index of a fluid which 263
characterizes its degree of non-Newtonian behaviour. The greater the divergence of n from 264
unity in either direction, the more non-Newtonian is the fluid. For Newtonian fluids, n= 1 and 265
for pseudo-plastic fluids n<1. The coefficient K, flow consistency index, defines the fluid’s 266
consistency. The larger the value of K, the thicker is the fluid. 267
The coefficients K and n of PCE-10 were obtained by interpreting the curves in Fig. 7 with 268
the Ostwald Equation Eq. (5). The obtained K and n are shown in Tab. 8 269
270
Table 8: Coefficients K and n of PCE-10 271 T (°C) K n 10 0.1887 0.662 25 0.102 0.675 272
17
3.6 Stability Test
273
Non-cycling mode
274
The emulsions were stored in containers made of glass at room temperature. The test was 275
carried out at a room temperature through visual inspection and over periodic number of days. 276
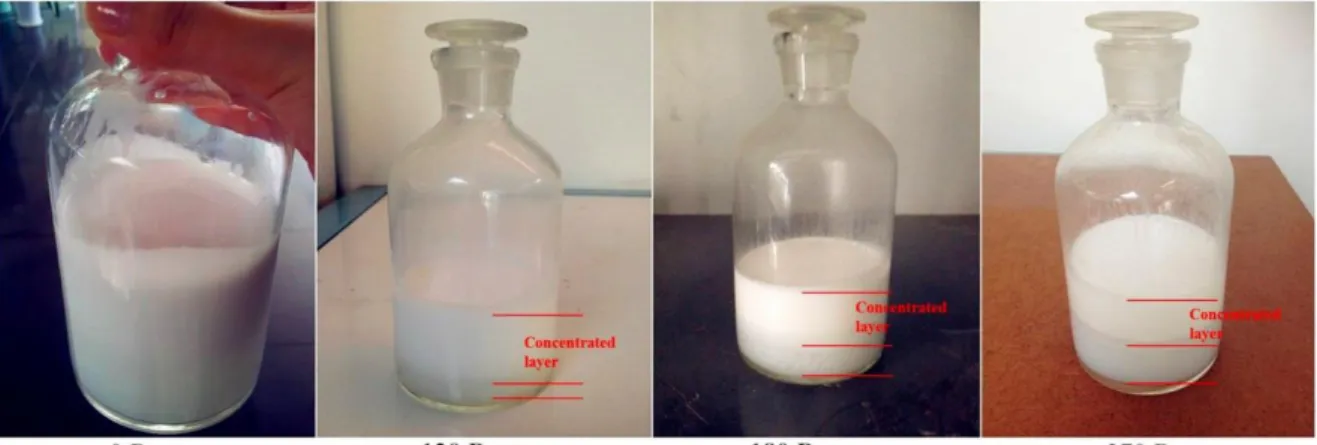
As presented in Fig. 8, separation started to occur after 90 days of storage and by the end of 277
270 days there was a clear separation between the upper and lower layers. This phenomenon 278
is called creaming and it is caused by the fact that paraffin has a lower density than water. 279
Creaming is the movement of oil droplets under gravity or in a centrifuge to form a 280
concentrated layer at the top of an oil-in-water emulsion. Particle size distribution of sample 281
was tested at the end of the storage period. The result shows a value of 3.41μm (see Fig. 9) at 282
the end of 270 days storage as compared with the original value of 3.14μm. This indicates the 283
presence of oil droplets coalescence. 284
285
286
Figure 8: Phase separation of emulsion 287
18 289
Figure 9: Particle sizing of PCE-10 after 270-day storage 290
291
Cycling mode
292
The stability of the sample was examined after being subjected to a number of thermal and 293
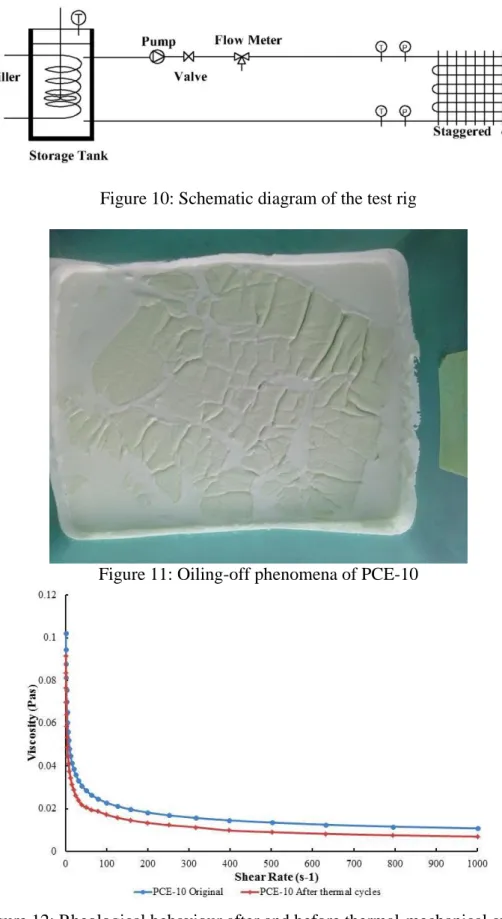
mechanical loadings. The test rig as illustrated in Fig. 10, consists of a storage tank, a heat 294
exchanger and a circulating pump. The sample was initially cooled down from 25°C to 5°C 295
and then reheated to 15°C. After 500 cycles, a clear layer of oil was observed (i.e. oiling-off 296
phenomena) as shown in Fig. 11 at the surface of the sample which was a sign of separation 297
of the base material (RT10) from the emulsion. 298
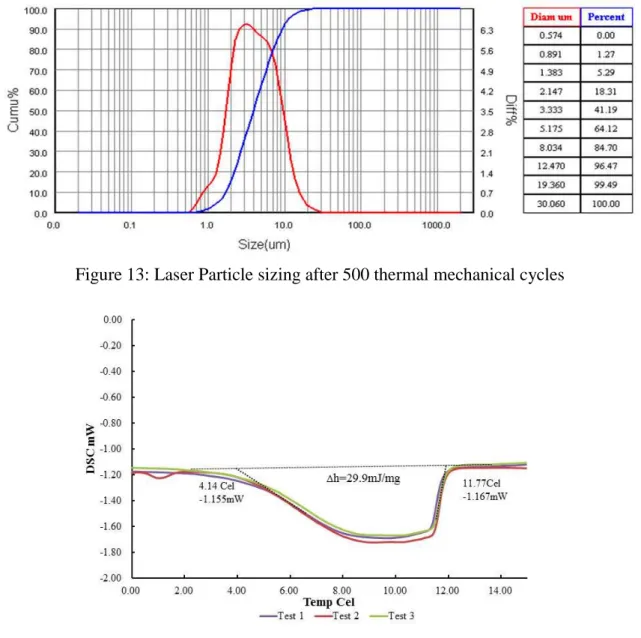
The droplet size distribution, viscosity and thermal properties of the samples were then 299
analysed and compared with the data before cycling. As shown in Fig. 12, there was a slight 300
increase in viscosity from 13mPas to 16mPas at 500rpm. The droplet size also increased 301
slightly from the original size of 3.14μm to 3.93μm (see Fig. 13). The latent heat of fusion 302
was reduced from 30.5 to 29.9 kJ kg-1 as illustrated in Fig. 14. This was attributed to the fact 303
that when the emulsion was heated above the melting point, the crystallized droplets melted 304
and fused together thus leading to coalescence and oiling-off at the surface of the emulsion. 305
Although some changes were observed in the properties, the emulsion remained in dispersion 306
and maintained the heat capacity after the test. 307
19 309
Figure 10: Schematic diagram of the test rig 310
311
312
Figure 11: Oiling-off phenomena of PCE-10 313
314
Figure 12: Rheological behaviour after and before thermal-mechanical cycles 315
20 317
Figure 13: Laser Particle sizing after 500 thermal mechanical cycles 318
319
320
Figure 14: DSC curves of PCE-10 after 500 thermal mechanical cycles 321
4. Conclusion
322
In this paper, a novel paraffin-water emulsion (PCE-10) has been developed based on an 323
organic paraffin material called RT10. In order to achieve good level of stability in the 324
emulsion, the HLB method was used to obtain an optimum surfactant blend consisting of two 325
selected surfactants (Tween 60 and Brij 52). Analysis of the thermophysical properties 326
revealed the particle size of the PCE-10 sample to be 3µm with a storage heat capacity of 327
almost twice as much as that of water and with a negligible level of sub-cooling. The PCE-10 328
also achieved a good level of storage stability for 9 months and was able to withstand over 329
21
500 freeze-thaw cycles in a pumping system without any significant sign of degradation to 330
particle size and heat storage capacity. 331
However the viscosity of the PCE-10 was found to be much higher than water which could 332
contribute to high pressure drop in a pumping system. Its thermal conductivity was also 333
found to be about 30% lower than the value for water and could influence heat transfer. 334
Further enhancements of these thermophysical properties are therefore recommended. 335
Reference
336
[1] T. Hasenöhrl, "An Introduction to Phase Change Materials as Heat Storage Mediums,"
337
Sweden2009.
338
[2] W. Zhong, "Building air conditioning energy consumption and energy saving measures in
339
China," MSc Master thiese, Environment engineering, MSc Chongqing University
340
unpublished, 2004.
341
[3] C. Pollerberg and C. Dotsch, "Phase changing slurries in cooling and cold supply networks,"
342
in 10th International Symposium on District Heating and Cooling, 2006.
343
[4] Y. Xu, "Study the saving energy method for fan-coil unit system," MSc Master thiese,
344
Construction and Civil Engineering, Xi,an University of Architecture and Technology,
345
unpublished, 2005.
346
[5] P. Zhang and Z. W. Ma, "An overview of fundamental studies and applications of phase
347
change material slurries to secondary loop refrigeration and air conditioning systems,"
348
Renewable and Sustainable Energy Reviews, vol. 16, pp. 5021-5058, 2012.
349
[6] L. Huang, E. Günther, C. Doetsch, and H. Mehling, "Subcooling in PCM emulsions—Part 1:
350
Experimental," Thermochimica Acta, vol. 509, pp. 93-99, 2010.
351
[7] L. Royon and G. Guiffant, "Heat transfer in paraffin oil/water emulsion involving
352
supercooling phenomenon," Energy Conversion and Management, vol. 42, pp. 2155-2161,
353
2001.
354
[8] J. Wang, "Ruuning cost analysis for water source heat pump air conditioning," HV & AC, vol.
355
1, pp. 63-66, 2004.
356
[9] H. Xu, R. Yang, Y. Zhang, Z. Huang, J. Lin, and X. Wang, "Thermal physical properties and
357
key influence factors of phase change emulsion," Chinese Science Bulletin, vol. 50, pp.
188-358
193, 2005.
359
[10] P. Schalbart, M. Kawaji, and K. Fumoto, "Formation of tetradecane nanoemulsion by
low-360
energy emulsification methods," International Journal of Refrigeration, vol. 33, pp.
1612-361
1624, 2010.
362
[11] J. Vilasau, C. Solans, M. J. Gómez, J. Dabrio, R. Mújika-Garai, and J. Esquena, "Stability of
363
oil-in-water paraffin emulsions prepared in a mixed ionic/nonionic surfactant system,"
364
Colloids and Surfaces A: Physicochemical and Engineering Aspects, vol. 389, pp. 222-229,
365
2011.
366
[12] L. Huang, M. Petermann, and C. Doetsch, "Evaluation of paraffin/water emulsion as a phase
367
change slurry for cooling applications," Energy, vol. 34, pp. 1145-1155, 2009.
368
[13] Rubitherm Technologies GmbH. see: http://www.rubitherm.com.
369
[14] L. Huang, "Paraffin Water Phase Change Emulsion for Cold Storage and Distribution
370
Applications," PhD, Fraunhofer Institute UMSICHT, Ruhr-University Bochum, Electronic
371
publication, 2009.
372
[15] L. Huang, P. Noeres, M. Petermann, and C. Doetsch, "Experimental study on heat capacity of
373
paraffin/water phase change emulsion," Energy Conversion and Management, vol. 51, pp.
374
1264-1269, 2010.
22
[16] F. Zhao, Petrol Chemistry. Beijing: China University of Petroleum Press, 1989.
376
[17] I. Americas, The HLB system a time-saving guide to enulsifier selection. Wilmington,
377
Delaware, US: chemmunique, 1987.
378
[18] K. Zhang, R. Li, Y. Lu, and P. Shang, "HLB and Surfactant selection," Journal of 379
Shijiazhuang Vocational Technology Institute, vol. 16, pp. 20-22, 2004.
380
[19] K. Golemanov, S. Tcholakova, N. D. Denkov, and T. CGurkov, "Selection of Surfactants for
381
Stable Paraffin-in-Water Dispersions, undergoing Soild-Liquid Transition of the Dispersed
382
Particles," Langmuir, vol. 22, pp. 3560-3569, 2006.
383
[20] B. Wang, Y. Zhang, and D. Sun, "Preparation and application of wax emulsion," Shandong 384
Chemical Industry, vol. 33, pp. 14-17, 2004.
385
[21] J. Wang and T. Zhang, "The anomalous rheological properties of wax miniemusion with
386
mixed emulsifier," Journal of Shandong institute of light industry, vol. 11, pp. 12-14, 1997.
387
[22] J. Wang, "Preparation and properties of paraffin miniemulsion," Journal of Shandong institute 388
of light industry, vol. 11, pp. 24-27, 1997.
389
[23] L. L. Schramm, "Emulsion, foams and suspensions," Weinheim: Wiley-VCH Verlag Gmbh & 390
Co, 2005.
391
[24] S. D. Sharma and K. Sagara, "Latent Heat Storage Materials and Systems: A Review,"
392
International Journal of Green Energy, vol. 2, pp. 1-56, 2005.
393
[25] X. X. Zhang, Y. F. Fan, X. M. Tao, and K. L. Yick, "Crystallization and prevention of
394
supercooling of microencapsulated n-alkanes," Journal of Colloid and Interface Science, vol.
395
281, pp. 299-306, Jan 15 2005.
396
[26] Y. Zhang, Y. Jiang, and Y. Jiang, "A simple method, the T-history method, of determining
397
the heat of fusion, specific heat and thermal conductivity of phase-change materials,"
398
Measurement and Science Technology vol. 10, pp. 201–205, 1999.
399 400 401