UNIVERSITY OF HELSINKI
Department of Food and Nutrition
EKT-series 1883
DEVELOPING A REFERENCE MATERIAL FOR WHEAT
GLUTEN QUANTIFICATION
Sara Leinonen
HELSINGIN YLIOPISTO HELSINGFORS UNIVERSITET UNIVERSITY OF HELSINKI
Tiedekunta/Osasto Fakultet/Sektion – Faculty
Faculty of Agriculture and Forestry
Laitos/Institution– Department
Department of Food and Nutrition
Tekijä/Författare – Author
Leinonen, Sara
Työn nimi / Arbetets titel – Title
Developing a reference material for wheat gluten quantification
Oppiaine /Läroämne – Subject
Food Technology
Työn laji/Arbetets art – Level
Master’s thesis
Aika/Datum – Month and year
March 2019
Sivumäärä/ Sidoantal – Number of pages
71
Tiivistelmä/Referat – Abstract
The literature part of the study reviewed the recommended gluten quantification method, immunological ELISA R5. R5 is a monoclonal antibody that recognizes mainly the epitope that is abundant in especially gluten protein subgroup, ω-gliadin. The current PWG-gliadin reference material used in ELISA leads to inaccuracy of the gluten content, because it cannot represent sample materials that differ in their gliadin composition.
The aim of the experimental study was to compare the prolamin compositions of different wheat cultivars and their reactivity against R5 antibody in sandwich ELISA. The aim was to find the most suitable ratio of barley prolamin, C-hordein, to be used as a reference material for wheat gluten quantification. The ω-gliadin proportions of different cultivars were calculated from RP-HPLC-chromatograms. In order to compare the total wheat gluten reactivity of the cultivars in ELISA R5 with gliadin standard and C-hordein in different ratios (10, 20 and 30% in BSA), Km-values that measure the rate of sensitivity in the assay, were calculated.
The method to separate gliadin- and glutenin subgroups in RP-HPLC was optimized (solvent to extract gliadin and glutenin, temperature, injection volume, gradient). For cv. Crusoe the ω-, α/β-
and γ-gliadins and HMW- and LMW-glutenins were identified. The selected wheat cultivars were
categorized into four groups. The proportion of ω-gliadin in total gliadin ranged from 0.8 to 14.1% between the cultivars, whereas for PWG-gliadin this has been reported to be 7.7%. In terms of similar reactivity (Km-value) in ELISA, 20% C-hordein was found to be the most suitable reference material (Km 90) for the selected wheat cultivars (Km average 92), instead of the current gliadin standard (Km 68). The advantage of C-hordein standard is that the concentration and thus reactivity can be adjusted to match the sample materials with different prolamin profiles. Unlike with current gliadin reference material, it can be used without any conversion factors, which improves the method accuracy.
Avainsanat – Nyckelord – Keywords
ELISA, R5, C-hordein, gliadin
Säilytyspaikka – Förvaringställe – Where deposited
HELDA - The Digital Repository of University of Helsinki
Muita tietoja – Övriga uppgifter – Additional information
Tekijä/Författare – Author
Leinonen, Sara
Työn nimi / Arbetets titel – Title
Referenssimateriaalin kehittäminen vehnägluteenin määrittämiseen
Oppiaine /Läroämne – Subject
Elintarviketeknologia
Työn laji/Arbetets art – Level
Maisterintutkielma
Aika/Datum – Month and year
Maaliskuu 2019
Sivumäärä/ Sidoantal – Number of pages
71
Tiivistelmä/Referat – Abstract
Kirjallisuuskatsauksessa käsiteltiin immunologista ELISA R5-metodia, jota käytetään gluteenin määrittämiseen elintarvikkeissa. R5 on monoklonaalinen vasta-aine, joka tunnistaa erityisen hyvin gluteenin fraktion, ω-gliadiinin. ELISA:n nykyinen PWG-gliadiini-referenssimateriaali antaa epätarkkoja tuloksia näytteille, jotka ovat gliadiinikoostumukseltaan poikkeavia.
Kokeellisen osuuden tavoitteena oli vertailla tutkimukseen valittujen vehnälajikkeiden prolamiinikoostumuksia sekä reaktiivisuutta ELISA:ssa. Tavoitteena oli tutkia, millä suhteella ohran prolamiinista, C-hordeiinista, ja BSA:sta saataisiin valituille vehnälajikkeille optimaalisin referenssimateriaali. Tutkimuksen vehnälajikkeiden ω-gliadiinipitoisuudet kokonaisgliadiinista laskettiin HPLC-kromatogrammeista. Lajikkeiden kokonaisgluteenin reaktiivisuutta ELISA R5:ssa vertailtiin gliadiinistandardiin ja C-hordeiinin eri pitoisuuksiin (10, 20 ja 30% BSA:ssa) laskemalla näytteen reaktiivisuutta mittaavat Km-arvot.
Metodi eri gliadiini- ja gluteniiniryhmien erottamiseen RP-HPLC:ssä optimoitiin (liuos gliadiinin ja gluteniinin uuttoon, lämpötila, injektiomäärä, liuottimen pitoisuus ajoliuoksessa). Lajikkeen Crusoe
ω-, α/β- ja γ-gliadiinit sekä HMW- ja LMW-gluteniinit identifioitiin. Valitut vehnälajikkeet luokiteltiin neljään ryhmään niiden RP-HPLC-gliadiiniprofiilien mukaisesti. Lajikkeiden ω -gliadiinipitoisuudet vaihtelivat 0.8-14.1 % kokonaisgliadiinista, kun taas PWG-gliadiinille tämän on ilmoitettu olevan 7.7%. Samankaltaisten Km-arvojen perusteella 20% C-hordeiini (Km 90) oli valituille vehnälajikkeille (Km keskiarvo 92) sopivin referenssimateriaali nykyisen gliadiinistandardin (Km 68) sijasta. C-hordeiinin käyttöä referenssimateriaalina puoltaa se, että sen pitoisuutta ja täten reaktiivisuutta ELISA:ssa on mahdollista säätää vastaamaan näytemateriaalia ja täten saavuttaa tarkempia tuloksia gluteenipitoisuudelle kuin nykyisellä gliadiinistandardilla. Toisin kuin gliadiinistandardi, C-hordeiini ei tarvitse kerrointa gluteenipitoisuuden laskemiseen.
Avainsanat – Nyckelord – Keywords
ELISA, R5, C-hordeiini, gliadiini
Säilytyspaikka – Förvaringställe – Where deposited
HELDA – Helsingin yliopiston digitaalinen arkisto
Muita tietoja – Övriga uppgifter – Additional information
The experimental part of this Master’s thesis was conducted in the Department of Food and Nutrition in University of Helsinki between February and June 2017. The planning of the project started already in the end of year 2016 and the writing of the thesis was finalized in March 2019. The supervisors were postdoctoral researcher Xin Huang and university lecturer Tuula Sontag-Strohm.
It took far more time for me to finish this thesis than I had planned in the beginning. However, while writing this I also finished some courses, got a job and gave birth. In addition to learning so much about gluten analytics, I also have learned to multitask and schedule my days in order to get everything done. It can be concluded that the past two years have been somewhat busy.
I wish to thank my supervisors for their help throughout this project. A big thank you to Tuula for encouragement and advice. Thank you Xin for all your expertise and patience to answer all my questions. I am also grateful for my family and friends for helping me rest and for offering babysitting help. Last but certainly not least, thank you Tuomas for always believing in me and supporting me, and Aatos for helping me to remember what is important.
Sara Leinonen Helsinki, 29.3.2019
ACN acetonitrile
DTT dithiothreitol
ELISA enzyme-linked immunosorbent assay
HLA human leukocyte antigen
HMW high molecular weight
HMW-GS high molecular weight glutenin subunit
HRP horse radish peroxidase
LMW low molecular weight
LMW-GS low molecular weight subunit
MMW medium molecular weight
PWG Prolamin Working Group
RP-HPLC reversed-phase high-performance liquid chromatography SDS-PAGE sodium dodecyl sulphate-polyacryl amide gel electrophoresis
ABSTRACTS PREFACE LIST OF ABBREVIATIONS 1 INTRODUCTION ... 8 2 LITERATURE REVIEW ... 10 2.1 Coeliac disease ... 10
2.2 Gluten classification and antibody epitopes ... 11
2.2.1 Cereal prolamins ... 11
2.2.2 Gliadins ... 12
2.2.3 Glutenins ... 14
2.2.4 Wheat prolamin antibody epitopes ... 16
2.3 Gluten detection in gluten-free foods ... 17
2.3.1 Extraction ... 17
2.3.2 The sandwich and competitive ELISA ... 18
2.3.3 Antibodies ... 20
2.3.4 PWG gliadin as reference material ... 21
2.4 The challenges in gluten detection ... 22
2.4.1 Assay target and antibody specificity ... 22
2.4.2 Reference material ... 23
2.4.3 Conversion factor of 2 ... 26
3 AIMS OF THE STUDY ... 27
4 MATERIALS AND METHODS ... 28
4.1 Materials ... 28
4.2 Workflow ... 29
4.3 Extraction ... 30
4.3.1 Gliadin and glutenin ... 30
4.3.2 Whole gluten extraction and dialysis ... 30
4.4 Total protein content ... 31
4.5 RP-HPLC method establishment ... 31
4.6 Prolamin composition by RP-HPLC and SDS-PAGE ... 32
4.7.1 RP-HPLC fractionation of gliadin and glutenin subgroups ... 34
4.7.2 Rereducing, alkylation and SDS-PAGE of the collected prolamin fractions ... 35
4.8 C-hordein as a reference material in sandwich ELISA ... 35
5 RESULTS ... 37
5.1 RP-HPLC method ... 37
5.1.1 Solvent ... 37
5.1.2 Temperature ... 38
5.1.3 Glutenin injection volume ... 39
5.1.4 Gradient ... 40
5.2 Prolamin compositions of different wheat cultivars ... 42
5.2.1 HPLC gliadin profiles ... 42
5.2.2 ω-gliadin proportions in total gliadin ... 43
5.2.3 The use of reducing agent in SDS-PAGE ... 44
5.2.4 SDS-PAGE of gliadin and glutenin extracts ... 45
5.2.5 SDS PAGE of whole gluten ... 46
5.3 Characterization of prolamin groups by RP-HPLC fractionation and SDS-PAGE ... 47
5.4 C-hordein as reference material for wheat gluten quantification ... 51
5.4.1 Protein contents of the extracted wheat gluten samples by Dumas ... 51
5.4.2 Wheat prolamin reactivity against R5 antibody ... 51
6 DISCUSSION ... 54
6.1 Method optimization ... 54
6.2 Prolamin compositions of the wheat cultivars ... 56
6.3 C-hordein as reference material for wheat gluten quantification ... 58
6.4 Future research ... 60
7 CONCLUSIONS ... 62
REFERENCES ... 64
APPENDICES ... 69
Appendix 1. Reverse-phase liquid chromatograms of glutenin extracts from selected wheat cultivars ... 69
1 INTRODUCTION
In order that it would be easier for persons intolerant to gluten follow a safe diet, Codex Alimentarius Commission has defined ”standard for special dietary use for persons intolerant to gluten”. According to this standard foods can be labeled gluten-free if the gluten level does not exceed 20 mg/kg in total, based on the food as distributed to the consumer (CAC 2008). CAC recommends enzyme-linked immunosorbent assay (ELISA) R5 method to be used in gluten quantification.
The ELISA R5 sandwich method is able to recognize coeliac-toxic epitope, QQPFP, which occurs in α/β-, γ- and ω-gliadins of wheat, hordeins of barley and secalins of rye (Valdés et al. 2003). Ideally R5 detects gliadins from wheat gluten, and gliadin content of gluten is theoretically taken as 50 %, thus a factor of two is used to calculate the final gluten content (CAC 2008). At the end of the method a value of gluten, expressed in mg/kg or ppm, is obtained (Diaz-Amigo and Popping 2013). This value is the basis for the decision if a product can be labeled gluten-free.
R5 is a monoclonal antibody that recognizes mainly the epitope QQPFP, which occurs in the repetitive domains of prolamins (Osman et al. 2001). R5 recognizes also the epitopes LQPFP,
GLPYP, QQSFP, QQTFP, PQPFPF, QQPYP and PQPFP, but to a weaker degree. At the moment the most recommended reference material for ELISA R5 is a gliadin from Prolamin Working Group (PWG) (van Eckert et al. 2006). PWG-gliadin has been extracted from a mixture of European wheat cultivars. The prolamin working group (PWG) gliadin standard is not reproducible and it is not accepted as a certified reference material in the Institute of Reference Material and Measurements of the European Commission due to its high glutenin content (Working Group on Prolamin Analysis and Toxicity 2016).
Currently there can be found over 20 different ELISA kits for gluten analysis (Scherf and Poms 2016). Despite an improvement of extraction methods and the development of new specific antibodies, many challenges still remain with ELISAs. The food matrix and processing history influences and there is variability of results between different ELISA kits. In a study of Ellis et al. (2016) it was found that many products marketed as gluten-free contained considerable quantities of gluten, even those based on naturally gluten-free ingredients only. Also the use of the factor two in the end of the method is problematic, since it is only based on the assumption that the ratio of
gliadin and glutenin is 1 (CAC 2008). R5-, G12- and Skerritt-antibodies are used mainly to analyse wheat prolamins (gliadin), but there is not enough knowledge about their reactivity against wheat glutelins (glutenin) (Diaz-Amigo and Popping 2013).
Based on scientific evidence, new approved reference materials are needed for gluten quantification to ensure the reliability of the analytical methods and thus improve food safety of the gluten-free products. The underestimation of gluten contents represents a serious health risk for gluten intolerant persons and the overestimation unnecessarily limits the availability of gluten-free products (Lexhaller et al. 2016).
In a previous study by Huang et al. (2017) the concentration of barley prolamin (hordein) in gluten
-free products was overestimated 1.8-2.5 times by the R5 ELISA method when calibrated against the
wheat gliadin standard. One reason for the overestimation may be the different composition of gliadin reference material from that of hordeins.Estimates in the correct range were obtained when the standard was 40 % C-hordein. Based on this study, C-hordein could be possible, more accurate reference material also for wheat gluten quantification. C-hordein is a better reference material than PWG-gliadin, because its repetitive sequences correspond to R5 epitopes (Huang et al. 2017). In addition, the use of C-hordein as calibrant has the possibility of adjustment by the percentage of C
-hordein.
The aim of this study was to compare the prolamin compositions of different wheat cultivars and their reactivity against R5 antibody in sandwich ELISA. The aim was to isolate total gluten and to find the most suitable ratio of C-hordein to be used as a reference material for wheat gluten quantification of the selected cultivars instead of current gliadin standard.
2 LITERATURE REVIEW
2.1 Coeliac disease
Coeliac disease is a gluten-sensitive enteropathy that occurs in genetically predisposed persons (Sollid 2002; Ludvigsson et al. 2013). Coeliac disease leads to the destruction of the microscopic projections of the small intestine that are called villi. The disease is triggered by the ingestion of the gluten proteins contained in wheat, barley and rye (Kagnoff 2007). Oats can be tolerated by most gluten intolerant individuals (Haboubi et al. 2006). Epidemiologic studies have shown that coeliac disease affects almost 1% of the world’s population (Lee et al. 2006). It is diagnosed worldwide, also in developing countries. Treatment with a strict gluten-free diet is the usual therapy for coeliac disease patients (Morón et al. 2008). However, cereal proteins are widely used additives in most sectors of the prepared-food industry, making the avoidance of gluten difficult.
Disease pathogenesis involves complex interactions among environmental, genetic and immunological factors, which make it difficult to identify the underlying mechanisms of coeliac disease development (Sollid 2002; Kagnoff 2007). The genetic factor that affect coeliac disease is the expression of human leukocyte antigens HLA-DQ2 and HLA-DQ8 (Sollid et al. 1989). More than 90% of coeliac disease patients express the HLA-DQ2 molecule, whereas DQ8 is carried by most of the remaining patients (Bergseng et al. 2008). DQ2- and DQ8-mediated presentation of gluten peptides to CD4+T cells is central event in the pathogenesis of the disease. HLA class II molecules, like DQ2.5 and DQ8, are receptors expressed on the surface of antigen-presenting cells that bind peptide fragments to CD4+T cells (Sollid 2002).
The toxic components of wheat gluten belong to a family closely related proline- and glutamine-rich proteins called gliadins (Shan et al. 2002). It has been shown by in vitro and in vivo studies in rats and humans that a 33-mer peptide from α-gliadin is stable toward breakdown by all gastric, pancreatic, and intestinal microvilli enzymes. This peptide has been identified as the primary initiator of the inflammatory response to gluten in persons with coeliac disease. In a study by Shan et al. (2002) homologs of the 33-mer peptide LQLQPF(PQPQLPY)3PQPQPF were found in all
food grains that are toxic to coeliac disease patients (except oats), but they were absent in all nontoxic food grains. The peptide reacted with tissue transglutaminase, which is the major
autoantigen in coeliac disease, with substantially greater selectivity than known natural substrates of this enzyme. It was a potent inducer of gut-derived human T cell lines from 14 of 14 coeliac disease patients. The 33-mer peptide could be detoxified in in vitro and in vivo assays by exposure to a bacterial prolyl endopeptidase (Shan et al. 2002). This could be a strategy for oral peptidase supplement therapy for coeliac disease.
2.2 Gluten classification and antibody epitopes
2.2.1 Cereal prolamins
Prolamins are plant storage proteins that are insoluble in water or aqueous salt solutions in their native state (Shewry et al. 1999). Prolamins of wheat are called gliadins and glutenins, of rye secalins, of barley hordeins and of oat avenins (Shewry and Tatham 1999). Wheat, rye and barley are classified in the same tribe (the Triticeae), whereas oat is classified in the tribe Aveneae.
Prolamins can be classified into various groups and sub-groups based on their structural relationships. The classification of prolamins from wheat, barley and rye is shown in table 1. There are three different groups of prolamins in Triticeae; the sulphur-rich, sulphur-poor and high molecular weight (HMW) prolamins (Shewry and Tatham 1999). Monomeric prolamins are soluble in aqueous alcohol solutions in their native state and polymeric prolamins are alcohol-soluble when reduced by reductive agents or hydrolysed by enzymes (Shewry et al. 1999). Monomeric and polymeric prolamins have intrachain disulphide bonds, but in addition polymeric prolamins have interchain disulphide bonds (Wieser 2007). For wheat, prolamins form the major storage protein fraction (Shewry and Tatham 1999).
Table 1. Classification of prolamins proteins from wheat, barley and rye.
HMW prolamins Sulphur-rich prolamins Sulphur-poor prolamins Wheat HMW-glutenin subunits
(x-types)
HMW-glutenin subunits (y-types)
γ-gliadins α/ β-gliadins LMW-glutenins
ω-gliadins
Barley D-hordeins γ-hordeins
B-hordeins
C-hordeins
2.2.2 Gliadins
Wheat gluten consists of gliadin and glutenin fractions which are present in approximately equal amounts (Shewry 2003). The characterization of gliadins and glutenins is shown in table 2. Gliadins are mainly monomeric proteins with molecular weights (MW) varying from 28000 to 55000 (Wieser 2007). Based on their amino acid sequences, amino acid composition and molecular
weight, gliadin components can be classified in three groups: ω-, α / β- and γ-gliadins. Initially the
α- and β-gliadins were classified in the same group on the basis of mobility at low pH in gel electrophoresis (Wieser 1996). Later studies have shown that the electrophoretic mobility does not always reflect the protein relationships and as a matter of fact α- and β-gliadins fall into one group. The separation of gliadin fraction into more than hundred components is possible due to methods such as two-dimensional electrophoresis and reversed-phase high-performance liquid chromatography (RP-HPLC). Based on the analysis of complete or partial amino acid sequences, amino acid compositions and molecular weights, gliadins can be grouped into four different types:
ω5-, ω1,2-, α / β- and γ-gliadins.
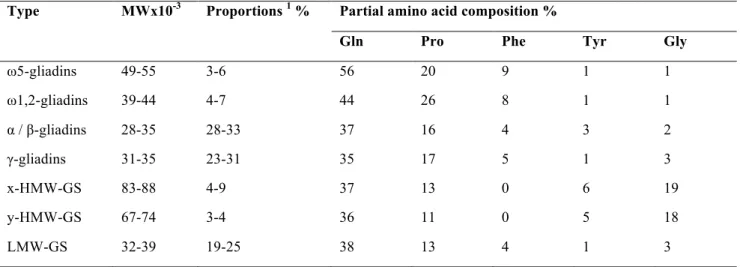
Table 2. Characterization of gluten protein types. Adapted from Wieser (2007).
Type MWx10-3 Proportions 1 % Partial amino acid composition %
Gln Pro Phe Tyr Gly
ω5-gliadins 49-55 3-6 56 20 9 1 1 ω1,2-gliadins 39-44 4-7 44 26 8 1 1 α / β-gliadins 28-35 28-33 37 16 4 3 2 γ-gliadins 31-35 23-31 35 17 5 1 3 x-HMW-GS 83-88 4-9 37 13 0 6 19 y-HMW-GS 67-74 3-4 36 11 0 5 18 LMW-GS 32-39 19-25 38 13 4 1 3
1According to total gluten proteins GS = glutenin subunit
Types ω5- and ω1,2-, as well as α/β- ja γ-gliadins are related (Shewry and Tatham 1999). Within each type, structural differences are small and concern only substitution, deletion and insertion of single amino acid residues (Wieser, 1996). ω-gliadins contain mostly glutamine, proline and phenylalanine, which together account for for around 80 % of the total composition (Shewry et al. 1986; Wieser 1996). ω-gliadins are stabilized by strong hydrophobic interactions (Tatham and
Shewry 1985). In comparison to ω1,2-gliadins, ω5-gliadins have bigger molecular weight (~50000) and higher quantity of glutamine and phenylalanine (Wieser 1996). Most ω-gliadins lack cysteine, thus there is no possibility to form disulphide crosslinks. They consist almost entirely of repetitive sequences that are rich in glutamine and proline, for example PQQPFPQQ. ω-gliadins are rich in β -turns, with no detectable α-helix or β-sheet (Tatham and Shewry 1985).
Molecular weights of α/β- and γ-gliadins are between 28000 and 35000 (Table 2). Proportions of glutamine and proline are much lower in comparison to ω-gliadins. They differ significantly in the contents of some amino acids, such as tyrosine. Whilst the ω-gliadins are stabilized by strong hydrophobic interactions, the main stabilizing forces for the α/β- and γ-gliadins are covalent disulphide bonds and non-covalent hydrogen bonds (Tatham and Shewry 1985).
The repetitive units of α/β-gliadins are dodecapeptides such as QPQPFPPQQPYP and they are usually repeated five times and modified by the substitution of single residues (Wieser 1996). For γ -gliadins, the typical unit is QPQQPFP. It is repeated up to 16 times and some additional residues can be found within. The N-terminal domain is 40-50% of total proteins and consists mostly of repetitive sequences rich in glutamine, proline, phenylalanine and tyrosine and is unique for each type (sequence sections I and II, Figure 1). The N-terminal domains of α/β- and γ-gliadins are characterized by β-turn conformation, that is similar to ω-gliadins (Tatham and Shewry 1985). Within the C-terminal domains (sequence sections III-V, Figure 1), α/β- and γ-gliadins are homologous. With some exceptions, α/β-gliadins contain six cysteines in the C-terminal domain, while γ-gliadins contain eight of those (Grosch and Wieser1999). The non-repetitive C-terminal domain contains considerable proportions of α-helix and β-sheet structures and have less glutamine and proline in comparison to the N-terminal domain (Tatham and Shewry 1985). The helices have high stability, which is probably due to extensive hydrogen bonding, although disulphide bonds are also important.
Figure 1. Disulphide structures of α/β- and γ-gliadins, and LMW- and HMW-glutenin subunits (x and y). Adapted from Grosch and Wieser (1999).
Though the distribution of total gliadins among the different types is dependent on wheat variety and growing conditions (soil, climate and fertilization), it can be generalized that α/β- and γ-gliadins are more abundant and the ω-gliadins occur in much lower proportions (Wieser and Kieffer 2001).
A portion of gliadins have an odd number of cysteines due to mutations and are linked together or to glutenins (Huebner and Bietz 1993). They appear either in alcohol-soluble oligomers in the gliadin fraction or in the alcohol-soluble glutenin polymers. This oligomeric fraction has been called HMW-gliadin, aggregated gliadin or ethanol-soluble glutenin (ESG). It contains α/β- and γ -gliadins, and LMW-subunits linked by interchain disulphide bonds. Their molecular weight is around 100000-500000. After reduction, ESG subunits elute during RP-HPLC in the same area as monomeric gliadins.
2.2.3 Glutenins
Before, only gliadin was classified as wheat prolamin (Shewry and Tatham 1999). According to the Osborne protein solubility classification, prolamins are a fraction of gluten, which are soluble in aqueous ethanol and insoluble, or nearly insoluble in water. They are readily soluble in acids or alkalis. Now it is accepted that the major wheat proteins defined as glutenins by Osborne, are in fact prolamins too, although they are insoluble in ethanol in their natural state. This is due to the fact,
that they are present in high molecular mass polymers stabilized by inter-chain disulphide bonds in addition to the intrachain bonds (Shewry 2003; Shewry and Tatham 1999). Once these bonds are reduced the subunits become soluble in ethanol.
Glutenins are present in the grain as aggregates stabilised by covalent disulphide bonds (Shewry et al. 1986). When the disulphide bonds of glutenins are reduced, the resulting glutenin subunits show a solubility in aqueous alcohols similar to gliadins (Wieser and Kieffer 2001). Likewise to gliadins, glutenins contain high proportions of proline and glutamine (Shewry et al. 1986; Shewry and Tatham 1999). Glutenins can be classified into two groups: the high molecular weight glutenin subunits (HMW-GS) and low molecular weight glutenin subunits (LMW-GS). LMW-glutenin is the predominant protein type of gluten and their proportion is ~20% of total gluten proteins, whereas HMW glutenin subunits are minor components within the gluten protein family (~10%) (Wieser and Kieffer 2001; Wieser 2007). LMW-glutenins are similar to α/β-gliadins and γ-gliadins for their molecular weight (MW) and amino acid composition (Table 2). HMW-glutenins can be classified in x- and y-types based on their molecular weight (Table 2). X-HMW-glutenins have a molecular weight of 83000-88000, whereas for y-HMW-glutenins it is between 67000 and 74000 (Wieser 1996). Dough properties are strongly affected by the quantities of HMW-GS and the contribution of the x-type to dough properties has been found to be more important than the y-type (Wieser and Kieffer 2001).
Similar to α/β- and γ-gliadins, LMW-GS contain two different domains: The N-terminal domain consists of glutamine- and proline-rich repetitive units, such as QQQPPFS (sequence section I, Figure 1). The other, C-terminal domain is homologous to that of α/β- and γ-gliadins within sections III and V (Figure 1). LMW-GS contain eight cysteines (Grosch and Wieser 1999). Six residues are in positions homologous to α/β- and γ-gliadins, thus they are proposed to be linked by intrachain disulphide bonds. Two additional cysteine residues that are unique to LMW-GS are located in sections I and IV (Figure 1). They are not able to form intrachain bonds, whereas interchain disulphide bonds with cysteines of different gluten proteins are generated.
HMW-GS consist of three structural domains (Figure 1): a non-repetitive N-terminal domain (A) comprising about 80-105 residues, a repetitive central domain (B) comprising about 480-700 residues and a non-repetitive C-terminal domain (C) comprising 42 residues (Shewry et al. 1992). Domain B contains repetitive hexapeptides (QQPGQG) as a backbone with some inserted
hexapeptides, such as YYPTSP, and tripeptides, such as QQP or QPG. Studies indicate the presence of β-reverse turns within the domain B (Shewry et al. 1992). These were predicted to be overlapping and form a loose spiral which was assumed to contribute to the elasticity of gluten. The domains A and C are proposed to have globular structures containing α-helices.
The domains A and C have most or all of cysteines: The x-type HMW-GS (except the subunit Dx5) has three cysteines in domain A and one in domain C and the y-type has five cysteines in domain A and one cysteine in each of domains B and C (Shewry and Tatham 1997; Shewry et al. 1992). The adjacent cysteines of domain A are connected to the corresponding residue of another y-type with interchain bonds and the cysteine of domain B is linked to a cysteine of LMW-GS. Two residues of domain A are linked by an intrachain and the other two by interchain disulphide bonds (Shewry et al. 1992).
2.2.4 Wheat prolamin antibody epitopes
Antibodies are directed against epitopes that are specific determinants of antigens (Osman et al. 2001). Knowledge of the epitope recognized by antibodies is an important basis for their proper use in immunological assays. The reactivity of antibodies R5 and G12 was investigated against gluten protein types. Also the reactivity of antibody Skerritt was investigated, but none of its epitopes were found from the gluten proteins. Based on this table, ω-gliadin had the most of the reactive epitopes (Table 3). Glutenins did not include the epitopes presented in here.
Table 3. Reactivity of R5 and G12 antibodies to gluten protein types. Uniprot accession is below each protein. Antibody Epitope HMW-GS (B1B520) LMW-GS (B2Y2R6) ω-gliadin (A0A060N0S6) α-gliadin (K7WV47) γ-gliadin (R9XUS6) R5 QQPFP - - 15 1 5 LQPFP - - - - - QLPYP - - - 2 - QLPTF - - - - - QQSFP - - 2 - - QQTFP - - - - 1 PQPFP - - - 1 - QQPYP - - 1 1 - G12 QPQLPY - - - 1 - QPQLPF - - - - - QPQLPL - - - - - QPQQPY - - 1 - - QPQQPF - - 10 - 6
2.3 Gluten detection in gluten-free foods
The gluten quantification method in foods and ingredients shall be based on an immunologic method or other method providing at least equal sensitivity and specificity (CAC 2008). The antibody used in the method should react with the specific cereal protein fractions that are toxic for persons intolerant to gluten and they should not cross-react with other cereal proteins or other constituents of the foods or ingredients. Methods used should be validated and calibrated against a certified reference material and the detection limit of the method should be 10 mg gluten/kg or below. Codex Alimentarius Commission recommends enzyme-linked immunoassay (ELISA) R5 Mendez method for gluten quantification in foods and ingredients.
2.3.1 Extraction
In cereal science the sample is usually wheat flour, dough or a finished product, and in almost all cases the sample has to be dried and ground before extraction (Hamer 2003). Drying is a necessary step to ensure the stability of the protein during storage, but it should not influence the protein.
Another issue is the particle size of the sample to be extracted, since particle size is related to the surface area and hence can affect the extraction. As a rule of thumb, the sample should be milled to pass a 0.5 mm sieve. Finally, a point of concern is related to the lipid content of the sample. For example, the high fat content of oats can cause problems in many wet fractionation procedures. For this reason, the samples are often defatted before the extraction procedure.
The need for improved sample extraction methods has led to the development of new extraction solutions containing reducing agents, such as 2-mercaptoethanol, which in combination with alcohol extraction are capable of dissolving gluten aggregates (Valdés et al 2003; Mena et al 2012; Kanerva et al 2011). The cocktail solution is recommended as the extraction solution for heated foods and it is a part of the R5-ELISA kit (García et al. 2005).After the extraction procedure with the cocktail solution the sample prolamins can still react with the antibody (Valdés et al. 2003).
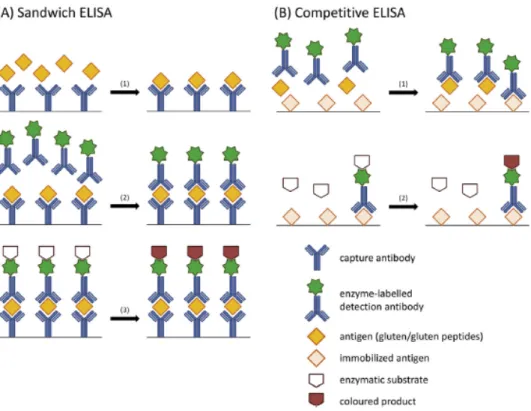
2.3.2 The sandwich and competitive ELISA
The determination of prolamins by enzyme-linked immunosorbent assay (ELISA) and the conversion of the resulting concentration to gluten content in food is a method used by many laboratories (Diaz-Amigo and Popping 2013). There are two ELISA formats, sandwich and competitive. The principles of the different formats are presented in figure 2. The sandwich method is based on two antibodies (Valdés et al. 2003). The first one (capture antibody) is bound to the bottoms of the microplate wells, in known quantity. Then the antigen-containing sample is added and antigen/antibody complex is formed (step 1). Next, excess antigen is removed by washing. The second antibody labelled with an indicator enzyme (detecting antibody) is added and it detects the antigens attached to the capture antibody. For example horse radish peroxidase or alkaline phosphatase are commonly used as indicator enzymes. The antigen is “sandwiched” between the capture antibody and the detecting antibody (step 2). The unbound detecting antibodies are washed out and enzymatic substrate is added (step 3). The enzyme induces a colour reaction, which can be measured by spectrophotometric methods. The sample protein must be large enough for two antibodies to attach to it at the same time and this is why sandwich ELISA cannot be used for hydrolysed gluten samples.
Figure 2. The principles of (a) sandwich ELISA and (b) competitive ELISA. Adapted from Scherf and Poms (2016).
A commercial competitive ELISA R5 was developed to determine gluten content in hydrolysed products, such as beer (Bermudo Redondo et al. 2005). The peptide profile of hydrolysed gluten proteins depends on the type of hydrolysis, extent of hydrolysis and enzyme cleavage points (Diaz-Amigo and Popping 2013). The difficulties of converting hydrolysed peptide concentration in true gluten content make the quantification of gluten challenging. Competitive ELISA is more suitable for the detection of hydrolysed gluten because it requires only one antibody binding epitope instead of two (Bermudo Redondo et al. 2005). This way smaller peptide fragments can be detected.
In the competitive ELISA only one antibody is used and the method is based on the competition between sample proteins and standard proteins (Haas-Lauterbach et al. 2012). In figure 2b is shown the method. Known quantity of antigen is applied on the surface of the microtiter plate. The antigen-containing sample and an enzyme-labelled antibody are applied at the same time to the well. During incubation, the immobilized and free antigens compete for the binding sites (step 1). After washing, enzymatic substrate is added to form a coloured product (step 2). Because of only one antibody, competitive ELISA is also suitable for detecting small, hydrolysed proteins and peptides. However, the specificity is not as good in comparison to the sandwich method, since nonspecific binding is more likely when only one binding site is needed for detection. In the competitive method, the enzyme can be conjugated with the antibody or with the standard protein.
In both of the ELISAs, a calibration curve with gluten peptide is used to calculate the antigen concentration in the sample extract. To comply with the units established with Codex Standard 118, analytical methods specific to prolamins require a conversion factor of two to convert prolamin content into gluten concentration (Diaz-Amigo and Popping 2013). The factor is set to two, because gliadin is considered to be half of the gluten proteins the remaining half being the glutenin fraction.
2.3.3 Antibodies
The currently most widely accepted method for gluten quantification is ELISA based on the R5
antibody (CAC 2008). Among the antibodies from commercial kits, R5 reacts stronger against
gliadins (Sharma 2012). R5 is a monoclonal antibody that has been raised against rye extracts (Sorell et al. 1998). ELISA R5 was presented as a new option for gluten quantification in the late 1990s (Diaz-Amigo and Popping 2013). R5 specifically detects as core epitope the sequence that can be found in gliadin peptides with known toxicity for people suffering from gluten intolerance: QQPFP, QQQFP, LQPFP and QLPFP are the strongest target epitopes and they are also present in
α/β-, and γ-gliadins (Kahlenberg et al. 2006). Some of the R5 epitopes can be also found from LMW glutenins, which are related to α/β- and γ-gliadins in molecular weight and in amino acid composition (Wieser 2007).
G12 is a monoclonal antibody that has been raised against the synthetic 33-mer toxic α-gliadin peptide, QPQLPY being the most reactive epitope (Morón et al. 2008). This antibody binds prolamins from wheat, rye, barley and some oat cultivars. With G12, there is an opportunity to also protect the small percentage of the population sensitive to oats. The Skerritt antibody is the oldest of the antibodies mentioned (Diaz-Amigo and Popping 2013). It was used in some commercial ELISAs until some disadvantages became known and new developments led to the use of other antibodies and analytical approaches. Skerritt has been raised against ω-gliadin, but it also shows
high reactivity with the glutenin fraction (Sharma 2012). The most recently developed monoclonal
antibody is α20, which was generated against the coeliac disease-immunogenic peptide
PFRPQQPYPQP from α-gliadins (Mitea et al. 2008). Gliadins, secalins and hordeins are recognized by the α20, but there is limited evidence on other reactivities. There are also ELISA kits that use polyclonal antibodies (Morinaga) (Diaz-Amigo and Popping 2013). Antibodies in this kit are raised
against a commercial gliadin preparation. There is not much information about this kit in the scientific literature, but the assay is mostly specific to gliadins (Sharma 2012).
2.3.4 PWG gliadin as reference material
At the moment the most recommended reference material for prolamin quantification is gliadin from Prolamin Working Group (PWG) (Lexhaller et al. 2016). It is a selection of 28 European wheat cultivars, with 86,4 % gliadin content, including 41,7 % α-gliadin, 47 % γ-gliadin and 11,3 %
ω-gliadin (Figure 3). The cultivars were selected from the three main European wheat-producing countries, France, UK and Germany. One kilogram of kernels from each cultivar were mixed, milled and the resulting white flour was defatted and vacuum dried. Albumins and globulins were eliminated by extraction using NaCl solution. Gliadins were extracted with 60 % ethanol. The resulting gliadin extracts were concentrated, desalted by ultrafiltration, freeze-dried and homogenized. The reference gliadin was sent to 16 different laboratories for further investigations. The results showed that the gliadin composition of the source flour and the reference gliadin matched perfectly, thus no major gliadin components had been lost during the isolation procedure. The results also showed that the reference gliadin had good immunochemical sensitivity with different gliadin antibodies in enzyme immunoassays. Since it has high protein and gliadin content, good solubility, homogeneity, stability and representative character, the gliadin reference material is regarded as a suitable universal reference material.
Figure 3. RP-HPLC of the PWG-gliadin (250 µg/100 µl) on C8-silica gel, peaksfor the gliadin types are indicated. Adapted from van Eckert et al (2006).
2.4 The challenges in gluten detection
In the absence of other solutions, the ELISA R5 and the PWG gliadin were adopted as reference method and gliadin material for gluten quantification with no opposition (Diaz-Amigo and Popping 2013). The performance of new ELISA developments is compared to the R5 method. It should be taken into consideration that an assay validated in multiple multilaboratory studies and always under the same conditions does not guarantee a good real-life performance, where analytical conditions, such as food matrices and gluten sources, are variable. The measuring of gluten content is particularly challenging when the source of gluten is unknown (Lexhaller et al. 2016).
2.4.1 Assay target and antibody specificity
In a study by Lexhaller et al. (2016) the specificity and sensitivity of three monoclonal (R5, G12 and Skerritt) and two polyclonal antibodies against prolamin and glutelin fractions from wheat, rye and barley were compared. Reversed-phase high-performance liquid chromatography (RP-HPLC) was used as an independent reference method for the quantification of protein contents in the gluten fractions. The estimated prolamin, glutelin and gluten contents quantified by RP-HPLC versus those by five different ELISA kits are listed in table 4. Calculation factor of 2 is used for R5 and pAb1 in order to obtain the whole gluten content, since these antibodies are believed to recognize only gliadins (Lexhaller et al. 2016). For pAb2, calculation factor of 0.85 is recommended since it uses wheat proteins for calibration and with the calculation factor, gluten content is obtained. The results show that there is variation in the estimation of the prolamin content between the methods.
Table 4. Estimated prolamin, glutelin and gluten contents quantified by RP-HPLC versus those by ELISA. PWG-gliadin was used as a reference material. Adapted and modified from Lexhaller et al. (2016).
Method Prolamin content (mg / kg) Glutelin content (mg / kg) Gluten content as sum of prolamin and glutelin contents (mg / kg) Gluten content as sum considering the recommended calculation factors (mg / kg) RP-HPLC 10 10 20 20a) / 20b) / 17c) R5 14 1 15 28a) G12 16 2 18 18b) Skerritt 13 93 106 106b) pAb1 11 2 13 22a) pAb2 21 13 34 29c)
a) Calculation factor for R5 and pAb1 = 2 x prolamin content b) No additional calculation factor
c) Calculation factor for pAb2 = 0.85 x sum
The specificity of monoclonal antibodies R5, Skerritt, G12 and α-20 is evaluated mainly against wheat gliadins, although gliadin is not the only target of antibodies currently used by some assays. (Diaz-Amigo and Popping 2013). This induces a high degree of uncertainty and potential assay inaccuracy. It also has to be taken into account that when the results of newly developed assays differ from the results of ELISA R5, it may not necessarily indicate that they are unreliable. With all the unknowns linked to ELISA methods, it is difficult to say which assay is more accurate. There are also unanswered questions of what is the fragment size recognized by the antibodies that still triggers an effect in coeliac patients (Diaz-Amigo and Popping 2013). Codex Standard states “the antibody used should react with the cereal protein fractions that are toxic for persons intolerant to gluten”. It is also possible that antibodies in competitive assays also recognize fragments that do not trigger coeliac disease but still contribute to the ELISA signal, preventing the labeling of some products as gluten-free.
2.4.2 Reference material
Wheat as reference material is not necessarily suitable to determine gluten from rye or barley. There is evidence that for example for barley, R5 antibody cannot provide accurate results (Huang et al. 2017, Kanerva et al. 2006, Tanner et al. 2013). In a study by Huang et al. (2017) the prolamin
concentrations of gluten-free oat flour spiked with barley flour were determined by HPLC, ELISA R5 with gliadin standard and ELISA R5 sandwich with 40% C-hordein standard (Figure 4). The concentration of barley prolamin, hordein, in gluten-free products was overestimated 1.8-2.5 times by the R5 ELISA method when calibrated against the wheat gliadin standard. Estimates in the correct range were obtained when the standard was 40% C-hordein. One reason for the overestimation was assumed to be the different composition of gliadin reference material from that of hordeins.
Figure 4. Prolamin concentration of gluten-free oat flour spiked with three barley flours, determined by HPLC, R5 ELISA sandwich with 40% C-hordein standard, and R5 sandwich ELISA with gliadin standard. Adapted from Huang et al. (2017).
In this study, the recognition of whole hordein by R5 antibody mainly came from C-hordein, which is more reactive than the other hordeins. The proportion of C-hordein in total hordein ranged from 16 to 33% of common Finnish barley cultivars and was always higher than that of ω-gliadin, the homologous protein class in the gliadin standard, which may account for the overestimation. The reactivity of D-, , and B-hordeins against R5 antibody varied widely in ELISA (Figure 5). C-hordein was 10-20 times more reactive than gliadin standard, which was 8-25 more reactive than B-hordein. The curves indicated that C-hordein and gliadin standard had similar affinity with the R5 antibody.
Figure 5. Reaction of isolated hordeins against R5 antibody in sandwich ELISA (Huang et al. 2017).
ELISA R5 has been calibrated and validated based on the PWG gliadin and hence it is expected to provide accurate results (Diaz-Amigo and Popping 2013). However, it cannot provide accurate results for sample materials that have different prolamin compositions. Another issue with the PWG gliadin reference material is that it is difficult to reproduce because the composition of gluten varies from season to season because of the differences in soil and weather conditions.
Therefore, what would be the most suitable reference material for gluten detection? It is a challenging task for several reasons: (1) gluten consists of several large proteins that can be potential targets for detection methods; (2) these proteins have physicochemical differences; (3) the expression of these proteins depends on cereal cultivar and growing conditions; (4) the structure and solubility of the gluten-containing products are modified during food manufacturing (Wieser 2007;
Diaz-Amigo and Popping 2013). Reference material should contain all of the assay targets and it
should be commutable, that is to say, it should cover the needs of the several existing detection methodologies. (Diaz-Amigo and Popping 2013). One solution would be to have one reference material per grain, which could be used to evaluate assay response to the individual grains and also allow making of customized mixtures. Or another approach would be to select and characterize a gluten material, that is, gluten or flour with characterized gluten content. On the other hand, using a material having only a single prolamin fraction would be useful only to the assays specific for those fractions, and another reference material should be developed for other assays. Nonetheless, reference material should be as close to real product as possible.
To help deal with the variety of the ELISA kits and to ensure the accuracy of the analytical results, a new gluten reference material is needed. Historically the gliadin fraction has been reported to be the unique gluten fraction responsible for the toxicity of cereals in coeliac patients and very little attention has been paid to glutenin fraction or gluten as whole (Howdle 2006). As a result, the search for reference materials has been limited to gliadin, with very little consideration to the use of gluten or other cereal sources such as rye or barley.
2.4.3 Conversion factor of 2
To ensure that the analytical tools are used properly, it is necessary to ensure that the interpretation of regulations is accurate. For example, there is a frequent misinterpretation considering the units of the action level, which is set by the Codex Standard and the EU Regulation: the labeling threshold is 20 mg of gluten/kg, not 10 mg of prolamin/kg, which is frequently and wrongly set as equal (Diaz-Amigo and Popping 2013). This misinterpretation occurs because most ELISAs measure prolamin, which is then converted into gluten by simply multiplying the prolamin content by a factor of two. Converting prolamin into gluten is not straightforward and can lead to inaccuracy of the results.
The ratio of prolamin to glutelin varies among different cereals and within a cereal depending on the cultivar and growing conditions (Wieser and Koehler 2009; Diaz-Amigo and Popping 2013). In a study by Wieser and Koehler (2009) the ratio of prolamin to glutenins ranged from 1.32 to 1.66 for wheat, from 1.12 to 1.16 for rye and from 1.20 to 1.71 for barley. Therefore the direct implication of using a factor of two is an overestimation of the gluten content in food samples (Diaz-Amigo and Popping 2013). Also, the factor is only applicable when the assay is specific exclusively to gliadins and results are overestimated in assays that also detect glutenins.
In addition, there is only limited information about whether the toxicity of rye and barley is equivalent to that of wheat one to one (Diaz-Amigo and Popping 2013). Action levels for gluten-free (20 ppm) are based on the toxicity of wheat and there is a nonscientific assumption that the same concentrations of rye and barley are more, less, or equally safe to coeliac patients compared to wheat.
3 AIMS OF THE STUDY
The aim of this study was to compare the prolamin compositions of different wheat cultivars and their reactivity against R5 antibody in sandwich ELISA. The aim was to isolate total gluten and to find the most suitable ratio of C-hordein to be used as a reference material for wheat gluten quantification of the selected cultivars instead of current gliadin standard. The hypothesis was that there would be great variation in the prolamin composition between different wheat cultivars and that the current gliadin reference material would not be suitable to represent all of them. The specific aims of the study were to:
• Optimize the method for the extraction of gliadin and glutenin and separation by RP-HPLC
• Categorize the wheat cultivars by their gliadin peak patterns and calculate their ω-gliadin
proportions by integrating the peak areas
• Do separation and collection of prolamin groups by RP-HPLC and analyse the fractions by
SDS-PAGE
• Isolate total gluten of the wheat cultivars and analyse their reactivity against R5 antibody by sandwich ELISA R5
4 MATERIALS AND METHODS
4.1 Materials
Twenty-three wheat cultivars were selected for this study. The cultivars were selected to be used in the study, since they were the most prevalent wheats of each country. Cultivar Julius was kindly provided by KWS (Germany) and cultivars Patras and Kerubino by IG Pflanzenzucht (Germany). Cultivars Siskin and Lili were from KWS (UK). Britannia, Claire, Zulu, Revelation and Crusoe were provided by Limagrain (UK). Cultivars Suntop, Spitfire, Lancer, Gregory and Mace were from Plant Breeding Institute, University of Sydney (Australia). Cultivars Julius, Brons and Hereford were kindly provided by Lantmännen (Sweden), Quarna and Anniina by Boreal Plant Breeding Ltd (Finland) and Amaretto by Planatanova (Finland). Apache and Cellule were provided by Maison Florimond Desprez S.A.S. (France). In addition, cultivar Annina (Finland, 26.1.2015) was used in some preliminary tests. The wheat kernels were milled to flour with a KT-3600 disc mill (Koneteollisuus Oy, Finland).
Extracted barley C-hordein with BSA (10, 20 and 30 % of C-hordein) was kindly provided by Xin Huang. All of the chemicals used were of analytical quality.
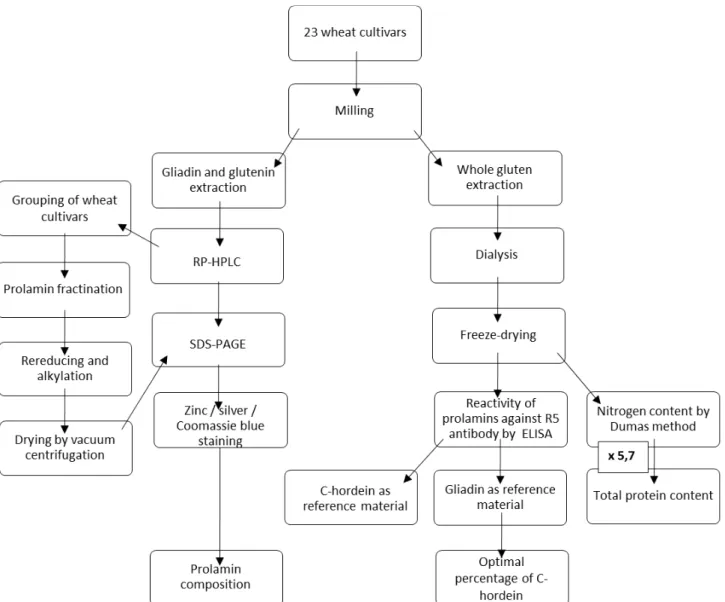
4.2 Workflow
The workflow of the study is presented in figure 6.
4.3 Extraction
4.3.1 Gliadin and glutenin
Wheat flour (0,1 g) was extracted following the Osborne procedure of a) salt solution (2 x 1.0 ml: 0.4 M NaCl with 0.067 M HKNaPO4, pH 7.4) for 10 min at ambient temperature to remove the
albumin and globulin fractions; and b) with 1-propanol/water (2 x 0.5 ml: 50/50 v/v, for 10 min at 60°C to extract gliadins. The pellet was washed with MilliQ-water and centrifuged (5810R, Eppendorf AG., Germany) for 5 min at 20000 g to remove any buffer residues. Finally, c) glutelin solution (1 ml:1-propanol (50/50 v/v)/ 0.05 M Tris-HCl, pH 7.5, containing 2 M (w/v) urea and 1% (w/v) DTT for 20 min at 60°C was used to extract the glutenin fraction. Each extraction step was initiated with vortexing at room temperature. The suspensions were centrifuged for 10 min at 20000 g and the corresponding supernatants were combined. Aliquots of the extracts were filtered through a 0,45µm membrane before HPLC analysis.
4.3.2 Whole gluten extraction and dialysis
Whole gluten of all the milled wheat cultivars was extracted. Wheat flour (3 g) was mixed with 30
ml of 0.4 M NaCl with 0.067 M HKNaPO4 (pH 7.4) and incubated for 15 min at room temperature
in shaker. The samples were centrifuged for 30 min 18000 g at 20°C. The samples were washed
with milli-Q water and centrifuged again. 30 ml of 1-propanol and water (50/50 v/v) with 0.2 % DTT (w/v) was added and the samples were incubated for 45 min at 60°C. The samples were centrifuged for 30 min at 18000 g at 20°C.
Large container was filled with milli-Q water. The samples were poured to dampen dialysis tubing cellulose membranes (SnakeSkin Dialysis Tubing, 7K MWCO, 22 mm, Thermo Fisher Scientific, USA). For the second set of gluten samples dialysis another dialysis membrane, Cellu-Sep T1/Nominal MWCO 3500 (Membrane Filtration Products, Inc., Texas) was used. The membranes were closed with clips and laid in the container. Water was changed after 5 hours and few drops of acetic acid was added with magnetic stirrers. The containers were covered with plastic wrap and left in the cold room for 2 days. The water was changed for two times again and 2 ml of acetic acid was added each time.
The samples were placed to plastic containers and first left to -20°C freezer for 2 h. Next they were left to -80°C freezer for 3 days. Finally the samples were placed in the freeze-dryer (Dura-Dry, FTS Systems, Inc.) for 4 days.
4.4 Total protein content
The nitrogen content of the extracted and freeze-dried wheat gluten samples of different cultivars was analysed by the Dumas method, which was based on the detection of total nitrogen in the sample. Due to the small sample size of some cultivars, 60-120 mg of gluten sample was weighted and the total protein content was analysed without replicates by Vario MAX CN Element Analyzer (Elementar Analysensysteme GmbH, Germany). Therefore statistical analysis could not be conducted. The nitrogen content was multiplied by the factor of 5.7 to calculate the crude protein content. The protein content was taken into account with the calculations of ELISA prolamin content measurements.
4.5 RP-HPLC method establishment
All the samples were analysed with Agilent Technologies Inc. 1200 series RP-HPLC (Germany) using a C8 column (4.6 mm X 250 mm, 300 Å, 5µm, Discovery, Sigma-Aldrich Co. LLC). Following preliminary tests were conducted:
• Solvent. The extraction of gliadin and glutenin was performed with a) 1-propanol and water (2 x 0.5 ml: 50/50 v/v); b) 2-propanol and water (2 x 0.5 ml: 50/50 v/v); and c) ethanol and water (2 x 0.5 ml: 60/40 v/v) to investigate the best extraction result. For glutenin extraction, also 2-mercaptoethanol (5% v/v) was used. An injection volume of 10 µl of both gliadin and glutenin extracts from wheat cultivar Julius (SWE) was separated on a RP-HPLC C8 column at 50°C.
• Temperature. Gliadin and glutenin extracts were analyzed in RP-HPLC at a) 25°C and b)
50°C to investigate the most suitable temperature for separation. Gliadin was extracted with 1-propanol and water (2 x 0.5 ml: 50/50 v/v) and a solution of 1-propanol (50/50 v/v)/ 0.05 M Tris-HCl, pH 7.5, containing 2 M (w/v) urea and 1% (w/v) dithiothreitol (DTT) was used
to extract the glutenin fraction. An injection volume of 10 µl of both gliadin and glutenin extracts from wheat cultivar Julius (SWE) was separated on C8 column.
• Glutenin injection volumes. Glutenin extract was analyzed with injection volumes of a) 25 µl and b) 50 µl to investigate if higher injection volume would result in a better separation. Glutenin was extracted with the same 1-propanol solution as previously. Glutenin extract from wheat cultivar Crusoe (UK) was separated on a C8 column at 50°C.
• Gradient. Gliadin extract was analyzed with three different gradients to investigate if a
lower percentage of acetonitrile in the mobile phase would result in a better separation of ω -gliadin. The gradients are presented in table 5. Only cv. Crusoe was analyzed with the different gradients. Gliadin was extracted with 1-propanol and water (2 x 0.5 ml: 50/50 v/v). An injection volume of 25 µl of gliadin was separated on a C8 column at 50°C. Previously prepared samples were heated at 100°C for 1.5 min and vortexed.
Table 5. Preliminary tests. Different RP-HPLC solvent B% gradients for better gliadin separation of wheat cv. Crusoe. Solvent B = 0.1% TFA in acetonitrile. Solvent A = 0.1% TFA in milli-Q water.
Min A B C
0 28 15 20
30 56 60 60
35a) 28 90 90
36 28 15 20
a) For gradient A 31 min.
4.6 Prolamin composition by RP-HPLC and SDS-PAGE
4.6.1 RP-HPLC of gliadin and glutenin extracts
Acetonitrile (ACN) and TFA were HPLC grade. An injection volume of 25 µl of the gliadin extract and 50 µl of the glutenin extract was separated on a C8 column at 50°C. A linear acetonitrile gradient shown in table 5 A was run over 30 min at a flow rate of 1 ml/min and the elution was monitored at 210 nm. The data was collected and the chromatograms were formed in Microsoft Excel. The cultivars were grouped based on similarities on their chromatograms. The gliadin peaks
were manually integrated and the peak areas were compared to determine the ω-gliadin proportion of total gliadin in each cultivar analysed by RP-HPLC.
4.6.2 SDS-PAGE
Gliadin and glutenin samples
Gliadin, glutenin and whole gluten extracts were analysed in SDS-PAGE. For gliadin and glutenin extracts, 40 µl of sample and 60 µl of SDS-buffer (62.5 mM Tris-HCl (pH 6.8) with 10% (v/v) glycerol, 2% (w/v) SDS, a hint of Bromophenol Blue) with 2-mercaptoethanol (5% v/v) was mixed in the Eppendorf-tubes. The tubes were vortexed and heated at 100°C for 3 min. 1-4 µl of the samples Crusoe, Revelation, Zulu, Claire, Britannia, Apache, Hereford, Brons and Julius (Sweden) and standard (Novex Sharp Pre-Stained Protein Standard, Thermo Fisher Scientific, CA) were loaded using a homogenous NuPAGE 10% polyacrylamide Bis-Tris gel (Invitrogen, CA, USA) and NuPAGE MOPS SDS Running Buffer (Invitrogen, CA, USA, pH 7.7). In addition, 8 µl of the samples Julius (Germany), Siskin, Lili, Suntop, Spitfire, Lancer, Gregory and Mace and standard were loaded using the Bolt 4-12% Bis-Tris Plus-gel (Invitrogen, CA, USA). The gels were attached to Mini Gel Tank (Thermo Fisher Scientific, Israel). The running conditions were 200 V for 50 min.
Gliadin with and without reducing agent
Another SDS-PAGE was conducted to gliadin extracts of cv. Julius (GER), Brons, Hereford, Apache, Britannia, Claire, Zulu, Revelation and Crusoe that had 1) 5% (v/v) mercaptoethanol added to the SDS-buffer and 2) no mercaptoethanol added. The ones without the mercaptoethanol were heated at 60°C for 10 min before adding the SDS-buffer. For each of the cultivars, 8 µl of sample was loaded and the running conditions were same as previously.
Whole gluten
To analyse the whole gluten samples in SDS-PAGE, 5 mg of sample was mixed with 500 µl of SDS-buffer with 5% (v/v) 2-mercaptoethanol and heated at 100°C for 3 min. The suitable amount of protein to be analyzed in SDS-PAGE was calculated and 3 µl of sample was decided to be loaded. SDS-PAGE was conducted as using the Bolt 4-12% Bis-Tris Plus-gels and SeeBlue Plus2 Pre-stained protein standard (Thermo Fisher Scientific Inc.) and XCell SureLock Mini-Cell
Electrophoresis System (Thermo Fisher Scientific Inc., China). The running conditions were 200 V for 40 min.
Coomassie Blue-staining
A staining solution was prepared (milli-Q water with 40% ethanol (v/v), 10% (v/v) acetic acid, 0,1% (v/v) Coomassie Brilliant Blue R-250) and added on the gels. They were heated in microwave for 1 min and then transferred to shaker for 15 min at room temperature. The gels were washed with milli-Q water. The gels were destained with 100 ml of the prepared de-staining solution (milli-Q water with 10% (v/v) ethanol and 7,5% (v/v) acetic acid) and heated in microwave for 1 min and left in mixer for 1-1,5 h at room temperature. The gels were washed with milli-Q water and analysed and photographed on a light table.
4.7 Characterization of wheat gluten protein types
4.7.1 RP-HPLC fractionation of gliadin and glutenin subgroups
The prolamin fractions of wheat cv. Crusoe were collected according to their characteristic retention times from the gliadin and glutenin extracts with a linear acetonitrile gradient shown in table 5 B (50°C). The collected fractions were dried first under a nitrogen stream at 40°C for 1 h and then by
vacuum centrifugation (Savant SpeedVac SC110A concentrator, USA). The fractions were
solubilized in 100 µl SDS-buffer with 5% (v/v) 2-mercaptoethanol and heated at 100°C for 3 min
before SDS-PAGE. The load volume of each sample and standard (SeeBlue Plus 2 Pre-stained protein standard, Thermo Fisher Scientific, MA) was 3-12 µl and the same Bolt 4-12 % gel was used as previously. The run time was 50 min. Silver Stain Plus kit (Bio-Rad, Inc.) was used for the staining. The staining solution was let to affect for 19 min before removal.
Also other two sets of cv. Crusoe’s gliadin fractions were collected, with a linear acetonitrile gradient shown in table 5 B and C. Lower percentage of acetonitrile in the solvent was assumed to result in a better separation since ω-gliadin is hydrophilic. The fractions were dried first under a
4.7.2 Rereducing, alkylation and SDS-PAGE of the collected prolamin fractions
Rereducing and alkylation was conducted to one set of collected and dried HPLC-fractions. DTT-solution (100 mM Tris-HCl (pH 8.3) with 5 mM DTT) was added to the tubes (25 µl), mixed and
incubated for 15 min at 60°C. Iodoacetamide-solution (30 mM Tris-HCl with iodoacetamide) was
added (25 µl) and incubated at room temperature for 30 min. Iodoacetamide is sensitive so all the tubes and solutions were covered in aluminum foils. Finally, SDS-buffer with 5 % 2-mercaptoethanol was added before SDS-PAGE.
The tubes were incubated at 60°C for 15 min. In addition to the gliadin fractions, an extracted whole gliadin- sample was analysed with SDS-PAGE and before loading, it was heated for 3 min at 100°C. The load volume of all the samples was 15 µl and run time 40 min. Silver staining was conducted as previously. The staining solution was let to affect for 21 min.
4.8 C-hordein as a reference material in sandwich ELISA
The wheat prolamins of different cultivars, C-hordein and gliadin standard were investigated against R5 antibody in sandwich ELISA (Ridascreen Gliadin, R-Biopharm AG, Germany). The previously extracted and freeze-dried wheat gluten samples of all the cultivars were weighted to Falcon tubes (10 mg) and 1.25 ml of cocktail solution (R-Biopharm AG, Germany) was added and vortexed. The samples were incubated at 50°C for 40 min in Incubator 1000 (Heidolph Instruments GmbH & CO, Germany) while mixing. The samples were cooled under running water and 3.75 ml of 80% (v/v) ethanol was added. The samples were vortexed and incubated for 60 min at room temperature in shaker (REAX 2000, Heidolph Instruments GmbH & CO, Germany). The samples were centrifuged for 10 min at 18000 g at 21°C.
The dilutions were done according to the manufacturer’s instructions with the sample dilution buffer provided in the kit. The diluted samples, gliadin standards and barley C-hordein samples with BSA (10, 20 and 30% of C-hordein) were loaded (100 µl) to the microplate and incubated for 30 min. Plate washing was conducted with microplate washer for 3 times (Asys Hitech GmbH, Biochrom, ASYS Atlantis, Austria). Diluted enzyme conjugate was loaded (100 µl) to the wells and
incubated for 30 min at room temperature. The microplate was washed as previously. 50 µl of substrate and 50 µl of chromogen was added to each well, followed by incubation for 30 min at room temperature in the dark. Finally, 100 µl of the stop reagent was added to each well. The absorbance was measured by spectrophotometer (Labsystems, Original Multiscan EX, Finland) at 450 nm with Ascent Software Version 2.6 (Thermo Labsystems).
The response of the ELISA systems antibody to increasing prolamin concentration of the wheat gluten samples was plotted on a log axes. The crude protein content of the samples analysed by the Dumas method, was taken into account. The data was replotted as linear Michaelis-Menten plots and the Km values were determined from the curves of best fit (GraphPAD Prism 6). The Km values of prolamins were determined from the curves. The Km is a measure of the amount of prolamin required to produce a half-maximal response in the ELISA assay. The calculation was done by use of a cubic spline function. Averages were calculated with Microsoft Excel.
5 RESULTS
5.1 RP-HPLC method
5.1.1 Solvent
The extraction of gliadin and glutenin was performed with 1) 50 % 1-propanol (v/v), 2) 50 % 2-propanol (v/v) and 3) 60 % ethanol (v/v) to investigate which would result in best extraction. For glutenin extraction, also 5 % 2-mercaptoethanol (v/v) was used. The chromatograms of gliadin and glutenin extracts with different solvents used did not differ, thus the solvent had no effect on better gliadin or glutenin extraction (Figure 7). Gliadin peaks were well separated with all the solvents, whereas glutenin peaks were poorly separated and another solvent was decided to be tested. For gliadin extraction, 50 % 1-propanol (v/v) is to be used in the following experiments.
B
Figure 7. Reverse-phase liquid chromatograms of a) gliadin and b) glutenin extracts from wheat cultivar Julius (SWE) separated on a C8 column (50°C). Solvents used in the extraction: 60 % EtOH, 50 % 2-PrOH and 50 % 1-PrOH. For glutenin extraction also 5 % 2-mercaptoethanol was used.
5.1.2 Temperature
Gliadin and glutenin extracts were analysed at 25°C and 50°C in RP-HPLC to investigate the most suitable temperature for separation. To improve glutenin extraction, 50% 1-propanol (v/v) with 2 mol/l of urea, 0.05 mol/l of Tris-HCL (pH 7.5) and 1% (w/v) DTT was used. The retention times of the chromatograms with different temperatures used were different and also the baseline was different (Figure 8). For example with the gliadin sample at 25°C there can be seen a peak at ~12 min, whereas at 50°C, the same peak can be seen at ~10 min. The baseline of the glutenin chromatogram declined, and so did the baseline of 50°C gliadin chromatogram. With this solvent, glutenin separation was better, but the absorbance of the peaks was still low. In the following HPLC experiments, 50°C temperature is to be used with both gliadin and glutenin separation.
A
B
Figure 8. Reverse-phase liquid chromatograms of a) gliadin and b) glutenin extracts from wheat cultivar Crusoe separated on a C8 column, at 25°C and 50°C.
5.1.3 Glutenin injection volume
Glutenin extract was analysed by RP-HPLC with injection volumes 25 µl and 50 µl to investigate if higher injection volume would result in a better separation. Bigger injection volume resulted in better separation (Figure 9). In the following experiments 50 µl injection volume is to be used for glutenin HPLC separation. The void peak was still quite tall, which could mean that some of the glutenin subgroups were not properly solubilized.
A
B
Figure 9. Reverse-phase liquid chromatograms of glutenin extract from wheat cultivar Crusoe separated on a C8 column (50°C). Injection volume a) 25 µl and b) 50 µl.
5.1.4 Gradient
Gliadin extract was analysed with two different gradients to investigate if a lower percentage of acetonitrile in the mobile phase would result in a better separation of ω-gliadin. This was the hypothesis since ω-gliadin is more hydrophilic than other gliadins. When whole gliadin was separated on a C8-column, the ω-gliadin was eluted first, followed by α/β-gliadins and γ-gliadins.
The lower percentage of acetonitrile resulted in a smaller void and taller peaks for ω-gliadin in the chromatogram (Figure 10). In addition, the retention times of ω-gliadin were different between the different gradients. The gradient with higher percentage of acetonitrile resulted in a retention time of 13 min whereas the gradient with lower percentage of acetonitrile resulted in 18 min retention