
Chapter 5 Industrial Policy, Structure, and Locations during the Transition toward a Market-oriented Economy in Myanmar
56
0
0
Full text
(2) Kuroiwa ed., Spatial Statistics and Industrial Location in CLMV: An Interim Report, Chosakenkyu Hokokusho, IDE-JETRO, 2010.. Chapter 5. Industrial Policy, Structure, and Locations during the Transition toward a Market-oriented Economy in Myanmar. Toshihiro Kudo. INTRODUCTION This paper examines Myanmar’s industrial policy, structure, and locations during the transition from a centrally planned economy to a market-oriented one throughout the 1990s and up to the present. After the military government assumed power in 1988, it abandoned the socialist centrally planned economic system and began instituting a market-oriented one through a series of liberalization and deregulation measures, although most of which have stalled since 1997 and remain half-way implemented. Against this background, it is rather surprising that the impact of these new policies of international trade, finance, regulations, licensing and ownership requirements on industrial structure and location in Myanmar has been poorly documented and examined to date. Some key issues to understanding the impact and effectiveness of the market-oriented policies during the last two decades in Myanmar remain to be answered: Have the new trade and industrial policies changed the industrial structure and organizational behavior in Myanmar? Have they improved the performance of Myanmar’s industrial sector? Have they had any impact on industry location in Myanmar? This paper reviews the series of liberalization programs implemented under the military.
(3) government—the State Law and Order Restoration Council (SLORC) and the State Peace and Development Council (SPDC)—and assesses their impact on industrial structure and its spatial distribution.. 1. INDUSTRIAL POLICY: PAST AND PRESENT Industrialization is an essential element in the development of a country as a whole. Among the Third World countries newly independent after World War II, there was a desire for economic growth through industrialization: to transform their traditional agrarian economies into modern industrial ones. Economic development had often been equated with industrialization, and independent Myanmar shared the same aspiration for a modern industrial economy. However, looking at Table 1 we can clearly see the underdeveloped state of the industrial sector in Myanmar compared with that of neighboring countries. Myanmar is rich in natural resources and has a highly literate population, which are apparently good signs for development prospects. Its economy was slightly larger than that of Thailand before World War II; its exports reached $195 million, while Thailand's were only $76 million. Although Myanmar's economy was devastated by the war, most economic and development indicators show that it was not too far behind Thailand by 1950. Therefore, it was not at all unrealistic in the 1950s to be optimistic about Myanmar's economic prospects, including its rapid industrialization (Kudo [1998:7-2]).. 2.
(4) Table 1 GDP by industry Primary Industry 1980 1990 2000 Myanmar 47 57 57 Cambodia 56 38 Laos 61 53 Vietnam 50 39 25. 2007 44 32 43 20. (%) Secondary Industry 1980 1990 2000 2007 13 11 10 19 11 23 27 15 23 32 23 23 37 42. (Note) Myanmar and Laos figures for 2007 are based on 2006. (Source) ADB, Key Indicators , various numbers.. Taking these historical facts and the natural resources endowments of Myanmar into consideration, the apparent explanation for economic stagnation and stunted industrialization lies in the industrial policies that successive governments have adopted since independence. Table 2 gives a brief chronology of the political economy of industrialization in Myanmar. It is clear that Myanmar’s governments have long clung to control-oriented, or at least interventionist, policies, rather than utilizing market mechanisms.. Table 2: A Brief chronology of Myanmar’s political economy of industrialization Political System 1.1886-1948 Colonialism Period. Economic System Laissez-faire policy. Industrial Strategy Export-propelled “agriculturization ”. Parliamentary Moderate 2.1948-1962 democracy economic nationalism in the framework of market mechanisms 3.1962-1974 Military rule Command (Burmese economy, Way to Radical Socialism) nationalism, Burmanization & Strict isolation 3. Raw material-oriented import substitution industrialization. Import Substitution industrialization Self-reliant line. Result Foreign-dominated industrial sector Poor spread effect for nationwide industrial development Moderate industrial performance Foreign-dominated industrial sector. Burmanization of economy and industry Poor economic and industrial performance.
(5) 4.1974-1988 BSPP rule (Burmese Way to Socialism). 5.1988 to 1997. Military rule (SLORC). 6.1997 to Present. Military rule (SPDC). Centralized planning inward-looking policy with the exception of ODA acceptance Transition toward market economy Open-door policy. Import substitution industrialization Agro-based industries Inflows of ODA. Poor economic and industrial performance Import-dependent industries. Agriculture-based & export-oriented industrialization Inflows of foreign direct investment. Economic recovery Gradual increase in foreign and local private enterprises. Controlled market economy. Natural resources Stalled economic exploitation, reforms offshore gas in Enhanced economic particular control No explicit Cronyism industrial strategy Source: Based on Mya Than and Joseph L.H. Tan, "Introduction: Optimism for Myanmar's Economic Transition in the 1990s?" in Mya Than and Joseph L.H. Tan, eds., Myanmar Dilemmas and Options: The Challenge of Economic Transition in the 1990s (Singapore: ASEAN Economic Research Unit, Institute of Southeast Asian Studies, 1990), Appendix I, pp.14-15; and Maung Maung Lwin, “Industrialization of Myanmar and Economic Dynamism of Pacific Asia,” Kaigai-Jijo Kenkyu (Studies on Foreign Affairs), Vol.24, No.1 (Kumamoto: Kaigai-Jijo Kenkyu-jo, Kumamoto Gakuen University, September 1996). Major changes and additions are by the author.. During the socialist period in particular, an inward-looking growth strategy, nationalization (Burmanization), and import substitution had long been pursued. However, Myanmar’s centrally planned economy, like other socialist countries, faced many obstacles as well as stagnant growth in not just the industrial sector but the economy as a whole. In the mid-1970s, the socialist government relaxed some its strict policies and introduced reforms for State-owned Economic Enterprises (SEEs) along with the prescription of commercial guidelines to improve their efficiency. Although the economy picked up shortly after the reforms, it was not sustainable, mainly due to a shortage of imported material goods. After 1983, industrial production deteriorated again and other economic problems such as high 4.
(6) inflation, rising living costs, and macroeconomic and monetary mismanagement including demonetization in 1987 worsened the situation, which eventually led to the collapse of the socialist regime in 1988. Subsequently, the SLORC/SPDC officially gave up on the establishment of a socialist economic system and started to promote a market-oriented economy. Two pillar laws were promulgated: the Foreign Investment Law (FIL) in November 1988 and the State-owned Economic Enterprises Law (SEEs Law) in March 1989. The former resumed the intake of private foreign capital after a 25-year interval, and the latter authorized private enterprises to engage in all but 12 proscribed industries. In addition to these, various reform measures were taken to promote the active participation of the private sector in the national economy. These included the decentralization of control of economic activities, relaxation of price controls, deregulation of export and import restrictions, opening of border trade, reduction of government subsidies, announcement of full-fledged privatization of all SEEs, streamlining of taxes and duties, establishment of industrial zones, and improvement of infrastructure (Table 3). Between 1988 and 1997, 27 new business-related laws, including the two above, were promulgated, and successive military governments apparently committed themselves to the global trend toward a market-oriented economy.. Table 3: Major economic reforms under the military rule 1988. * Introduction of Foreign Investment Law. 1989. * Decontrol of prices * Regularization of border trade * Introduction of State-owned Economic Enterprises Law delineating the scope of the state sector * Revocation of the 1965 law that established the socialist economic system. 1990. * Introduction of Myanmar Tourism Law * Permission for 100% retention of export earnings 5.
(7) * Introduction of Private Industrial Enterprise Law * Introduction of the Central Bank of Myanmar Law * Introduction of Financial Institutions of Myanmar Law * Introduction of Myanmar Agricultural and Rural Development Law * Introduction of Commercial Tax Law 1991. * Initiation of industrial zones in Yangon * Announcement of the Central Bank of Myanmar Rules and Regulations * Introduction of Promotion of Cottage Industries Law * Reestablishment of the Union of Myanmar Federation of Chambers of Commerce and Industry (UMFCCI). 1992. * Announcement to lease out inefficient state-owned factories * Announcement of denationalization of nationalized sawmills * Announcement of the establishment of four private banks * Introduction of Tariff Law * Introduction of Savings Bank Law. 1993. * Introduction of US$ denominated Foreign Exchange Certificate (FEC) * Introduction of Myanmar Insurance Law. 1994. * Introduction of Myanmar Citizens Investment Law * Licensing of representative offices of 11 foreign banks * Introduction of Science and Technology Development Law. 1995. * Announcement of the formation of Privatization Committee * Announcement of permission to establish joint venture banks between local private banks and foreign banks (although not realized until now) * Opening of the licensed foreign exchange center for FEC trading in Yangon. 1996. * Permission given to local private banks to conduct foreign exchange business and to pay interest on foreign currency deposits * Establishment of the Myanmar Securities Exchange Centre Co. Ltd. (MSEC), a joint venture between Japan's Daiwa Research Institute and the state-owned Myanmar Economic Bank (MEB) * Introduction of law on development of computer knowledge * Official rate of exchange for levying custom duties changed to K100 per US$ accompanied by reduction of tariffs to a fraction of previous values. 1997. * Announcement of paddy procurement through a tender bid system (but this was not implemented). 1998. * Announcement of leasing of fallow and virgin land for paddy and cash-crop cultivation or livestock breeding by private entrepreneurs, including foreigners 6.
(8) 2000. * Across-the-board increase of public sector salaries, by 5-6 times, to come in line with private sector wages. 2003. * Announced liberalization of rice export * Abolishment of distribution of rice to government-related officials. 2005. * Export permits given to private rice exporters * An increase of official prices of gasoline and diesel by 8-9 times. 2006. * Across-the-board increase of public sector salaries by 6-12 times * An increase of official prices of electricity by 10 times. 2007. * An increase of official prices of gasoline and diesel by about 2 times. 2008. * Large-scale privatization of government properties and liberalization of some public utilities. 2010. * Liberalization of some import restrictions and permission of imports of previously restricted items such as cars, motorcycles, and diesel. However, Myanmar people can never be fully confident of the military government’s commitment to transition to a genuine market economy, which would guarantee a level playing field for all of the economic actors including the private sector. The trend in Myanmar’s policy has turned increasingly inward and against market-mechanisms, particularly after the Asian currency crisis in mid-1997. The State Peace and Development Council (SPDC), the reorganized body of the military government in 1997, has consciously adopted an import substitution and self-reliant, or what may even be called survival, policy by starting to intervene in many economic activities and strengthening state controls. The Trade Policy Council (knows as TC), an extra-ministerial committee, is said to be responsible for such policy changes. The Trade Policy Council was formed in July 1997, with General Maung Aye, Vice-Chairman of the SPDC, as Chairman, and with the Minister for National Planning and Economic Development as Secretary. The Trade Policy Council has laid down important policies concerning not only external trade but also other economic affairs. These measures include an export-first (import against export earnings) policy, limits on non-essential imports, 7.
(9) 10% export tax, advanced purchase of beans and pulses for export, advanced purchase of cotton, market-price-based taxation on imported vehicles, import restrictions on motor vehicles, monthly grants for palm oil imports, reduced FEC limits on overseas bank transfers, strengthened revenue collection from MIC-approved projects, and inspection of under-priced import invoices. The motivation for a number of these might be the capture of foreign exchange earnings for the government budget. Foreign companies have faced a more challenging business environment under such policy changes, and some foreign investors requested relaxation of economic controls from the authorities concerned. Responses to such requests from the authorities were, however, generally stereotyped and lacking in commitment. For example, the Myanmar Investment Commission (MIC) often proclaims the FIL of 1988 as its most liberal and encouraging investment act, which permits 100% foreign-owned investment and provides attractive tax incentives. Theoretically, it is comparable to those of even advanced ASEAN members. However, to the extent that the existence of laws such as this were used as an excuse not to listen to the claims of foreign investors, so the deep-seated structural problems which were real impediments to the inflow of foreign direct investments were not be addressed. Favoritism and corruption, which is endemic and constitutes a serious problem in many developing economies, had been largely avoided by Myanmar. On the contrary, successive governments had taken pride in being clean, even since the socialist period. Nevertheless, it is also true that economies transitioning from being centrally-planned to market-oriented tend to suffer from problems of favoritism and corruption because they often lack the legal and institutional foundations for the functioning of a free and fair market economy. The military holding companies, Myanmar Economic Corporation (MEC) and the Union of Myanmar Economic Holdings, Ltd. (UMEHL), which are extensively engaged in the. 8.
(10) manufacturing and services sectors, are exerting increasing influence over business activities. The SEEs Law of 1989 was amended in 1997 to make it possible to establish a 100% military-owned company. Military-related companies themselves are not necessarily harmful to economic development; however, they can become harmful if they are afforded especially favorable treatment by the government and thereby damage the idea of a level playing field for all. In addition to these military holding companies, the government has started to embrace so-called national entrepreneurs who, it is claimed, are given preferential treatment in doing business. Such arbitrary favoritism, if provided, would send a worrying signal to businesses that the government could change even the rules of the game. We should note that once a business environment is created where personal connections to the authorities rather than management and technical skills are the most important factors for business success, then it becomes difficult to provide sound economic incentives to entrepreneurs of ability, and hence they lose confidence in the policy environment. In such a situation, emerging enterprises and entrepreneurs as well as potential foreign investors may well divert their interests to other economies or just chase windfall profits through rent-seeking activities. A recent series of sales of government properties to well-connected businessmen has also raised concerns about rampant nepotism and corruption in the Myanmar economy. In order to prevent Myanmar moving headlong toward so-called crony capitalism, it is important for the government to establish a level playing field where all economic actors can compete with each other in a free and fair manner.. 2. THE IMPACT OF ECONOMIC REFORMS ON INDUSTRIAL STRUCUTRE What impact did economic reforms, including liberalization measures, have on industrial. 9.
(11) structure and performance? Whether or not the policies of the military government have changed industrial structure and organizational behavior and hence improved performance is a key issue for future industrial development in Myanmar. Nevertheless, the impact of economic reforms on industrial structure and performance has been poorly documented. This section examines this issue.. 2.1 Classification of industries In Myanmar, the Central Statistical Organization (CSO) established the Burma Standard for Industrial Classification (BSIC) regarding economic activities in 1952 based on the UN’s International Standard for Industrial Classification (ISIC) of 1948. The BSIC also categorizes industrial activities into three levels, that is, Divisions (1 digit), Major Groups (2 digits) and Groups (3 digits). Each Division is as follows: 0 Agriculture, Forestry, Hunting and Fishery; 1 Mining and Quarrying; 2 & 3 Manufacturing; 4 Construction; 5 Electricity, Gas, Water, and Sanitary Services; 6 Commerce; 7 Transport, Storage, and Communication; 8 Services; and 9 Activities Not Adequately Described. The Ministry of Industry (1) is said to be revising the BSIC based on the ISIC of 1990; however, the new version of BSIC has not yet been utilized in government reports. Apart from the BSIC, the Ministry of National Planning and Economic Development (MNPED) has used another classification in compiling national income statistics. This classification has been employed by the said Ministry for compiling an annual economic report called Review of the Financial, Economic and Social Conditions (hereinafter the “Review”). Under this classification system, all economic activities are classified into 14 sectors: Agriculture; Livestock and Fishery; Forestry; Energy; Mining; Processing and Manufacturing; Electric Power; Construction; Transportation; Communications; Financial. 10.
(12) Institutions; Social and Administrative Services; Rentals and Other Services; and Trade.1 The Processing and Manufacturing sector is further subdivided in the Review into 13 commodity groups: Food and Beverages; Clothing and Wearing Apparel; Construction Materials; Personal Goods; Household Goods; Printing and Publishing; Industrial Raw Materials; Mineral and Petroleum Products; Agriculture Equipment; Machinery and Equipment; Transport Vehicles; Electrical Goods; and Miscellaneous.. 2.2 GDP Industrial structure can be defined in terms of the relative importance of individual industries, or groups of related industries, within an economy. One of the most frequent measures of an industry’s importance is based on its production (value added or net output). Table 4 shows the relative importance of different sectors to GDP. As mentioned above, a 14-sector classification is employed here. In addition to the problem of industrial classification, there is another issue as to whether we use nominal GDP or real GDP when looking at industrial structural changes. Nominal GDP is measured at current prices. If all prices doubled without any changes in quantities, then nominal GDP would double. Yet it would be misleading to say that the economy’s ability to satisfy demand has doubled, because the quantity of goods produced has remained the same. In contrast to this, real GDP, which is the value of goods and services measured at constant prices of a base year, would not be influenced by changes in prices. Since a society’s ability to provide economic satisfaction for its members ultimately depends on the quantities of goods and services produced, real GDP, which summarizes the output of the economy measured at base-year prices, provides a better Until the Fiscal Year (FY) 1996 Review, 13 sectors were used for GDP statistics. Since the FY 1997 Review, “Energy” was added to make a total of 14 sectors. However, the MNPED stopped issuing the Review thereafter. Myanmar’s fiscal year (FY) starts from April and ends in March. 1. 11.
(13) measure of economic well-being than nominal GDP. Myanmar’s GDP is calculated in different base years: it was calculated from FY1985 to FY2000 at FY1985 constant prices, from FY2001 to FY2005 at FY2000 constant prices, and the later years at FY2005 constant prices.. 12.
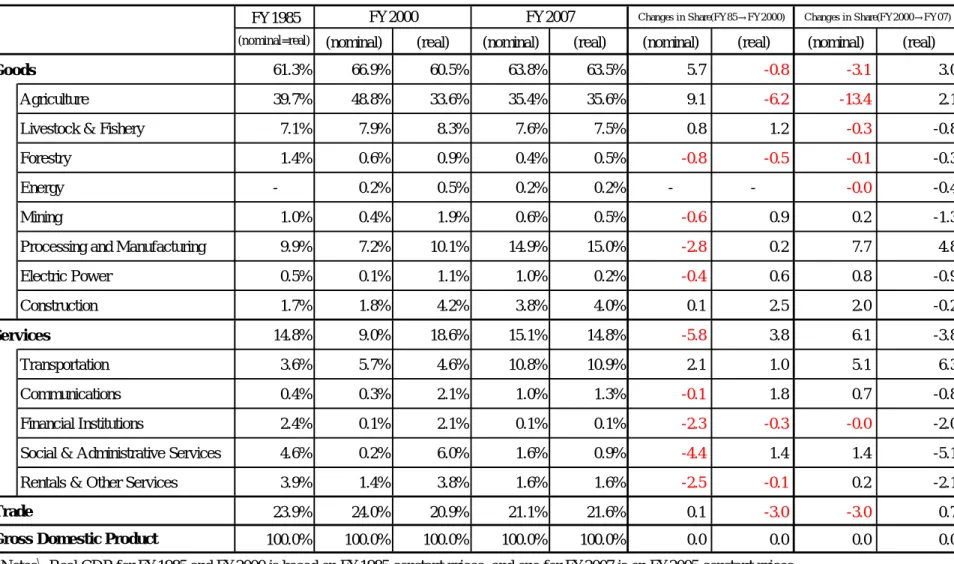
(14) Table4: GDP by industrial sectors. (Unit: %; % Point) FY1985 (nominal=real). FY2000 (nominal). FY2007. (real). (nominal). Changes in Share(FY85→FY2000). (real). (nominal). (real). Changes in Share(FY2000→FY07). (nominal). (real). 61.3%. 66.9%. 60.5%. 63.8%. 63.5%. 5.7. -0.8. -3.1. 3.0. 39.7%. 48.8%. 33.6%. 35.4%. 35.6%. 9.1. -6.2. -13.4. 2.1. Livestock & Fishery. 7.1%. 7.9%. 8.3%. 7.6%. 7.5%. 0.8. 1.2. -0.3. -0.8. Forestry. 1.4%. 0.6%. 0.9%. 0.4%. 0.5%. -0.8. -0.5. -0.1. -0.3. 0.2%. 0.5%. 0.2%. 0.2%. -0.0. -0.4. Goods Agriculture. Energy. -. -. -. Mining. 1.0%. 0.4%. 1.9%. 0.6%. 0.5%. -0.6. 0.9. 0.2. -1.3. Processing and Manufacturing. 9.9%. 7.2%. 10.1%. 14.9%. 15.0%. -2.8. 0.2. 7.7. 4.8. Electric Power. 0.5%. 0.1%. 1.1%. 1.0%. 0.2%. -0.4. 0.6. 0.8. -0.9. Construction. 1.7%. 1.8%. 4.2%. 3.8%. 4.0%. 0.1. 2.5. 2.0. -0.2. 14.8%. 9.0%. 18.6%. 15.1%. 14.8%. -5.8. 3.8. 6.1. -3.8. Transportation. 3.6%. 5.7%. 4.6%. 10.8%. 10.9%. 2.1. 1.0. 5.1. 6.3. Communications. 0.4%. 0.3%. 2.1%. 1.0%. 1.3%. -0.1. 1.8. 0.7. -0.8. Financial Institutions. 2.4%. 0.1%. 2.1%. 0.1%. 0.1%. -2.3. -0.3. -0.0. -2.0. Social & Administrative Services. 4.6%. 0.2%. 6.0%. 1.6%. 0.9%. -4.4. 1.4. 1.4. -5.1. Rentals & Other Services. 3.9%. 1.4%. 3.8%. 1.6%. 1.6%. -2.5. -0.1. 0.2. -2.1. 23.9%. 24.0%. 20.9%. 21.1%. 21.6%. 0.1. -3.0. -3.0. 0.7. 100.0%. 100.0%. 100.0%. 100.0%. 100.0%. 0.0. 0.0. 0.0. 0.0. Services. Trade Gross Domestic Product. (Notes) Real GDP for FY1985 and FY2000 is based on FY1985 constant prices; and one for FY2007 is on FY2005 constant prices. (Source) MNPED, Review (various issues); and CSO, Statistical Yearbook (various issues).. 13.
(15) Our main concern here is, however, with changes in industrial structure, which presupposes changes in price structure as well. In this section, we will pay closer attention to the relative importance of different sectors in nominal GDP, which also reflects changes in price structure. The question of whether to use nominal GDP or real GDP to ascertain structural changes in an economy is particularly important in the case of Myanmar. We should note that there are large differences in shares between nominal GDP and real GDP in different sectors. Table 4 shows both nominal GDP and real GDP in FY1985, FY2000 and the latest year of FY2007. In terms of GDP share, there are differences between the nominal and real figures. For example, in FY1985, the agriculture sector accounted for 39.5% of both nominal and real GDP, while in FY2000, it accounted for 48.8% of nominal GDP and 33.6% of real GDP. On one hand, the agriculture sector decreased its relative importance to real GDP by 6.2 percentage points between FY1985 and FY2000, on the other hand it increased its share of nominal GDP by 9.1 percentage points during the same period. On the contrary, the processing and manufacturing sector increased its relative importance to real GDP by 0.2 percentage points, whereas it decreased its share of nominal GDP by 2.8 percentage points. According to the figures for nominal GDP, some “agriculturalization” occurred, rather than “industrialization” during FY1985 and FY2000. Such differences between nominal GDP and real GDP are due to the differentiated rates of increase by the different sectors of GDP deflator. A GDP deflator compares the current price of a basket of goods and services produced this year with the price of the same basket in the base year. In other words, the GDP deflator measures the price of the typical unit of output relative to its price in the base year. Figure 1 and 2 show the indices of GDP deflators in various sectors, where the base year of FY1985 is set at 1 for Figure 1 and that of FY2000 is set 1 for Figure 2.. 14.
(16) Figure 1: GDP deflator by industry, FY1985-99. FY1985=1. 55 50 45 40 Agriculture. 35. Livestock & Fishery 30. Processing and Manufacturing Construction. 25. Transportation 20. Social & Administrative Services Trade. 15. GDP Deflator 10 5 0 FY1985 1986. 1987. 1988. 1989. 1990. 1991. 1992. 1993. 1994. (Source) MNPED, Review (various issues); and CSO, Statistical Yearbook (various issues).. 15. 1995. 1996. 1997. 1998. 1999.
(17) Figure 2: GDP deflator by industry, FY2000-07. FY2000=1 25. 20. Agriculture 15. Livestock & Fishery Processing and Manufacturing Construction Transportation. 10. Social & Administrative Services Trade GDP Deflator. 5. 0 FY2000. 2001. 2002. 2003. 2004. 2005. 2006. (Source) MNPED, Review (various issues); and CSO, Statistical Yearbook (various issues).. 16. 2007.
(18) It is often the case that when transitioning from a centrally-planned economy to a market-oriented one, price structure undergoes a big change. In Myanmar’s case, the prices of agricultural produce and food, which had long been controlled at lower prices throughout the socialist period, jumped up to market level prices on account of the liberalization measures. The price hikes in agricultural products such as rice and vegetables were much higher than those in other sectors, such as industrial goods, construction, transportation, and social and administrative services. The share of the agriculture sector of nominal GDP increased due to the effect of the relative price hikes for the period between FY1985 and FY2000, although its share in real GDP terms decreased during the same period. Bearing in mind the above discussion, we now look at Table 4 to consider the structural changes in the economy. Looking at the figures for nominal GDP, we see that only the agricultural sector has increased its share substantially, while most other sectors have reduced their share or are little changed. It may be said that the industrial structure in Myanmar has been static throughout the 1990s. Then, why did the agriculture sector raise its share in nominal GDP in the 1990s? Firstly, the production of agriculture has increased. For example, the production of paddy, the sown area of which occupies more than 40% of the total sown area, increased by 54% from 12,956 thousand tons in FY1988 to 19,888 thousand tons in FY1999. The increase was remarkable but achievable with an annual average growth rate of about 4%. As shown by the decline in the share of the agricultural sector in real GDP for the period between FY1985 and FY2000, the increases in quantity of other sectors must had surpassed that of the agricultural sector. Secondly, and more importantly, price hikes of agricultural produce contributed to an increase in its relative importance in nominal GDP. As mentioned earlier, the prices of. 17.
(19) agricultural produce increased more rapidly than industrial products and services throughout the 1990s. In other words, the terms of trade of agricultural produce over industrial goods improved just after the open-door and market-oriented policies were introduced. Hence, it may be said that, in the 1990s, the economic welfare of farmers in rural areas was elevated more than that of industrial workers in urban areas. This policy contrasts sharply with that of the socialist regime. During the socialist period, the price of agricultural produce was consistently suppressed to well below normal market levels, which was a de facto subsidy to urban dwellers. Moreover, external trade was monopolized by the state and the socialist government poured much of its earnings from the export of agricultural produce into import substitution industries, mainly located in urban areas. The military government suddenly abandoned such policies favorable to the urban population and showed more concern about the well being of farmers in rural areas. Such a policy change was probably driven by the political and economic crisis in 1988 and the people’s uprising against the then government. The military government must have understood the importance of improving the living standards of the rural population, which constitutes 75% of the national population. The agriculture/rural-favored attitude of the present government is also expressed in their often repeated economic slogan, “Development of agriculture as the base and all-round development of other sectors of the economy as well”. However, entering the twenty-first century we saw some “industrialization” in the Myanmar economy. The processing and manufacturing sector increased its share in nominal GDP by 7.7 percentage points for the period between FY2000 and FY2007. On the contrary, the share of the agriculture sector of nominal GDP decreased in spite of its increase in real GDP for the period between FY2000 and FY2007. This was due to the deteriorated terms of. 18.
(20) trade of agricultural produce against industrial goods and services. The transitional effect from the planned economy to market economy on the price structure settled down by the end of the 1990s. There is certainly an impression that Myanmar’s economy has changed visibly. High-rise buildings are conspicuous in major cities such as Yangon and Mandalay. International hotels and shopping malls are no longer new to the Yangon and Mandalay dwellers. Streets are crowded with cars, and traffic jams have become a regular morning and evening occurrence. Moreover, the building of the new capital city, Naypyitaw, has brought a mini boom to the construction sector since the early twenty-first century. With a series of economic reforms and transition toward a market-oriented economy, there was steady economic development leading to an average annual growth rate of 7.5% for the period of the four-year plan (1992/93-95/96), which was reasonably high in an agrarian economy such as Myanmar’s. The success of the first short-term plan was due to various factors: private sector development following the liberalization policy; inflows of FDI following the open-door policy; substantial increases in agricultural produce (especially rice following the introduction of summer paddy); growth of exports following decontrol of the state monopoly of foreign trade; encouragement of tourism; and the construction mini-boom. During the period of the Second Short-Term Five Year Plan (1996/97 to 2000/01), the average annual growth rate was 8.5%, mainly due to the agricultural sector and showed the highest growth rate in the industry sector. In the Third Short-Term Five Year Plan (2001/02 to 2005/06), the average annual growth rate was at its peak, at 12.8 %, which was mainly due to an industry and energy sector development. Such substantial growth in the official GDP is, however, considered dubious by many economists both inside and outside the country.2 The statistics on GDP were collected by the central government through the 64 nationwide prefectural offices of the Planning Department, the MNPED, and the 16 state and division. 2. 19.
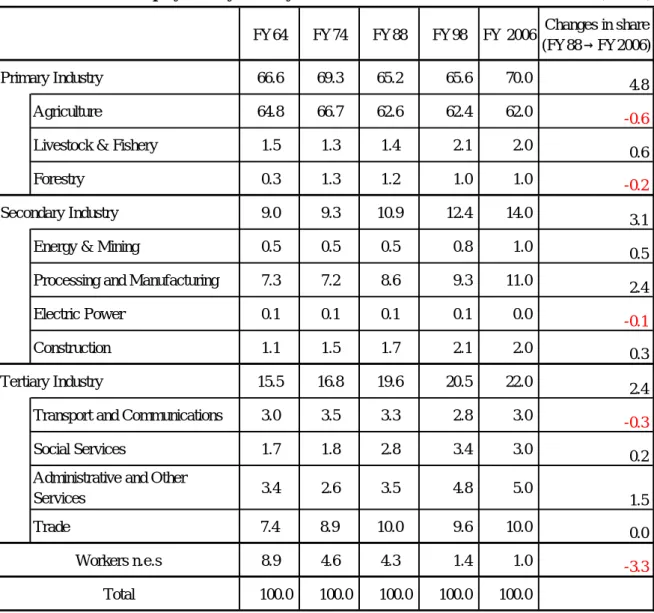
(21) 2.3 Labor force Labor force statistics are another indicator of industrial structural changes. Through what is generally known as Petty-Clark’s law, as economic development progresses, as measured by per capita income, the relative importance of the primary sector falls, in terms of both production and labor force, while that of the secondary sector and then the tertiary sector rises. Table 5 shows changes in labor force distribution by industry. In FY2006, the agriculture sector constituted more than 60% of the total labor force, followed by processing and manufacturing (11%) and trade (10%), while all the other sectors each constituted 5% and less of the total labor force. The pattern of labor force distribution clearly shows the agrarian nature of the Myanmar economy. It also highlights the very static situation of Myanmar’s industrial structure. During the period between FY1988 and FY2007, changes of less than one percentage point occurred in the share of any industry, except the processing and manufacturing sector (2.4 percentage points) and the administrative and other services sector (1.5 percentage points); hence, dynamic structural changes are yet to be observed.. offices (which are in the northern, southern and eastern parts of Shan State and 13 other states). Reportedly, prefectural governors (military officers at the Lieutenant Colonel level) and commanders in military divisions (members of the National Peace Development Council at the Brigadier General and Major General levels) strongly influence statistics that are sent to senior organizations. It has long been pointed out that GDP is often inflated to make the rate of economic growth appear higher than it is. It is also possible that statistics may have been manipulated in various ways in different areas, depending on the particular nature and way of thinking of prefectural governors/commanders in military divisions. If so, the accuracy of statistics on national income in Myanmar is rather questionable. 20.
(22) (Unit:%). Table 5: Estimated employment by industry FY 2006. Changes in share (FY88→FY2006). 65.6. 70.0. 4.8. 62.6. 62.4. 62.0. -0.6. 1.3. 1.4. 2.1. 2.0. 0.6. 0.3. 1.3. 1.2. 1.0. 1.0. -0.2. 9.0. 9.3. 10.9. 12.4. 14.0. 3.1. Energy & Mining. 0.5. 0.5. 0.5. 0.8. 1.0. 0.5. Processing and Manufacturing. 7.3. 7.2. 8.6. 9.3. 11.0. 2.4. Electric Power. 0.1. 0.1. 0.1. 0.1. 0.0. -0.1. Construction. 1.1. 1.5. 1.7. 2.1. 2.0. 0.3. 15.5. 16.8. 19.6. 20.5. 22.0. 2.4. Transport and Communications. 3.0. 3.5. 3.3. 2.8. 3.0. -0.3. Social Services. 1.7. 1.8. 2.8. 3.4. 3.0. 0.2. Administrative and Other Services. 3.4. 2.6. 3.5. 4.8. 5.0. Trade. 7.4. 8.9. 10.0. 9.6. 10.0. 0.0. 8.9. 4.6. 4.3. 1.4. 1.0. -3.3. 100.0. 100.0. 100.0. 100.0. 100.0. FY64. FY74. FY88. Primary Industry. 66.6. 69.3. 65.2. Agriculture. 64.8. 66.7. Livestock & Fishery. 1.5. Forestry Secondary Industry. Tertiary Industry. Workers n.e.s Total. FY98. 1.5. (Source) MNPED, Review (various issues); and CSO, Statistical Yearbook (various issues).. We can calculate each sector’s relative productivity (or relative income) from Tables 4 and 5. Relative productivity is the ratio of the labor productivity of an industry (Yi/Li, where Yi stands for the income of industry i and Li stands for the labor force of industry i) divided by the labor productivity of the whole economy (Y/L, where Y denotes national income and L denotes total labor force). In practice, relative productivity can be calculated as the ratio of the share of nominal GDP (Table 4) divided by the share of labor force (Table 5), as shown in the following equation: 21.
(23) (Yi/Li) / (Y/L) = (Yi/Y) / (Li/L). If the figure for relative productivity in an industry exceeds 1, the industry has better than average labor productivity.. Figure 3: Relative productivity of major industries and groups of related industries 1.6 1.4 1.2. Agriculture. 1.0. Primary Industry Processing and Manufacturing. 0.8. Secondary Industry 0.6. Tertiary Industry. 0.4 0.2 0.0 FY1988. 1998. 2006. (Note) Average labor productivity equals 1.0. (Source) Calculated from the figures given in Table 4 and 5.. Figure 3 shows relative productivity of major industries and groups of related industries. While the agriculture sector increased its relative productivity for the period between FY1988 and FY1998, secondary industry including processing and manufacturing declined its relative productivity for the same period. As have discussed, this was mainly due to the improvement of terms of trade of agricultural produce over industrial goods. However, entering the twenty-first century, the trend has been reversed. The secondary sector including manufacturing increased its relative productivity for the period between FY1998 and FY2006.. 22.
(24) 3. THE IMPACT OF ECONOMIC REFORMS ON OWNERSHIP STRUCTURE In order to ascertain industrial structural changes, it is also important to examine shifts in ownership patterns, especially, as in the case of Myanmar, when transitioning from a centrally-planned economy, where the state sector is a major player, to a market-oriented economy, where the private sector is expected to play a major role. In this section, we examine the impact of economic reforms on ownership patterns.. 3.1 GDP The economic reforms of the military government began with the open-door policy and the recognition of private businesses. The government announced the FIL in November 1988 and opened the doors to foreign investment after a 25-year hiatus. It also announced the SEEs Law in March 1989, in which the Law conferring powers for Establishing the Socialist Economic System, 1965 was repealed. In other words, the military government officially renounced the Burmese Way to Socialism by promulgating this law. The SEEs Law stipulated 12 economic enterprises that the SEEs would continue to monopolize.3 By stipulating the 12 enterprises exclusive to SEEs, the government conversely allowed the private sector to enter other fields. In other words, the industrial policy for private sector participation in the national economy changed from “banned in principle” to “allowed in principle”. Under these policies, the private sector has gained momentum. Those are (a) extraction of teak and sale of the same in the country and abroad; (b) cultivation and conservation of forest plantation; (c) exploration, extraction, and sale of petroleum and natural gas and production of products of the same; (d) exploration and extraction of pearls, jade, and precious stones and export of the same; (e) breeding and production of fish and prawns in fisheries which have been reserved for research by the Government; (f) Postal and Telecommunications Service; (g) Air Transport Service and Railway Transport Service; (h) Banking Service and Insurance Service; (i) Broadcasting Service and Television Service; (j) exploration and extraction of metals and export of the same; (k) Electricity Generating Services other than those permitted by law to private and co-operative electricity generating services; (l) manufacture of products relating to security and defense which the Government has, from time to time, prescribed by notification.. 3. 23.
(25) Table 6: Real GDP by industry and ownership (%. % point) FY1986 Share. State. Co-operative. FY1998 Private. Share. Ⅰ Goods 61.3 11.9 5.3 82.7 59.6 1 Agriculture 40.3 0.1 6.4 93.4 34.5 2 Livestock & Fishery 7.3 1.3 2.6 96.2 7.2 3 Forestry 1.3 38.0 4.4 57.6 1.0 Primary Industry 49.0 1.3 5.8 92.9 42.7 4 Energy 0.2 5 Mining 0.9 89.8 2.2 8.0 1.6 6 Process & Manufacturing 9.2 41.6 4.2 54.2 9.2 7 Electric Power 0.5 100.0 0.0 0.0 1.0 8 Construction 1.7 88.3 1.0 10.8 4.9 Secondary Industry 12.4 54.0 3.4 42.6 16.9 Ⅱ Services 15.5 60.6 2.5 36.9 19.3 1 Transportation 3.6 36.0 4.9 59.1 4.3 2 Communications 0.5 100.0 0.0 0.0 1.9 3 Financial Institutions 2.6 98.9 1.1 0.0 2.0 4 Social & Admin Services 4.8 98.8 1.2 0.0 6.8 5 Rentals & Other Services 4.1 9.0 3.2 87.8 4.3 Ⅲ Trade 23.1 33.9 13.5 52.6 21.1 Tertiary Industry 38.7 44.6 9.1 46.3 40.4 Gross Domestic Product 100.0 24.6 6.8 68.6 100.0 (Source) MNPED, Review (various issues); and CSO, Statistical Yearbook (various issues).. State 11.4 0.2 0.3 46.2 1.3 99.9 10.8 28.2 99.9 45.8 36.9 54.5 29.8 100.0 54.8 88.8 3.9 21.3 37.2 21.8. FY2007. Co-operative 1.4 1.9 1.1 0.6 1.8 0.1 1.0 0.9 0.1 0.2 0.7 2.6 1.0 0.0 14.4 0.5 2.9 2.4 2.5 1.9. Private 87.2 97.9 98.6 53.2 97.0 0.0 88.2 70.8 0.0 54.0 62.4 43.0 69.2 0.0 30.7 10.7 93.3 76.3 60.3 76.3. 24. share 63.5 35.6 7.5 0.5 43.7 0.2 0.5 15.0 0.2 4.0 19.8 14.8 10.9 1.3 0.1 0.9 1.6 21.6 36.5 100.0. Changes in Shares of Private Sector. State. Cooperative. Private. -. -. -. 0.4 0.1 50.0 -. 2.4 0.7 0.3 -. 76.3 2.9 9.2 79.5 60.1 14.8 1.5 100.0 68.9 76.9 0.4 5.0 7.8. 9.3 0.2 0.2 0.3 0.0 0.1 0.1 0.0 3.8 0.2 0.4 2.4 1.5. 97.2 99.2 49.7 14.4 96.9 90.6 20.2 39.9 85.0 98.4 0.0 27.3 22.9 99.1 92.7 90.7. Changes (FY86-FY98). 4.5 4.5 2.5 -4.4 4.1. Changes (FY98-FY07). -0.7 Decontrol of trade of agricultural produce 0.5 Development of private enterprises -3.5 Strengthened conservation of forests -. 80.2 16.6 0.0 43.2 19.9 6.1 10.1 0.0 30.7 10.7 5.4 23.7 14.0 7.7. Major Factors for Changes. -. 14.4 Entry restrictions by SEEs Law 8.7 Provision of mining concession 19.7 Development of SMIs 20.2 Entry restrictions by SEEs Law -14.1 Entry of SMEs and NPT construction 42.1 29.3 Development of private enterprises 0.0 Entry ban by SEEs Law -3.4 Lift of entry ban by LAW 12.2 New entry to social services 5.9 Development of private enterprises 16.4 Development of private enterprises 14.4.
(26) Table 6 shows real GDP by industry and ownership. Thus far, figures for nominal GDP have mainly been used to view industrial structural changes. However, the data for GDP by industry and ownership are only available in real GDP terms; hence the use of real GDP figures in this section. Firstly, it is noticeable in Table 6 that the private sector accounted for about 70% of real GDP even in FY1986, which was in the midst of the socialist regime. This high proportion of real GDP accounted for by the private sector in Myanmar contrasts sharply with that of other transitional economies in Central and Eastern Europe, where the state played a major role in the economy during the socialist period. The significance of the private sector in Myanmar’s economy was largely due to the agriculture sector, as the biggest industry, accounting for about 40% of real GDP in FY1986, having long been categorized as mostly in the private sector in GDP statistics. However, it should be noted that even though the private sector contributed to more than 90% of the agriculture sector in both FY1986 and FY1998, in reality it is substantially different between the two periods. Throughout the socialist period, agriculture was not collectivized and land holdings remained in the hands of small farmers. In this sense, it may not be wrong to categorize the agriculture sector as a private one. Nevertheless, farmers were under strict state control at that time. They could not grow what they wanted, but had to cultivate their lands according to government policy and planning. Nor could they sell their produce freely at market prices, but had to sell most of their produce to the state at lower prices, which were unilaterally fixed by the government. Farmers could not enjoy freedom of management in those days. In November 1987, the government decontrolled trade of the main agricultural produce, which had long been monopolized by the state under the socialist regime. Since then, farmers. 25.
(27) have been able to sell their products at market after selling a proportion to the state. After this, farmers have become more responsive to market forces, reacting positively to the price incentives. Farmers now enjoy a relatively larger freedom of management compared to the socialist era. In this way, even though the agricultural sector has always been categorized as “the private sector”, the real situation is totally different before and after 1988. Secondly, in contrast to the agriculture sector, some of the other sectors were largely occupied by SEEs, even in FY2007. Energy, Electric Power, Communications, and Social and Administration Services were mostly monopolized by the state. The state also controlled substantial shares of Forestry, Construction, and Financial Institutions. Many of the said industries that were monopolized or dominated by the state are on the list of 12 industries exclusively for the SEEs. But an exception clause (Section 4 of the SEEs Law) exists whereby, with a view to the interest of the state, private business enterprises may be allowed to enter the 12 industries in the form of joint-ventures with SEEs or even in the form of pure private ownership. Accordingly, many private companies, including foreign ones, have invested in some of 12 enterprises. Large-scale foreign investments in Yadana and Yetagon natural gas exploration are good examples. On the other hand, although the entry ban to industries such as Forestry, Construction, and Financial Institutions was lifted, still large-scale SEEs persist, giving the state a considerable share of those industries. Thirdly, in spite of the remaining entry barriers, and other restrictions, the private sector positively reacted to industrial liberalization. The participation of the private sector increased particularly in Mining, Process and Manufacturing, Construction, Transportation and Financial Institutions, in fact, the share of the private sector increased in all industries except Forestry from FY1986 to FY2007. The government provided mining concessions to private enterprises in order to enhance production and thereby obtain revenue. The share of the. 26.
(28) private sector in Mining rose from 8.0% in FY1986 to 96.9% in FY2007. As for Construction, private construction companies mushroomed along with the construction mini-boom which started in the early 1990s but had burst by mid-1997. Regarding the Financial Institutions sector, although it was one of the 12 enterprises exclusively for SEEs, the establishment of private financial institutions was allowed by the Financial Institutions of Myanmar Law, enacted in July 1990. Under to this Law, 20 private banks were established since 1992, but only 14 now remain.4 The share of GDP of private sector financial institutions increased rapidly from zero in 1991 to 42% in FY2002 before the domestic banking crisis, after which it decreased to 27% in FY2007. The share of the private sector in the Processing and Manufacturing sector has also substantially and steadily increased since FY1986, and reached to more than 90% in FY2007, mainly due to the emerging small and medium-sized industries (SMIs). The same case is applicable to the Trade sector. All these figures point to the active participation of the private sector in the national economy. As entry barriers and restrictions imposed upon private businesses are lifted, the participation of the private sector in economic activities is further enhanced, even in the industries that are still monopolized or controlled by the predominant SEEs. Myanmar’s private sector is active and efficient enough to respond to government liberalization policies. Myanmar’s private sector has demonstrated its resilience by surviving the socialist period and its ability to participate in the national economy once the market economy was revived. Given equal chances, the private sector will actively penetrate most economic sectors and contribute to economic development; this is an important finding in this section.. 3.2 Business registration. 4. However, foreign banks are not yet permitted to operate. 27.
(29) As the private sector takes an increasing role in the national economy, business entities registered with the authorities concerned have mushroomed. Table 7 shows the number of various kinds of businesses, the data for which was collected from several sources such as the Directorate of Hotels and Tourism, the Directorate of Investment and Company Administration, and the Directorate of Trade. Almost certainly there is some overlapping and double counting in the table. For example, Myanmar Companies Limited can be organized according to the Burma Companies Act (1913) and Partnership Firms can be established according to the Partnership Act (1932). When these companies or partnerships engage in external trade, they must obtain export and import licenses from the Ministry of Commerce and are thus counted as Exporters and as Importers too. In the same way, hoteliers have to obtain a business license from the Ministry of Hotels and Tourism and are therefore counted as a Hotel Business in Table 7. If a hotel also runs a tourist business, it may be registered as a Tourist Enterprise as well. Tourist Enterprises and Tourist Transport Businesses may also overlap. Moreover, some entities may be just paper companies not engaged in any actual business. For these reasons, we must remain aware that the data in Table 7 may contain overlapping, double counted, and empty figures.. 28.
(30) Table 7: Number of registered exporters, importers, limited companies, partnerships and joint-venture companies limited FY1989 FY1997 FY2000 FY2001 FY2002 FY2003 FY2004 FY2005 1 Exporters 770 8931 15142 1350 1231 777 920 1089 2 Importers 216 3 Business Representatives 183 2076 2230 74 48 44 41 27 4 Myanmar Companies Limited 174 10844 15418 9596 10444 11266 12512 14376 5 Partnership Firms 376 1214 1264 1264 1269 1269 1270 1270 6 Foreign Companies and Branches 39 1184 1414 1410 1446 1456 1466 1477 7 Joint Venture Companies Ltd.. *. 15 7 8. (a) SEE and Private Entrepreneurs. (b) SEE and Foreign Companies 8 JV Companies Ltd. formed under Foreign Investment Law 9 Other Organizations 10 Tourist Enterprises 11 Tourist Transport Business 12 Hotel Business 13 Lodging-House Business 14 Tour Guide Business Total. -. 123 31 92 78. 3 1776. 35 474 1642 302 198 2767 29868. FY2006 1591. FY2007 1054. FY2008 1221. 19 14234 1270 1489. 19 14876 1270 1494. 13 16656 1072 1258. 60 45 15. 64 50 14. 66 52 14. 66 52 14. 66 52 14. 66 52 14. 66 52 14. 66 52 14. 67 52 15. 116 39 601 423 343 178 5034 42262. 77 39 601 423 336 178 5019 20431. 77 40 568 357 353 174 5442 21515. 79 40 536 397 375 161 6028 22494. 80 41 594 352 405 165 6069 23981. 81 41 700 378 427 168 6327 26427. 81 41 678 442 438 168 4157 24674. 82 41 697 465 462 156 4278 24960. 117 41 767 310 476 148 4701 26847. *. (Note) Excluding those under Foreign Investment Law. Exporters include Importers since FY1992. (Source) MNPED, Review (various issues); and CSO, Statistical Yearbook (various issues).. 29.
(31) Bearing such shortcomings in mind, it can be seen from Table 7 that, firstly, there is a significant increase in the number of various business entities registered, increasing by 15 times from the total of 1,776 as of FY1989 to 26,847 as of FY2008. Of course, not all of them would be truly new entries, some having already existed and just registered with the authorities concerned according to newly promulgated laws. Nevertheless, it can be safely said that the private sector responded positively to the market-oriented policy and started up businesses. Secondly, although the number of various business entities shows strong growth until the end of the 1990s, since then the growth rate has slowed and declined further due to the economic downturn. FY2001 saw a major decline in the numbers of Exporters/Importers and Myanmar Companies Limited, probably due to the changes of the government policy. Thirdly, the so-called formalization of business entities is observed. The share of Exporters and Importers, which are generally regarded as simple business entities, substantially declined from 55% in FY 1989 to 4.5% in FY 2008. Similarly, the share of Partnership Firms, which are also regarded as simple business entities, declined from 21% to 4% in the same period. Contrary to these, Myanmar Companies Ltd., that is, formal business entities, increased its share from 10% in FY 1989 to 62. in FY 2008. This is what may be termed the formalization. of business entities. Lastly, tourism-related businesses recorded a high growth rate. The aggregated share of tourism-related businesses, covering 10 to 14 in Table 7, increased from 3% in FY 1992 to 24% in FY 2008. However, the increased number of registered tourism-related businesses does not necessarily indicate the prosperity of tourism in Myanmar. For example, there are many tour guides who registered themselves with the authorities concerned but could not find. 30.
(32) a job in the tourism sector due to stagnant tourism in Myanmar. The number of overseas visitors jumped from 170,143 in FY1995 to 310,298 in FY1996 due to the Visit Myanmar Year campaign, and recorded 345,829 in FY1998. However, visitor numbers suffered a downturn, falling to 309,418 in FY1999. Tourist arrivals reached a peak of 448,135 in FY2006, then showed a decline in FY2007 to 363,976. The number of tourism-related businesses has declined since 2007 after demonstrations by monks in some major cities.. 4. PRIVATE MANUFACTURING FIRMS In the previous sections, we reviewed the changes in industrial structure from the aspects of GDP, labor force, and business registration. A drastic industrial change, namely, industrialization, was not observed during the 1990s and the first decade of the twenty-first century. However, when visiting some of the newly established industrial zones in Yangon, one is able to get a real sense of the vitality that exists in the nation's manufacturing industry, which goes beyond the impressions given by the above-mentioned macro-economic indices. This vitality is supported by manufacturing industries in the private sector. In FY1986, the private sector accounted for 54.2% in the processing and manufacturing sector, yet by FY2007 this share recorded more than 90%. The industrial development in Myanmar can be solely attributed to the growth of private enterprises.. 4.1 Statistics regarding the manufacturing industry Statistics related to the manufacturing industry are available from three major sources: a. statistics regarding plants and establishments contained in the Review, b. statistics regarding. 31.
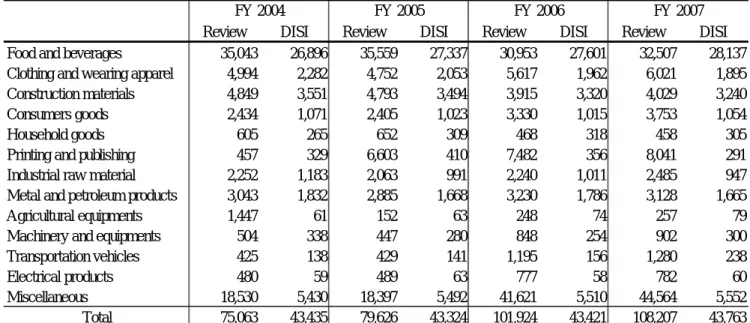
(33) private plants and establishments that have registered with the Directorate of Industrial Supervision and Inspection (DISI), Ministry of Industry (1), and c. statistics on 18 industrial zones which fall under the umbrella of the Myanmar Industrial Development Committee (MIDC). The first source covers private, cooperative, and state-owned enterprises. The second source covers only private factories and establishments that registered with the DISI, and basically excludes very small businesses such as cottage industries. The Private Industrial Enterprise Law (November 1990) stipulates that enterprises using power equipment of 3HP or over or which have 10 or more employees (except companies involved in joint ventures with state-owned enterprises) must register with the DISI. Private enterprises with power equipment of less than 3HP or which have fewer than 10 employees and those in the manual industry (irrespective of the number of employees) can register with the Department of Household Industry, Ministry of Cooperatives, based on the Promotion of Cottage Industries Law (October 1991), although this registration is neither compulsory nor obligatory.5 The relationship between the two kinds of statistics can be seen from Table 8. When the figures of various sectors are compared, large gaps are seen to exist between them. The differences between those are quite anomalous, and the DISI figures are usually much smaller than the Review. Reportedly, there exist quite a few factories that are not yet registered with the DISI. This means the DISI statistics involve only a portion of the currently existing plants and establishments in the country. Such incompleteness and inconsistency regarding the statistics leads to an ambiguous picture of the actual situation regarding the nation's private manufacturing industry.. The third source covers only private factories and establishments in 18 industrial zones. However, the author was not able to obtain the data. In this section, we use only the first and second sources. 5. 32.
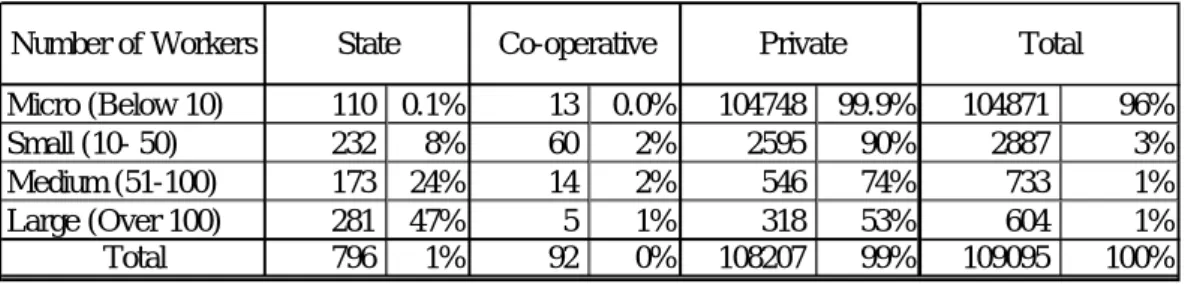
(34) Table 8: Private factories and establishments from two sources FY 2004 FY 2005 FY 2006 FY 2007 Review DISI Review DISI Review DISI Review DISI Food and beverages 35,043 26,896 35,559 27,337 30,953 27,601 32,507 28,137 Clothing and wearing apparel 4,994 2,282 4,752 2,053 5,617 1,962 6,021 1,895 Construction materials 4,849 3,551 4,793 3,494 3,915 3,320 4,029 3,240 Consumers goods 2,434 1,071 2,405 1,023 3,330 1,015 3,753 1,054 Household goods 605 265 652 309 468 318 458 305 Printing and publishing 457 329 6,603 410 7,482 356 8,041 291 Industrial raw material 2,252 1,183 2,063 991 2,240 1,011 2,485 947 Metal and petroleum products 3,043 1,832 2,885 1,668 3,230 1,786 3,128 1,665 Agricultural equipments 1,447 61 152 63 248 74 257 79 Machinery and equipments 504 338 447 280 848 254 902 300 Transportation vehicles 425 138 429 141 1,195 156 1,280 238 Electrical products 480 59 489 63 777 58 782 60 Miscellaneous 18,530 5,430 18,397 5,492 41,621 5,510 44,564 5,552 Total 75,063 43,435 79,626 43,324 101,924 43,421 108,207 43,763 (Source) MNPED, Review (various issues); and DISI.. 4.2 Growth of private manufacturing Table 9 shows the ownership pattern of factories and establishment by size, measured in terms of number of employees. Most of the manufacturing enterprises in Myanmar are micro-sized establishments with fewer than 10 workers, which account for 96% of the total in FY2007. Among them, 99.9% are owned by private entrepreneurs. On the other hand, state economic enterprises constitute 47% of large-scale factories, which accounts, however, for only 1% of total establishments. Thus, the ownership structure of the manufacturing sector in Myanmar is characterized as one with a small number of large-scale state-owned economic enterprises and a large number of micro and small private establishments.. 33.
(35) Table 9: Factories and establishments by number of workers as of FY2007 Number of Workers. State. Micro (Below 10) Small (10- 50) Medium (51-100) Large (Over 100) Total. 110 0.1% 232 8% 173 24% 281 47% 796 1%. Co-operative 13 60 14 5 92. Private. 0.0% 2% 2% 1% 0%. 104748 2595 546 318 108207. 99.9% 90% 74% 53% 99%. Total 104871 2887 733 604 109095. 96% 3% 1% 1% 100%. (Note) The ratios of columns of State, Co-operative and Private are ones as of each row's number of factories and establishments. The ratio of column of Total is one as of total number of factories and establishments. (Source) M NPED, Review (various issues); and CSO, Statistical Yearbook (various issues).. Tables 10 and 11 show the development of private industries that registered with the DISI.6 According to the Private Industrial Enterprise Law enacted in November 1990, any private industrial enterprise using 3HP and with 10 or more wage-earning workers shall register themselves with the DISI. Then Procedures relating to the Private Industrial Enterprise Law were issued on February 1, 1991. In the Procedures, the authorities concerned requested that existing private industrial enterprises apply for registration within 120 days from February 1, 1991. If they applied for registration within 120 days, then they would be allowed to continue their production activities before receiving any directive from the Directorate. The number of registrations jumped from 27 in FY1990 to 23,848 in FY1991. However, the growth of registered number stabilized in the following fiscal year: it increased by only 5.2%, recording 25,081 in FY1992. It can be said that almost all private enterprises that should be registered according to the Law and Procedures and had intentions to do so had actually registered by the end of FY1991. Thus, increases in the figures of registered industries after FY1992 can generally be regarded as new entrants.. Industries are classified using the two-digit classifying method of ISIC. The Ministry of Industry (1) has revised the Myanmar standard industry classification (BSIC, 1952 version) based on the 1990 version of the International Standard Industry Classification (ISIC).. 6. 34.
(36) Table 10: Registered private industries by product group, 1992-1999 1992 Product group Food products Tobacco products Textiles. 1999. 13,406. 60,537. 4.5. 56%. 54%. 22,106. 92,922. 4.2. 63%. 54%. 22,152. 93,957. 4.2. 62%. 51%. 130. 868. 6.7. 1%. 1%. 149. 1,726. 11.6. 0%. 1%. 146. 1,913. 13.1. 0%. 1%. 1,520. 10,543. 6.9. 6%. 9%. 2,348. 17,334. 7.4. 7%. 10%. 2,093. 18,158. 8.7. 6%. 10%. 17. 230. 13.5. 0.1%. 0%. 69. 8,870. 128.6. 0%. 5%. 160. 12,863. 80.4. 0%. 7%. Wearing apparel Leather and its products. 1996. Av.no.of Share in Share in Av.no.of Share in Share in Av.no.of Share in Share in No.of estbts Employment No.of estbts Employment No.of estbts Employment employment no.of estbts employment employment no.of estbts employment employment no.of estbts employment. 133. 645. 4.8. 1%. 1%. 231. 1,232. 5.3. 1%. 1%. 289. 3,038. 10.5. 1%. 2%. Wood, wood products. 2,571. 13,797. 5.4. 11%. 12%. 2,647. 16,011. 6.0. 8%. 9%. 2,756. 17,243. 6.3. 8%. 9%. Paper and its products. 231. 973. 4.2. 1%. 1%. 250. 1,133. 4.5. 1%. 1%. 267. 1,299. 4.9. 1%. 1%. Publishing and printing. 251. 1,048. 4.2. 1%. 1%. 280. 1,223. 4.4. 1%. 1%. 285. 1,268. 4.4. 1%. 1%. Coke and petrol products. 1. 3. 3.0. 0%. 0%. 5. 40. 8.0. 0%. 0%. 5. 29. 5.8. 0%. 0%. Chemicals and its products. 399. 1,841. 4.6. 2%. 2%. 392. 1,874. 4.8. 1%. 1%. 411. 2,157. 5.2. 1%. 1%. Rubber and Plastics Other non-metallic mineral products. 637. 2,969. 4.7. 3%. 3%. 722. 3,951. 5.5. 2%. 2%. 733. 4,493. 6.1. 2%. 2%. 226. 1,081. 4.8. 1%. 1%. 270. 1,867. 6.9. 1%. 1%. 282. 2,104. 7.5. 1%. 1%. Basic metals. 539. 2,837. 5.3. 2%. 3%. 581. 3,356. 5.8. 2%. 2%. 607. 3,691. 6.1. 2%. 2%. Metal products. 661. 3,179. 4.8. 3%. 3%. 1,101. 5,380. 4.9. 3%. 3%. 1,206. 6,069. 5.0. 3%. 3%. Machinery and equipment Electrical, machinery and apparatus. 102. 424. 4.2. 0%. 0%. 353. 1,580. 4.5. 1%. 1%. 586. 3,408. 5.8. 2%. 2%. 293. 777. 2.7. 1%. 1%. 272. 911. 3.3. 1%. 1%. 255. 900. 3.5. 1%. 0%. 2. 6. 3.0. 0%. 0%. 4. 17. 4.3. 0%. 0%. 8. 22. 2.8. 0%. 0%. 4. 23. 5.8. 0%. 0%. 5. 27. 5.4. 0%. 0%. 7. 36. 5.1. 0%. 0%. 2,622. 8,751. 3.3. 11%. 8%. 2,871. 10,356. 3.6. 8%. 6%. 2,802. 10,275. 3.7. 8%. 6%. Radio,TV, others Medical and optical instrumen Motor vehicles and trailers Other transport equipment Furniture Total. 71. 300. 4.2. 0%. 0%. 103. 507. 4.9. 0%. 0%. 119. 500. 4.2. 0%. 0%. 301. 1,396. 4.6. 1%. 1%. 432. 2,105. 4.9. 1%. 1%. 428. 2,453. 5.7. 1%. 1%. 24,117. 112,228. 4.7. 100%. 100%. 35,191. 172,422. 4.9. 100%. 100%. 35,597. 185,876. 5.2. 100%. 100%. (Note) Av.No.of Employment stands for Average Number of Employment. Figures for 1999 is as of end of September 1999. (Source)DISI, Ministry of Industry (1).. 35.
(37) Table 11: Registered private industries by product group, 2000-2008 Product group. 2000 Food 23,478 Clothing 1,826 Shelter 3,086 Consumers goods 1,123 Household goods 282 Printing and publishing 341 Raw material 1,403 Metal and oil products 1,624 Agricultural equipments 47 Machinery and equipments 625 Transportation 86 Electrical products 40 General machinery 3,638 Total 37,599 (Source)DISI, Ministry of Industry (1).. 2001 23,689 1,830 3,193 1,112 290 345 1,380 1,610 48 685 86 48 3,938 38,254. 2002 23,885 1,589 3,295 1,126 215 355 1,322 1,759 48 680 83 47 4,107 38,511. 2003 26,161 2,378 3,507 1,129 196 340 1,259 1,787 52 718 79 54 4,769 42,429. 2004 26,896 2,282 3,551 1,071 265 329 1,183 1,832 61 338 138 59 5,430 43,435. 2005 27,337 2,053 3,494 1,023 309 410 991 1,668 63 280 141 63 5,492 43,324. 36. 2006 27,601 1,962 3,320 1,015 318 356 1,011 1,786 74 254 156 58 5,510 43,421. 2007 28,137 1,895 3,240 1,054 305 291 947 1,665 79 300 238 60 5,552 43,763. 2008 28,728 1,802 3,111 1,003 307 283 899 1,665 77 278 233 64 5,337 43,787.
(38) The number of registered private industries increased from 24,117 factories in 1992 to 35,597 in 1999, with an average annual growth rate of 5.7%. The growth of Garment (Wearing Apparel) was the highest, with a growth rate of 37.8% per annum, which was followed by Machinery and Equipment with 28.4%, Coke and Petrol Products with 25.8%, and Radio, TV, Communication Equipment Manufacturing with 21.9%. As registered industries increased, so too did their employment. Once again the Garment Industry recorded the highest growth rate, of 77.7% per annum. This was followed by Coke and Petrol Products with 38.3%, Machinery and Equipment with 34.7%, Leather and Leather Products with 24.8%, and Radio, TV, Communication Equipment Manufacturing with 20.4%. The average number of workers at Garment Industry establishments exceeded 80 workers per factory, whereas that of all manufacturing industries was just 5.2. As a result, the share of total employment by the Garment Industry increased from a negligible percentage in 1992 to 7% in 1999. Both domestic and foreign companies vigorously invested in Garment Industry and the number of garment factories is estimated to have reached more than 300 at its peak around 2000, making it surely one of the most vibrant industries in Myanmar.7 Apart from the garment industry, however, the industrial structure shown in Table 10 has not been much changed. Myanmar’s industry is still characterized by the extremely large share of agro-based consumer goods industries with less importance on heavy industries.8 The upgrading and diversification of the industrial sector in Myanmar has yet to be observed. Starting from 2000, the groups of registered private industries have changed from 21 product groups to 13 business types. The new industrial grouping is shown in Table 11. By comparing the figures for 2000 and 2008, in terms of percentage share, the food industry See Kudo [2010 forthcoming] for the growth and decline of garment industry in Myanmar in the 1990s and early 2000s. 8 Although Motor Vehicles and Trailers occupy 8% of total establishments, most of them are considered to be small and medium-size repair workshops. 7. 37.
(39) sector grew by 4% points, clothing and garment decreased by 1% point, general machineries grew by 2% points, and other industries remained the same.. 5. GEOGRAPHICAL DISTRIBUTION OF INDUSTRIES 5.1 Geographical distribution We next review the spatial distribution of plants and establishments. The sovereign territory of Myanmar is 1.8 times greater than that in Japan, and the country has diverse geographical and climatic aspects, with levels of industrial concentration that vary from district to district. Tables 12 show the number of privately owned plants in different divisions and states. In terms of the number of establishments, the greatest industrial concentration in 2000 was in the Mandalay Division (21%), followed by Yangon (14%), Bago (13%), Ayeyarwady (13%), and Sagaing (11%).9 The spatial distribution has not changed for the period between 2000 and 2009.. Yangon is the largest in terms of number of employees, production amount, and amount of investment, reflecting its size. 9. 38.
(40) Table12: Registered private industries by state and division No of establishment State / Division March 1997. March 2000. Population in 2000 as of 2009. Population %. Establishments/ Growth of no of 100person in estab (19972000) 2000. Mandalay Division 7,651 21.6% 7,655 21.2% 17.7% 6,574 13.4% 11.6 Yangon Division 5,466 15.5% 5,117 14.2% 14.0% 5,560 11.3% 9.2 Bago Division 4,358 12.3% 4,784 13.2% 10.9% 5,099 10.4% 9.4 Ayeyarwaddy Division 3,875 11.0% 4,690 13.0% 14.9% 6,779 13.8% 6.9 Sagaing Division 4,094 11.6% 3,986 11.0% 10.8% 5,488 11.2% 7.3 Shan State 1,943 5.5% 2,447 6.8% 8.6% 4,851 9.9% 5.0 Magway Division 2,228 6.3% 2,020 5.6% 5.1% 4,548 9.3% 4.4 Mon State 1,934 5.5% 1,778 4.9% 5.6% 2,502 5.1% 7.1 Tanithayi Division 1,121 3.2% 923 2.6% 2.0% 1,356 2.8% 6.8 Rakhine State 845 2.4% 909 2.5% 4.9% 2,744 5.6% 3.3 Kachin State 837 2.4% 781 2.2% 2.3% 1,272 2.6% 6.1 Kayin State 363 1.0% 423 1.2% 1.2% 1,489 3.0% 2.8 Chin State 380 1.1% 401 1.1% 1.2% 480 1.0% 8.4 Kayah State 253 0.7% 238 0.7% 0.8% 266 0.5% 8.9 Total 35,348 100.0% 36,152 100% 100% 49,008 100.0% 7.4 (Notes)* 13.5% for Bago Central; 15.0% for Bago West, ** 6.5% for Shan East; 11.2% for Shan South; 8.3% for Shan North. (Source)DISI, Ministry of Industry (1).. 39. GDP Growth in FY99. 0.02% 8.1% -2.2% 10.7% 3.2% 13.5/15.0* 6.6% 8.7% -0.9% 17.4% 8.0% 6.5/11.2/8.3** -3.2% 10.4% -2.8% 9.7% -6.3% 8.2% 2.5% 8.2% -2.3% 23.9% 5.2% 8.0% 1.8% 13.7% -2.0% 15.8% 0.8% 10.5%.
(41) Approximately 70% of privately owned plants are located in these five major divisions. The five major divisions together account for 82% of the total number of employees, 84% of production output, and 89% of total investment. With regard to industrial concentration density, the three largest divisions, namely, Mandalay, Yangon, and Bago, have more than nine plants per 100 people and constitute industrial areas of comparatively high concentration density within the country. From the above, it can be said that Yangon and Bago in the metropolitan zone and the suburbs of Mandalay, the second largest city, constitute two of the largest industrial concentration areas. In contrast, the number of plants per 100 people is small in Magway Division, Rakhine State, and Kayin State, which shows that industrial concentration has not progressed in these areas. Surprisingly, the industrial concentration density is comparatively high in the Chin and Kayah regions, which are located in mountainous areas like Rakhine and Kayin. This may be the result of erroneous statistical collection techniques, and therefore poses a problem when using this information together with other social and economic indices. The change in the number of plants from 1997 to 2000 also indicates different features by divisions and states. As previously mentioned, in FY1991, the Private Industrial Enterprise Law and relevant regulations on application procedures were enacted to initiate a registration system for privately owned plants. Thereafter, the rate of new registrations continued to markedly increase until FY1996, after which it slowed due to economic stagnation. Tables 12 shows that the number of privately owned plants registered per year increased 0.8% on an annual basis between the two periods. This is in sharp contrast to the nation's GDP which, according to the Myanmar government, continued to experience a rapid growth rate of 5.7%, 5.8%, and 10.9% for FY1997, FY1998, and FY1999, respectively. Furthermore, the. 40.
(42) processing and manufacturing industries attained even higher levels of growth, of 5.0%, 6.2%, and 15.6% for the same years. In order to boost value-added production without increasing the number of plants, it is necessary to increase per plant production capacity or the overall value of products. A major increase in per plant production capacity is not readily conceivable, since the distribution of plant size remains unchanged, with small-sized plants continuing to be dominant in the private sector. The value of products will not easily be increased either, since there have been no significant changes in the distribution of business categories. Although the possibility remains for increased production by state-owned plants, the ratio of processing and manufacturing industries in the state-owned sector has been on the decline as discussed in this paper. Therefore, the effects of large-scale production increases by state-owned plants, if any, will be limited. For these reasons, high growth rates in GDP were not conceivable in FY1987 and thereafter, as far as the changes in the number of plants. Different trends are observable in the changes between 1997 and 2000 by different regions. The number of plants increased 5-8% on average in Ayeyarwaddy Division, Shan State, and Khine State, and decreased 3-6% in Taninthayi Division, Magway Division, and Mon State, presumably reflecting different economic trends in the respective areas. Figures on the growth rate of GDP by division and state are available only for FY 1999. As far as these figures are concerned, however, there are no correlations between changes in the number of plants and economic trends. Since there are no statistics to indicate the changes in the distribution of business categories in different areas either, it remains unclear which business categories have increased or decreased.. 5.2 Features of some industrial clusters Table 13 summarizes the number of plants as of April 1997 in different divisions, states,. 41.
(43) and business categories. Figure 4 shows the number of plants in major business categories in the five major industry concentration areas, which were selected from Table 12. As already pointed out, about 70% of the privately owned plants registered at the DISI were concentrated in these five major areas, and the five business categories shown in Figure 4 accounted for 88% of the total.. 42.
(44) Table 13: Registered private oidustries by state and diision and by sector, as of 1997 Food products Tobacco products Textiles Wearing apparel Leather and its products 2). ISIC 15 16 17 18 19. 1. Kachin 569 1 5 -. Kayah 113 2. Kayin 240 1 -. Chin 375 -. Sagaing Thaninthayi 3113 776 15 344 3 15 -. Bago 3409 27 86 2 3. Magway Mandalay 1522 3055 27 41 282 1503 2 2 175. Mon 1208 6 5 -. Rakhine 641 2. Yangon 2504 7 108 64 33. Shan 1414 8 4 2. Ayeyarwaddy. 3269 12 15 1. Total 22208 145 2352 71 235. % 62.8% 0.4% 6.7% 0.2% 0.7%. Wood, wood products Paper and its products Publishing and printing Coke and petrol products Chemicals and its products Rubber and Plastics. 20 21 22 23 24 25. 188 1 -. 90 1 2 -. 46 1 4 2. -. 220 3 4 8 6. 63 7 3. 409 9 18 26 5. 113 5 1 28 3. 572 56 61 2 122 64. 164 7 6 22 87. 75 6 3 1. 449 140 150 142 510. 129 26 16 1 20 13. 151 3 4 15 3. 2669 251 276 3 390 697. 7.6% 0.7% 0.8% 0.0% 1.1% 2.0%. Other non-metallic mineral products Basic metals Metal products Machinery and equipment. 26 27 28 29. 2 2 18 -. 8 5 -. 2 3 17 2. 1 -. 43 40 39 19. 3 6 30 -. 21 23 53 15. 8 15 26 14. 79 211 468 197. 13 9 33 6. 1 5 2. 66 264 330 89. 7 4 55 13. 25 11 41 28. 278 589 1120 385. 0.8% 1.7% 3.2% 1.1%. Electrical, machinery and apparatus Radio,TV, others Medical and optical instruments Motor vehicles and trailers Other transport equipment Furniture Total. 31 32 33 34 35 36. 5 41 5 837 2.4%. 3 26 2 1 253 0.7%. 9 6 30 363 1.0%. 4 380 1.1%. 33 184 5 4094 11.6%. 9 176 3 45 1121 3.2%. 1 200 13 38 4358 12.3%. 1 1 176 2 2 2228 6.3%. 41 1 945 15 41 7651 21.6%. 77 154 17 120 1934 5.5%. 2 100 4 3 845 2.4%. 45 3 3 434 34 91 5466 15.5%. 30 1 1 180 4 15 1943 5.5%. 13 235 6 43 3875 11.0%. 269 5 5 2861 100 439 35348 100.0%. 0.8% 0.0% 0.0% 8.1% 0.3% 1.2% 100%. 1). (Notes) International standard for industrial classification. (Source)DISI, Ministry of Industry (1).. 2). excluding furniture.. 43.
(45) Figure 4: Number of private industries in major regions by business categories, as of April 1997 8000 7000 6000 Food products. 5000. Textiles 4000. Wood, wood products Metal products. 3000. Motor vehicles and trailers Others. 2000 1000 0 Sagaing. Bago. Mandalay. Yangon. Ayeyarwaddy. 44. Others.
Figure



+6


Related documents
