Expansion of Dental Benefits Under the
Medicare Advantage Program
Robert D. Compton, D.D.S.
Abstract: Uninsured older adults are twice as likely to not receive needed dental care as their insured counterparts. Yet, nearly one-third of older adults have untreated dental caries, and older adults are more likely to have complete tooth loss, periodontal disease, and oral cancer. Moreover, persons sixty-five and older had the lowest percentage of individuals with dental insurance and the highest average out-of-pocket expenses of all persons with a dental visit in 2000. Given that retiree health benefits for large companies have declined from 66 percent in 1988 to 38 percent in 2003, it is unlikely that the private sector will increase funding for dental benefits for the elderly. However, some Medicare managed care plans already cover either preventive or comprehensive dental benefits. The Medicare Prescription Drug, Improvement, and Modernization Act of 2003 created incentives for Medicare managed care plans to offer beneficiaries additional benefits, including dental. The First Seniority Dental Plan, described in this article, demonstrates that it is possible to create a dental plan that is affordable for the HMO, reimburses providers at reasonable rates, provides a reduction in costs to Medicare beneficiaries, and may present a method to expand dental benefits for elders of the future.
Dr. Compton is Chief Dental Officer, Delta Dental Plan of Massachusetts and is Lecturer in the Department of Oral Health Policy and Epidemiology, Harvard School of Dental Medicine. Direct correspondence and requests for reprints to him at Delta Dental Plan of Massachusetts, 465 Medford St., Boston, MA 02129; 617-886-1016 phone; 617-886-1650 fax;
F
ew things are as important to quality of life as our health. However, in the United States, in-dividuals without health insurance are less likely to receive the health care they need. This rela-tionship also holds true for dental insurance and is a contributing factor to oral health.1 For older adults,the impact of this association is substantial since those sixty-five and older have the lowest percentage of individuals with dental insurance based on age (Fig-ure 1). Moreover, nearly one-third of the elderly have untreated dental caries and, in general, are more likely to suffer from severe conditions like edentulism, periodontal disease, and oral cancer.2
Despite the low availability of dental insurance in the elderly population, it appears that these indi-viduals still continue to value oral health in that a significant proportion of the elderly uninsured vis-ited a dentist in 1995 (Figure 1).3 The impact of this
can be seen in the fact that this population had the highest mean out-of-pocket expense per person for those who had a dental visit in 2000 (Table 1).4 While
the mean out-of-pocket costs for all persons having a dental visit was $237 in the United States in 2000, the mean out-of-pocket costs for those sixty-five and older was $400, and for those with only Medicare coverage it was $550. For the elderly as a whole and for elders with only Medicare (Medicare does not cover dental care), these self-paid dental care costs translated to 76.7 percent and 86.8 percent of the total cost of care, respectively. Self-paid dental care costs were only 49.3 percent for the population as a whole.
Private dental insurance in the United States is associated with employment benefits, and few em-ployers provide dental benefits for retirees. This is not likely to change, since several studies5-9 have
demon-strated that the trend for employer-paid medical health insurance for retirees has steadily declined. Kaiser reported that retiree benefit offerings from companies with 200 or more employees declined from 66 per-cent in 1988 to 38 perper-cent in 2003.5 Only 10 percent
of firms smaller than 200 workers offered them in 2003. If employers are not going to provide a benefit, then the challenge becomes identifying a source of funding for the elderly that spreads the risk across larger populations. It is unlikely that in the near future any one source or solution will provide the answer to this problem. However, one such limited program al-ready exists. It would be worthwhile to study this ap-proach and explore whether it could be expanded to include more people. That program is the inclusion of dental benefits under the Medicare Advantage pro-gram (Medicare+Choice prior to 2004).
This article will present information on the Medicare Advantage program in general and more specific details about one such program known as the First Seniority Dental Plan that existed up until 2001. It will present information about the sponsor-ing organization, development of the benefit plan, which populations could be covered, benefit plan type, the level of care covered, premium payments, out-of-pocket costs to beneficiaries, annualized costs
to beneficiaries, advantages and disadvantages, and some concluding remarks.
Sponsoring Organization
The first issue that needs to be addressed when proposing a health plan is that of financing. Accord-ing to the Organization for Economic Cooperation and Development’s International Classification for Health Accounts,10 there are three sources of
financ-ing: 1) private social health insurance; 2) social se-curity (organized and controlled by government for the population at large); and 3) other health insur-ance corporations (mainly individual contracts). In the United States, medical coverage through social security accounts is available through Medicare and Medicaid programs administered by the Centers for Medicare and Medicaid Services (CMS).
Medicare is a federal program of health care coverage provided pursuant to title XVIII of the So-cial Security Act of 1965.11 It has two parts: Part A
and Part B. Part A, which is also referred to as Hos-pital Insurance (HI), is compulsory and includes in-patient hospital stays, posthospitalization care in skilled nursing homes, and in-hospital but not
out-patient drugs. Part B, also known as Supplementary Medical Insurance (SMI), is voluntary and includes doctors’ services, outpatient hospital care, durable medical equipment, and some other medical services not covered in Part A. Medicare beneficiaries in tra-ditional Medicare can purchase Part B coverage through Medigap for a monthly premium of $78.20 in 2005, which represents a 17 percent increase (the largest in Medicare’s forty-year history) from the $66.60 charged in 2004. Dental services are specifi-cally excluded from Part A in Section 1862. Even Part B excludes dental from traditional Medicare if it is “a primary service (regardless of cause or com-plexity) provided for the care, treatment, removal, or replacement of teeth or structures directly sup-porting teeth, e.g., preparation of the mouth for den-tures, removal of diseased teeth in an infected jaw.”12
In 1972, prepaid medical programs were added to Medicare but few people joined them. However, following the 1970s health care crisis, when the medical Consumer Price Index (CPI) was increas-ing from 8 to 12 percent per year, Congress passed the Tax Equity and Fiscal Responsibility Act of 1982 and created incentives for more beneficiaries to choose HMOs over traditional fee-for-service Medi-care. The government offered to pay participating
Figure 1. Percent with a dental visit in last year, by age groups, education, and income factors, United States, 1995
Source: Dental service use and dental insurance coverage—United States, behavioral risk factor surveillance system, 1995. Rockville, MD: Center for Disease Control and Prevention, December 1997.
0% 10% 20% 30% 40% 50% 60% 70% 80% 90% 100% Total 18-24 25-34 35-44 45-54 55-64 65 and over Education <12 Education >12 Income <$15,000 Income >$34,999 Visited Dentist Insured
HMOs on a risk basis at 95 percent of the average Medicare per capita fee-for-service costs in their re-spective counties.13 Since managed care plans had
lower costs than fee-for-service plans, the HMOs were expected to use the excess payment to attract more beneficiaries by either providing additional benefits or lowering the beneficiary’s cost-sharing. The HMOs ended up attracting healthier enrollees who were less expensive to serve than traditional Medicare.14 Since HMOs were reimbursed based on
the average per capita fee-for-service costs for all beneficiaries and not for similarly healthy benefi-ciaries, the HMO enrollees actually cost Medicare more than if they had been in traditional Medicare.
The Balanced Budget Act of 1997 created the Medicare+Choice program in the hope of correcting this overpayment while further expanding participa-tion in private managed care plans. That year the Congressional Budget Office (CBO) forecast that 22 percent of eligible Medicare beneficiaries would be in private plans by 2001.15 However, the number of
beneficiaries in managed care stood at about 11 per-cent in 2003. This happened because the Balanced Budget Act of 1997 created new payment formulas that typically limited urban Medicare+Choice plans to a 2 percent per year increase during a time when their health inflation trends were increasing by double digits.16 As a result, many of the HMOs experienced
financial difficulties and began either exiting the pro-gram or greatly cutting back on the additional ben-efits not mandated by Medicare. This affected 328,000 Medicare+Choice enrollees in 2000 and 925,000 enrollees in 2001.17 This was part of the
rea-son for the discontinuation of the First Seniority Dental Plan in Massachusetts.
The Medicare Prescription Drug, Improve-ment, and Modernization Act of 2003 corrected the reimbursement formulas. Specifically, Title II Medi-care Advantage replaced MediMedi-care+Choice in an at-tempt to modernize and revitalize the private sector plans under Medicare, in the hope of again expand-ing enrollment in private plans. Medicare-eligible individuals can now choose between the traditional Medicare Plan (sometimes referred to as the fee-for-service plan) and four types of Medicare Advantage Plans offered by private companies:Medicare Man-aged Care Plans; Medicare Private Fee-for-Service Plans; Medicare Preferred Provider Organization Plans (PPOs are a new player in this market); and Medicare Specialty Plans. The CBO in December 2003 projected that this change would increase Medi-care costs by $14 billion over what it would cost to provide traditional Medicare during the next decade.18
Biles et al. have calculated that Medicare will pay private plans an average of “$546 more for each of the 5 million Medicare enrollees in managed care” in 2005 than they would have paid in traditional fee-for-service for those same individuals.19 Their study
found that “extra payments per enrollee range from more than $1,500 in Hawaii, New Mexico, North Carolina, North Dakota, Oregon and Wisconsin to less than $200 in Florida, Nevada and Texas.” Fur-thermore, the Medicare Prescription Drug, Improve-ment, and Modernization Act of 2003 explicitly in-creases Medicare costs in these private plans through at least 2013.
There will be many competing ideas about what to do with that excess payment. Some plans will want to reduce the out-of-pocket expense for premiums to beneficiaries in order to attract more customers.
Table 1. Dental visits, expenses, and source of payments by selected population characteristics, United States, 2000
Population characteristic Mean expense per person Mean out-of-pocket expense Percent out of pocket with a visit (dollars) per person with visit (dollars)
Total population 480 237 49.3
65+ total 522 400 76.7
By insurance status
65+, Medicare only 634 550 86.8
65+, Medicare & private 483 351 72.6 65+, Medicare & public 363 164 45.1 Under 65, any private 498 220 44.1
Under 65, public only 277 75 26.9
Under 65, uninsured 404 322 79.8
Source: Dental services: use, expenses, and sources of payment, 1996-2000. Washington, DC: U.S. Department of Health and Human Services, Agency for Healthcare Research and Quality, January 2004.
Others may add new benefits. In the past, Medicare+Choice plans added such benefits as physical exams (91.8 percent of Medi-care+Choice plans), vision ex-ams (86.6 percent), prescription drugs (67.3 percent), hearing exams (66.4 percent), and pre-ventive dental benefits (29.0 percent) to their standard pack-ages at no additional cost to members (Table 2).20 An
oppor-tunity exists to expand the Part B dental benefits to more Medi-care Advantage plans and ben-eficiaries.
The First Seniority Dental Plan was created by the addition of a dental benefit to the Medicare+Choice plan offered by a Massachusetts HMO
(Harvard Pilgrim Health Care). The medical HMO subcontracted the administration of the dental HMO (DHMO) to a dental benefit administrator, Delta Dental Plan of Massachusetts. It was discontinued in 2001 by the HMO—in part, due to cuts in pay-ments made by Congress.
Plan Development
Although the First Seniority Dental Plan was discontinued in 2001, many Medicare managed care plans offer dental care. Of the managed care plans, 29 percent already provide preventive dental care as part of their standard benefit package, and 11.1 per-cent provide it for an additional monthly premium.20
Comprehensive dental care is offered by 9.4 percent of plans under their standard package, and 9.1 per-cent provide it for an additional monthly premium (Table 2). The number of participating managed care plans peaked in 1998 at 34621 and had declined to
145 plans as of February 2004.
Population Covered
The Medicare program covers approximately forty-one million Americans who are aged sixty-five or older, certain disabled people under age sixty-five, and individuals with End-Stage Renal Disease, which is a permanent kidney failure requiring dialysis or kidney transplant. According to CMS, almost 61
percent of beneficiaries lived in an area where they could enroll in a Medicare managed care plan in 2002, down from 74 percent in 1998,22 and about 20
percent have already done so, comprising roughly 11 percent of the total Medicare population. The Medicare managed care population peaked in 2000 at about 6.5 million and has declined to about 4.6 million by 2003 (Figure 2). However, enrollment has increased every month since plans began receiving increased funding in March 2004.
At the height of the First Seniority Dental Plan, there were approximately 65,000 members. The population was 56 percent female and 44 percent male. The age distribution for those members who were reported as using the benefit in 1997 was as follows: age sixty-five to seventy years, 43 percent; age seventy-one to seventy-five, 31 percent; age sev-enty-six to eighty, 14 percent; age eighty-one to eighty-five, 9 percent; and age eighty-six and over, 3 percent. Medicare beneficiaries who enrolled in the HMO’s medical plan were automatically enrolled in the dental plan. Their legal dependents were not covered under the beneficiary’s benefits but may have been eligible independently as a beneficiary.
Plan Type
The program offered by the First Seniority Dental Plan was a comprehensive dental HMO that reimbursed providers in a closed panel network us-ing a modified capitation methodology. The
reim-Table 2. Percentage of Medicare+Choice plans offering select additional benefits in 2003
Standard Additional
package benefits premium Total Additional benefit (percentage) (percentage) (percentage) Physical exams 91.8 0.0 91.8 Vision exams 86.6 1.3 87.9 Health education/wellness 73.1 0.0 73.1 Prescription drugs 67.3 3.1 70.4 Hearing exams 66.4 0.2 66.2 Eyewear 60.1 4.5 64.6 Hearing aids 35.6 0.9 36.5 Preventive dental 29.0 11.1 40.1 Comprehensive dental 9.4 9.1 18.5
The numbers represent the percentage of M+C plans that offered each additional benefit. The Additional Premium column represents the percentage of M+C plans that offered the benefit for an additional monthly premium to the beneficiary.
Source: 2003 data compendium (VI) providers/suppliers: Medicare benefit and premium summary Medicare+Choice coordinated care plans. Washington, DC: Centers for Medicare and Medicaid Services, 2004.
bursement included a monthly capitation payment based on a per-member (beneficiary) per-month rate plus member copayments for specific procedures (Table 3). In addition, the dental administrator pro-vided a stop-loss to ensure that providers were not negatively impacted by adverse selection.
The program required that all eligible mem-bers be assigned to a primary care dentist in the closed panel network. Members were given an opportunity to select a primary care dentist at the initial enroll-ment event. Those who did not actively choose a primary care dentist were assigned to the closest pro-vider to their home address and were notified of the assignment. Members had an opportunity to change primary care dentists once a month. Assigning all members to primary care dentists and disbursing all capitation funds were important, since using a capitated reimbursement mechanism shifted finan-cial risk to the primary care dentists.
The medical HMO negotiated a per-member per-month administrative fee with the dental admin-istrator and a separate treatment member per-month rate to be paid to the primary care dentists. The primary care dentists could choose Option A and receive a monthly capitated amount that included payment for covered specialty procedures. Or they could choose Option B and have the specific spe-cialty procedures carved out for referral and receive
a lower monthly capitated amount. The dental ad-ministrator created a risk pool for specialty care un-der Option B for members of dental offices who chose to refer specialty care. In 1997 the monthly per-mem-ber per-month for Option A was $4.37 and Option B was $3.93. If the member was covered under Med-icaid, he or she would be classified as “Dually En-titled” and a higher monthly capitated amount under each option would be paid. Because few state Med-icaid programs still cover adults, this article will not examine that aspect of the First Seniority Dental Plan. The dental administrator’s stop-loss program guaranteed the primary care dentist a minimum hourly rate of compensation for services rendered to protect the provider from adverse selection. This pro-gram used a “relative-time unit” to determine the number of hours expended in providing treatment to members (Table 3). The administrator then guaran-teed that the dentist’s hourly rate would not drop below $110 per chair-hour in 1997. The hourly rate was determined by using data from the American Dental Association’s survey on dentists’ income for the New England region. The average hourly rate was calculated by dividing the average annual gross revenue by the average number of hours worked in a year. It was assumed that the average dentist worked out of two chairs. The average chair-hour revenue was calculated by dividing the average hourly rate
Figure 2. Medicare managed care beneficiary count and percent of total Medicare population
Source: Enrollment data from the Centers for Medicare and Medicaid Services, Washington, D.C.
28 0 1 2 3 4 5 6 7 1990 1995 1997 1998 1999 2000 2001 2002 2003 Enrollment (millions) 0% 2% 4% 6% 8% 10% 12% 14% 16% 18% % of Total Medicaid Population Enrollment Percent
by two. This was the amount that each dental chair needed to generate in order to reach the dentist’s annual gross revenue.
The stop-loss guarantee was designed to not only protect dentists from adverse selection but also to encourage dental offices to submit utilization data. Since the insurance portion of the patient’s liability was a prepaid, fixed monthly capitation payment, there was little incentive for dentists to submit utili-zation data. The stop-loss was calculated on a quar-terly basis. In 1997, of the 177 primary care dental billing sites (includes group practices that had sev-eral dentists but submitted claim forms as one bill-ing office), only five offices did not average the guar-anteed $110 per chair-hour. The guarantee was
evaluated and adjusted annually and reached $125 per chair-hour by 2000.
Excluding offices that did not submit utiliza-tion data as well as offices that averaged $400 or more per hour, the average chair-hour revenue for dental offices was $227 in 1997. Dental offices re-ported in 1997 that only 33 percent of eligible mem-bers received some services and that eventually in-creased to about 45 percent by 2000. In 1997, 14.1 percent of the dentists who had 4.5 percent of the members did not submit any utilization data despite the provider stop-loss program. It is also doubtful that the dental offices that averaged over $400 per chair-hour were reporting all the services that their members received.
Table 3. Top 20 procedures First Seniority Dental (FSD) members received in terms of total costs using 1997 median dental fees.
DHMO FSD Median Discount Code Description RTU* Copay† Copay Fee‡ (Percent)§ 02750 Crown, single restoration—porcelain fused to high
noble metal 90 150 345 735 53%
01110 Prophylaxis adults 30 0 10 53 81% 06750 Crown, fixed partial denture retainer—porcelain fused
to high noble metal 90 150 345 734 53% 05214 Lower partial denture—metal base framework 120 150 430 844 49% 06240 Pontic—porcelain fused to high noble metal 30 150 340 722 53% 05110 Complete denture—upper 120 140 395 754 48% 07110 Single tooth extraction 20 15 45 80 44% 00110 Initial oral examination 15 0 5 40 88% 03330 Root canal therapy—molar excluding final restoration 125 125 380 684 44% 05213 Upper partial denture—metal base framework 120 150 430 871 51% 02330 Composite-1 surface anterior 20 15 38 75 49% 04341 Periodontal root planing per quadrant 30 35 80 136 41% 00120 Periodic oral examination 10 0 5 21 76% 03310 Root canal therapy—anterior excluding final restoration 75 80 235 429 45% 02331 Composite 2 surfaces anterior 25 18 48 93 48% 05120 Complete denture, lower 120 140 395 743 47% 00210 Intraoral—full mouth x-rays including bitewings 20 0 14 77 82% 04260 Osseous surgery per quadrant 60 135 405 712 43% 02752 Crown—porcelain fused to noble metal 90 150 300 650 54% 03320 Root canal therapy—bicuspid excluding final restoration 100 95 290 509 43% The table represents the top 20 procedures as determined by the dollar value calculated by multiplying the frequency of procedures by the 1997 median fees.
*RTU is the relative time unit assigned each procedure.
†The DHMO Copay column data are from the Premium DHMO plan administered by Delta Dental Plan of MA (DDPMA) in 1997.
‡Median fees are the 50th percentile fees of the dentists submitting claims to DDPMA in 1997.
§Discount is calculated by dividing the FSD copay by the median fee.
Level of Care Covered
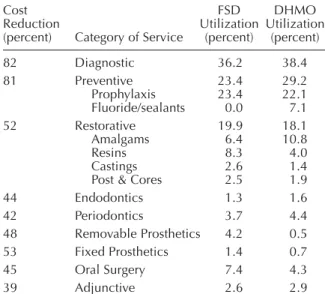
The level of benefits, exclusions, and limita-tions were similar to most commercially available dental HMO (DHMO) plans except that fixed and removable prostheses required a continuous twelve-month waiting period for replacement of existing prostheses. The First Seniority Dental Plan members’ utilization patterns were similar to other commer-cial DHMO groups except they tended to have resin restorations rather than amalgam; more castings and removable and fixed prostheses; and oral surgery (Table 4). In addition, in order to be reimbursed, all treatment had to be provided by the primary care dentist, referred by the primary care dentist to a par-ticipating specialist, or be a covered emergency ser-vice. Certain procedures required pretreatment re-view and could be limited to the least costly, professionally acceptable treatment that met the needs of the patient. If members chose the more ex-pensive alternative, they were responsible for the difference in benefit costs.
With respect to coverage provided by Medi-care Advantage Plans in 2004, those that provided preventive dental benefits typically allowed for one
or two examinations per year, two dental prophy-laxes, and one set of x-rays as part of the Preventive Package.
Program Costs
Premium Payments.The dental premium for
the First Seniority Dental Plan was a carve-out of the monthly medical premium received by the HMO from the federal government. The annual payment per member per year from the medical HMO to the dental administrator from 1997 to 2001 was $66. This included the administrative fee to the dental plan administrator as well as capitation payments to the primary care dentists for providing care to members. The members were automatically enrolled in the dental benefit with no additional monthly premium to them. Although the premium for a typical DHMO in 1997 was double this rate, this was offset by mem-ber copayments that were double those of the typi-cal DHMO (Table 3). The annual premium from the HMO did not increase from 1997 to 2001, when the program was discontinued. This price trend was con-sistent with premium trends at a national level that rose from $143.52 annually in 1997 to $148.32 in 2001.23
Although the CMS website provides some in-formation about the managed care plans offering dental benefits, it does not provide information about actual beneficiary premium costs related to the den-tal benefit for the 11.1 percent and 9.1 percent of Medicare Advantage plans that charge members a premium for preventive and comprehensive benefits, respectively.
Out-of-Pocket Costs to Participants.Because
the First Seniority Dental Plan was discontinued in 2001, detailed financial information about member out-of-pocket costs exists for only 1997. Since the First Seniority Dental Plan did not have any mem-ber premium contribution or any deductibles, the out-of-pocket costs were limited to member copayments and noncovered services. A copayment grid provided to members and network providers experienced only minor changes from 1997 to 2001. The member copayments accounted for 40.7 percent and the monthly capitation payment accounted for 59.3 per-cent of the payments made to primary care dentists in 1997. These copayments, based on utilization pat-terns and median fees charged by dentists, repre-sented, on average, a 59 percent reduction in cost for members with a range of 39 percent (adjunctive ser-vices) to 82 percent (diagnostic serser-vices) (Table 4).
Table 4. Utilization profile of the First Seniority Dental (FSD) Medicare population compared to a commercial DHMO in 1997
Cost FSD DHMO
Reduction Utilization Utilization (percent) Category of Service (percent) (percent) 82 Diagnostic 36.2 38.4 81 Preventive 23.4 29.2 Prophylaxis 23.4 22.1 Fluoride/sealants 0.0 7.1 52 Restorative 19.9 18.1 Amalgams 6.4 10.8 Resins 8.3 4.0 Castings 2.6 1.4 Post & Cores 2.5 1.9 44 Endodontics 1.3 1.6 42 Periodontics 3.7 4.4 48 Removable Prosthetics 4.2 0.5 53 Fixed Prosthetics 1.4 0.7 45 Oral Surgery 7.4 4.3 39 Adjunctive 2.6 2.9 The utilization percentage is determined by the total frequency of each category of service divided by the total frequency for all procedures submitted for the FSD program in 1997.
The reduction in cost is from the median 1997 fees of Delta Dental of Massachusetts.
Even with this dis-count, the combination of copayments, monthly capi-tation payments, and stop-loss payments reimbursed dentists at about 88 percent of the median fees for the services provided (Table 5). This high reimburse-ment percentage was achieved mainly because all members were assigned and all capitation funds disbursed to participating
dentists, whether the member used the benefit or not (except for money held in the risk pool for specialty referrals from dentists participating in Option B).
Services that were not covered benefits, such as cosmetic dentistry, could be charged to the mem-ber at the dentist’s usual fee. Any service that was not performed or referred by the member’s primary care dentist, or that was listed in the Exclusions and Limitations sections, was not covered and could be charged to the member at the dentist’s usual fee.
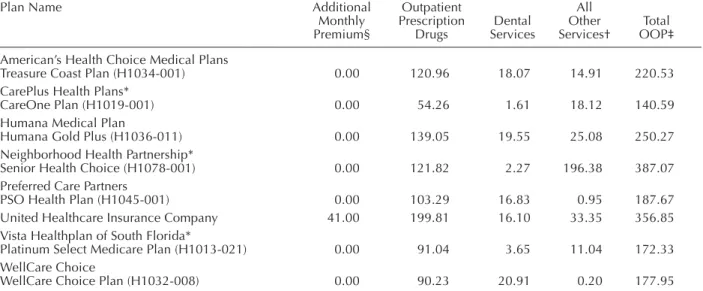
The CMS website provides information about projected out-of-pocket expenses for both dental benefits and total costs for all out-of-pocket expenses (Table 6).24 The three Florida Medicare Advantage
plans that provided more comprehensive care had out-of-pocket monthly projections for dental care ranging from $1.61 to $3.65 per month. Those plans that provided only limited preventive benefits had monthly dental out-of-pocket cost projections rang-ing from $16.10 to $20.91.
Table 6. Out-of-pocket expenses (in dollars) for six South Florida Medicare Advantage plans that offer dental benefits.
Plan Name Additional Outpatient All
Monthly Prescription Dental Other Total Premium§ Drugs Services Services† OOP‡ American’s Health Choice Medical Plans
Treasure Coast Plan (H1034-001) 0.00 120.96 18.07 14.91 220.53 CarePlus Health Plans*
CareOne Plan (H1019-001) 0.00 54.26 1.61 18.12 140.59 Humana Medical Plan
Humana Gold Plus (H1036-011) 0.00 139.05 19.55 25.08 250.27 Neighborhood Health Partnership*
Senior Health Choice (H1078-001) 0.00 121.82 2.27 196.38 387.07 Preferred Care Partners
PSO Health Plan (H1045-001) 0.00 103.29 16.83 0.95 187.67 United Healthcare Insurance Company 41.00 199.81 16.10 33.35 356.85 Vista Healthplan of South Florida*
Platinum Select Medicare Plan (H1013-021) 0.00 91.04 3.65 11.04 172.33 WellCare Choice
WellCare Choice Plan (H1032-008) 0.00 90.23 20.91 0.20 177.95 The above out-of-pocket expenses were obtained from the CMS website on September 13, 2004 and are meant to be representative of many plan options in South Florida that included dental benefits.
*Plans that indicated that they offered more dental treatment beyond preventive. §This premium is in addition to the Part B monthly premium of $66.60.
†Includes inpatient care out-of-pocket expenses.
‡Total OOP includes any additional monthly premium and Part B monthly premium of $66.60.
Source: Centers for Medicare and Medicaid Services
Table 5. Analysis of dentists’ revenue for offices submitting utilization data for First Seniority Dental (FSD) members in 1997
Total Per Utilizing Dollars Member (dollars) Capitation payments to dentists reporting utilization 2,308,363 122.35 Copayments from members of those dental offices 2,241,653 118.82 Stop-loss payments 1,149 0.06 Total paid to dentists reporting utilization 4,551,165 241.23 Value of services at 1997 median fees 5,162,725 273.65 Percent paid based on median fees 88% 88%
Annualized Costs for Participants
From 1997 to 2001 the per-member per-month payment from the medical HMO to the dental ad-ministrator was $5.50, which equaled $66 per mem-ber per year. This covered the administrative costs as well as treatment costs for the members. The mem-bers’ costs in terms of copayments for services ren-dered averaged $118.82 per year for those members reported as using the benefit (Table 5), which equated to a 59 percent fee reduction from median fees charged by dentists in 1997. This compared to $380 for those with only Medicare and $292 for those who had Medicare and other private insurance in 1997.4
Advantages
The Medicare Prescription Drug, Improve-ment, and Modernization Act of 2003 has created financial incentives for private managed care com-panies to enroll more Medicare beneficiaries in the belief that doing so will better control costs in the long term. Medicare paid managed care plans about 108 percent of the amount that would have been paid to traditional Medicare programs for the average enrolled beneficiary in 2003. When you consider the fact that managed care plans are treating healthier patients, they are actually being paid about 116 per-cent more.16 That is a significant increase in payment
over the fee-for-service cost of care. In addition, CMS added another 2.3 percent and 4.0 percent in 2004 and 2005 respectively. Thus, these managed care plans have additional revenue available to offer ad-ditional benefits to attract more beneficiaries. Over 40 percent of the Medicare Advantage plans already offer preventive dental benefits, and 18.5 percent offer comprehensive dental care.20 Although a good
start, it is far less than the 88 percent that offer vi-sion exams or the 66.6 percent that offer hearing exams.
Given that the average annual out-of-pocket expense per Medicare beneficiary who visited a den-tist in 2000 was $550 (Table 1), a dental benefit might be an attractive enticement to join a private Medi-care Advantage plan. A plan similar to the First Se-niority Dental Plan offered in Massachusetts could be relatively inexpensive and could be designed as a capitated plan or a reduced-fee PPO plan. Since Medicare Advantage plans are being expanded to include PPOs in 2006, there could be increased com-petition to attract these individuals. Underwriters can easily design a program that will meet the financial needs of any medical plan administrator and still
pro-vide the beneficiaries with a significant reduction in the cost of care.
Disadvantages
The biggest disadvantages are the limited num-ber of private managed care plans participating in Medicare, the low number of Medicare beneficia-ries participating in them, the low percentage of Medicare Advantage plans offering dental benefits, and the limited geographic access for these plans. The Pacific region has, by far, the largest penetra-tion of managed care plans, followed by the Mid-Atlantic region (Figure 3).25 Only seven states had
more than 20 percent of their Medicare population in HMOs in 2003: Rhode Island (32.5 percent), Cali-fornia (31.3 percent), Nevada (28.4 percent), Arizona (27.2 percent), Oregon (24.3 percent), Pennsylvania (23.6 percent), and Colorado (22.3 percent).19
Twenty-five states had less than 5 percent.
With respect to the number of HMOs partici-pating in Medicare, only 161 of the 481 operating nationwide did so in 2003, down from the 346 plans in 1998.25 In addition, two-thirds of Medicare
ben-eficiaries are now enrolled in just ten national man-aged care plans, due in part to industry consolida-tion.26 However, this could be an advantage if any of
those ten plans that have not already added dental benefits should decide to do so for all members in all regions. Furthermore, membership in all Medi-care HMOs has declined for four straight years from a high of 6.5 million in 2000 to 4.6 million by 2003. However, membership has been growing steadily every month since the effect of the Medicare Pre-scription Drug, Improvement, and Modernization Act of 2003 increased reimbursement beginning in March 2004.
The projected large federal deficits for the next several years may be a challenge to this model. Health care costs from 2004 to 2013 are projected to in-crease at a significantly greater rate (87 percent) than the Consumer Price Index (26 percent) or the Gross Domestic Product (33 percent).27 CMS has projected
that Medicare expenditures for the federal govern-ment from 2004 to 2013 will increase by 80 percent and that Medicaid costs will increase by 115 per-cent. Among the subcategories of Personal Health Care, Dental Services has the lowest projected cost increase (62 percent) and is significantly lower than such subcategories as Drugs (150 percent) and Re-tail Outlet Sales of Medical Products (131 percent).27
Although projected increases in private dental costs will be relatively low at 59 percent, projected
fed-eral and state/local government increases at 84 and 86 percent, respectively, will be high. Again, Med-icaid with a projected increase of 100 percent is the culprit.
Whether Medicare Advantage plans will con-sider dental benefits a good way to attract more ben-eficiaries, or whether beneficiaries themselves view dental as the most pressing financial need, is un-known. In 1999 the average out-of-pocket expense per eligible beneficiary for dental was only $189 (in-cludes those who didn’t visit a dentist) compared to $396 for prescription drugs and $774 for long-term care.28 Considering that the federal government
re-cently raised the beneficiary premiums 17 percent for Part B from $66.60 to $78.20 per month or $938 per year, both the managed care plans and the ben-eficiaries may find it more attractive to subsidize those costs. Even the out-of-pocket cost for physi-cian/supplier expense ($340) is almost double that of dental. Dental may not be something that benefi-ciaries demand.
Conclusion
As noted by the Organization for Economic Cooperation and Development, there are only three
sources of financing for health care: 1) private so-cial health insurance; 2) soso-cial security (organized and controlled by government for the population at large); and 3) other health insurance corporations (mainly individual contracts). Based on historical trends and surveys of employers, it is expected that private social health insurance plans will not be ex-panding to include more retirees. With respect to in-dividual contracts, there are practically no inin-dividual insured products in dentistry. There are some dis-count cards available to individuals, and there are some groups that aggregate individuals in a non-em-ployment relationship. For example, the American Association of Retired People has a group plan with Delta Dental Insurance Company (a subsidiary of Delta Dental Plan of California). Individuals can purchase private dental insurance through the group. However, it is not available everywhere and can be expensive. For example, the annual premium for Plan A for an individual in Atlanta, Georgia was $556.20.29
The third option, government sponsored benefits, is already a viable program in many Medicare Advan-tage plans. An opportunity may exist since the gov-ernment is paying Medicare Advantage plans sig-nificantly higher rates than their fee-for-service costs of business and there should be keen competition to gain this business. The addition of regional PPOs in 2006 should increase this competition and lead
man-Figure 3. Number of Medicare HMO members by region and the percentage of total members that are in MA plans
Source: Managed care digest series 2004: HMO-PPO/Medicare-Medicaid Digest. Vol. 8. Bridgewater, NJ: Aventis, 2004.
29
0.0% 5.0% 10.0% 15.0% 20.0% 25.0% 30.0% 35.0%% of Medicare HMO Members
% of Members 31.7% 21.5% 13.1% 8.8% 7.6% 7.5% 5.1% 4.6% West North Central 1,649,126 1,118,276 680,238 456,283 392,437 267,380 241,483 397,730 New England East North Central South Central Mountain South Atlantic Mid-Atlantic Pacific
aged care plans to seek competitive advantages. The challenge is presenting the business case to Medi-care Advantage plans to adopt dental benefits so that more elderly individuals in all regions of the coun-try are able to obtain the benefits and the quality of life they desire. It would be beneficial to study exist-ing Medicare plans with dental benefits in order to understand the economics and other drivers for add-ing dental benefits.
REFERENCES
1. Isman R, Isman B. Oral Health America white paper: ac-cess to oral health services in the U.S.: 1997 and beyond. Chicago: Oral Health America, 1997.
2. The oral health of older Americans. Rockville, MD: Cen-ter for Disease Control and Prevention, March 2001. 3. Dental service use and dental insurance coverage—United
States, behavioral risk factor surveillance system, 1995. Rockville, MD: Center for Disease Control and Preven-tion, December 1997.
4. Dental services: use, expenses, and sources of payments, 1996-2000. Washington, DC: U.S. Department of Health and Human Services, Agency for Healthcare Research and Quality, January 2004.
5. Employer health benefits: 2003. Washington, DC: Kaiser Family Foundation and Health Research and Educational Trust, 2003.
6. Retiree health benefits now and in the future. Washing-ton, DC: Kaiser Family Foundation and Health Research and Educational Trust, January 2004.
7. McArdle FB, Neuman P, Kitchman M, Kirland K, Yamamoto D. Large firms’ retiree health benefits before Medicare reform: 2003 survey results. Health Affairs, web exclusive, January 2004:W4-7.
8. McCormack LA, et al. Retiree health insurance: recent trends and tomorrow’s prospects. Health Care Financing Review 2002;23(3):17-34.
9. McCormack LA, Gabel JR, Whitmore H, Anderson WL, Pickreign J. Trends in retiree health benefits: health ben-efits for retirees are eroding even in the best of times. Health Affairs 2002;21(6):169-75.
10. ICHA-HF classification of health care financing. Europe: Organization for Economic Cooperation and Develop-ment, 2000.
11. Medicare information resource. Washington, DC: Cen-ters for Medicare and Medicaid Services. At: www.cms. hhs.gov/medicare/.
12. Oral health: Medicare dental coverage. Washington, DC: Centers for Medicare and Medicaid Services. At: www.cms.hhs.gov/oralhealth/2.asp.
13. Fact sheet: federal payment methodology to Medicare health plans. Washington, DC: Centers for Medicare and
Medicaid Services. At: www.cms.hhs.gov/media/press/ release.asp?Counter=978. Accessed: January 2005. 14. Medicare+Choice: payments exceed cost of
fee-for-ser-vice benefits, adding billions to spending. GAO/HEHS-00-161. Washington, DC: United States General Accounting Office, August 2000.
15. Predicting how changes in Medicare’s payment rates would affect risk-sector enrollment and costs. Washing-ton, DC: Congressional Budget Office, March 1997. 16. Berenson RA. Medicare disadvantaged and the search for
the elusive “level playing field.” Health Affairs, web ex-clusive, December 2004:W4:574-85.
17. Medicare+Choice: plan withdrawals indicate difficulty of providing choice while achieving savings. GAO/HEHS-00-183. Washington, DC: U.S. General Accounting Of-fice, September 2000.
18. The long-term budget outlook. Washington, DC: Congres-sional Budget Office, December 2003.
19. Biles B, Nicholas LH, Cooper BS. Issue brief: the cost of privatization—extra payments to Medicare Advantage plans, 2005 update. New York: The Commonwealth Fund, December 2004.
20. 2003 data compendium (VI) providers/suppliers: Medi-care benefit and premium summary MediMedi-care+Choice co-ordinated care plans. Washington, DC: Centers for Medicare and Medicaid Services, 2004.
21. Data from the monthly managed care report, 1987-2002. Table 76. Washington, DC: Centers for Medicare and Medicaid Services, 2003.
22. Percent of Medicare population with access to at least one Medicare+Choice coordinated care plan: program in-formation. Washington, DC: Centers for Medicare and Medicaid Services, June 2002.
23. 2002 dental benefits joint report. Chicago: Delta Dental Plans Association, June 2002.
24. Medicare personal plan finder: out-of-pocket costs (OOPC) breakdown for Florida, southern. Washington, DC: Centers for Medicare and Medicaid Services. At: www.medicare.gov/Compare Health Plan Options in Your Area. Accessed: September 13, 2004.
25. Managed care digest series 2004: HMO-PPO/Medicare-Medicaid Digest. Vol. 8. Bridgewater, NJ: Aventis, 2004. 26. Trends & indicators in the changing health care market-place, 2002—chartbook. Table 1.17: concentration of managed care enrollment, 1988-2000. Washington, DC. Centers for Medicare and Medicaid Services, 2004. 27. National health care expenditures projections tables.
Washington, DC: Centers for Medicare and Medicaid Services, 2004.
28. Data from the Medicare current beneficiary survey (MCBS), 1993 and 1999 cost and use files. Office of Re-search, Development, and Information. Washington, DC: Centers for Medicare and Medicaid Services, 2000. 29. AARP dental plan. At: www.deltadentalins.com/aarp.