This document and trademark(s) contained herein are protected by law as indicated in a notice appearing later in this work. This electronic representation of RAND intellectual property is provided for non-commercial use only. Unauthorized posting of RAND PDFs to a non-RAND Web site is prohibited. RAND PDFs are protected under copyright law. Permission is required from RAND to reproduce, or reuse in another form, any of our research documents for commercial use. For information on reprint and linking permissions, please see RAND Permissions.
Limited Electronic Distribution Rights Visit RAND at www.rand.org Explore RAND Education View document details
For More Information
from www.rand.org as a public service of the RAND Corporation.6
Jump down to document
CHILD POLICY CIVIL JUSTICE EDUCATION ENERGY AND ENVIRONMENT HEALTH AND HEALTH CARE INTERNATIONAL AFFAIRS NATIONAL SECURITY POPULATION AND AGING PUBLIC SAFETY SCIENCE AND TECHNOLOGY SUBSTANCE ABUSE TERRORISM AND HOMELAND SECURITY TRANSPORTATION AND INFRASTRUCTURE WORKFORCE AND WORKPLACE
The RAND Corporation is a nonprofit
research organization providing
objective analysis and effective
solutions that address the challenges
facing the public and private sectors
around the world.
Purchase this document Browse Books & Publications Make a charitable contribution
Support RAND
RAND monographs present major research findings that address the challenges facing the public and private sectors. All RAND mono-graphs undergo rigorous peer review to ensure high standards for research quality and objectivity.
Ron Zimmer, Brian Gill, Kevin Booker, Stephane Lavertu, Tim R. Sass, John Witte
Sponsored by several nonprofit foundations, including the Bill and Melinda Gates Foundation, Joyce Foundation, and William Penn Foundation
Charter Schools
in Eight States
Effects on Achievement, Attainment,
Integration, and Competition
The RAND Corporation is a nonprofit research organization providing objective analysis and effective solutions that address the challenges facing the public and private sectors around the world. RAND’s publications do not necessarily reflect the opinions of its research clients and sponsors.
R
®
is a registered trademark. © Copyright 2009 RAND CorporationPermission is given to duplicate this document for personal use only, as long as it is unaltered and complete. Copies may not be duplicated for commercial purposes. Unauthorized posting of RAND documents to a non-RAND Web site is prohibited. RAND documents are protected under copyright law. For information on reprint and linking permissions, please visit the RAND permissions page (http://www.rand.org/publications/permissions.html).
Published 2009 by the RAND Corporation
1776 Main Street, P.O. Box 2138, Santa Monica, CA 90407-2138 1200 South Hayes Street, Arlington, VA 22202-5050 4570 Fifth Avenue, Suite 600, Pittsburgh, PA 15213-2665
RAND URL: http://www.rand.org
To order RAND documents or to obtain additional information, contact Distribution Services: Telephone: (310) 451-7002;
Fax: (310) 451-6915; Email: [email protected]
foundations, including the Bill and Melinda Gates Foundation, the Joyce Foundation, and the William Penn Foundation.
Library of Congress Cataloging-in-Publication Data
Charter schools in eight states : effects on achievement, attainment, integration, and competition / Ron Zimmer [et al.].
p. cm.
Includes bibliographical references. ISBN 978-0-8330-4693-2 (pbk. : alk. paper)
1. Charter schools—United States—States—Case studies. I. Zimmer, Ron W. LB2806.36.C359 2009
371—dc22
iii
Charter schools are publicly funded schools that operate outside the direct control of local school districts, under a publicly issued charter that gives them greater autonomy than other public schools have over curriculum, instruction, and operations. The first U.S. charter school opened in 1992, and the scale of the charter movement has since grown to 4,000 schools and more than a million students in 40 states and the District of Columbia. With this growth has also come a contentious debate about the effects of the schools on their own students and on students in nearby traditional public schools (TPSs). In recent years, research has begun to inform this debate, but many of the key out-comes have not been adequately examined, or have been examined in only a few states. We do not know whether the conflicting conclusions of different studies reflect real differences in effects driven by variation in charter laws and policies or, instead, reflect differences in research approaches—some of which may be biased.
This book aims to inform the policy debate by examining four primary research questions in several geographic locations: (1) What are the characteristics of students transferring to charter schools? (2) What effect do charter schools have on test-score gains for students who transfer between TPSs and charter schools? (3) What is the effect of attending a charter high school on the probability of graduating and of entering college? (4) What effect does the introduction of char-ter schools have on test scores of students in nearby TPSs? We exam-ine similarities and differences in the answers to these questions across
locations, seeking insights about the policy levers that might be avail-able to improve the outcomes associated with charter schools.
This research was generously funded by several nonprofit foun-dations, including the Bill and Melinda Gates Foundation, the Joyce Foundation, and the William Penn Foundation. This is the capstone publication in the study, which previously produced two reports focus-ing on charter schools in Chicago (Booker, Gill, et al., 2008) and Phil-adelphia (Zimmer, Blanc, et al., 2008). This monograph builds on the previous work and expands in scope to include additional locations.
This report on the effects of charter schools in different cities and states across the country is consistent with RAND Education’s mission—to bring rigorous, objective information to the national debate on education policy. RAND Education identifies new trends, problems, and opportunities and strives to give the policy community and the American public a clearer picture of the choices they face in educating America’s citizens.
v Preface . . . iii Tables . . . .vii Summary . . . xi Acknowledgments . . . .xxi Abbreviations . . . xxiii CHAPTER ONE Introduction . . . 1
Geographic Locations Included in the Analysis . . . .3
Data Description . . . .3
CHAPTER TWO Students Transferring to Charter Schools . . . 7
Prior Achievement of Students Transferring to Charter Schools . . . .8
Transfers to Charters and Racial and Ethnic Stratification . . . .12
Chapter Summary . . . .19
CHAPTER THREE Student Achievement in Charter Schools . . . .21
Analytical Details . . . 26
Notes on Interpreting Results . . . .29
Sensitivity Tests. . . .32
Student Achievement in Virtual Charter Schools . . . .39
Student Achievement, by Age of Charter School . . . .41
Student Achievement, by Race . . . 46
Chapter Summary . . . 50
CHAPTER FOUR Educational Attainment Effects of Charter High Schools . . . .53
Data . . . .55
Results . . . .57
Probit Estimates of the Determinants of Educational Attainment . . . 60
Chapter Summary . . . .75
CHAPTER FIVE Competitive Effects of Charter Schools on Student Achievement in Traditional Public Schools . . . 77
Analytical Details . . . .78
CHAPTER SIX Implications for Policy and Research . . . .83
Key Findings . . . 84
Policy Implications . . . 86
Methodological and Research Implications . . . .91
APPENDIXES A. Data . . . .95
B. Chapter Three Regression Results . . . .105
C. Supporting Data . . . 117
D. Chapter Five Regression Results . . . 123
vii
1.1. Geographic Locations Included in the Analysis . . . .3
1.2. Data Included in the Analysis . . . .4
2.1. Average Prior Math and Reading Scores of Charter Movers and Other Students at the Traditional Public Schools That They Leave . . . .9
2.2. Charter and Traditional Public School Racial
Representation Across All Years in Our Data . . . .13
2.3. Traditional Public and Charter Peer Environments for Charter Movers, by Racial and Ethnic Background of
Student . . . .14
3.1. Initial Math and Reading Student Achievement Effects,
Averaged Across All Charter Schools in Each Jurisdiction . . . . .31
3.2. Descriptive Student Achievement Gains for Students Always in Charter Schools Relative to Students Who Transfer Between Charter Schools and Traditional Public Schools . . . .35
3.3. Estimated Impacts of Nonprimary Charter Schools . . . 38
3.4. Estimated Math and Reading Student Achievement Impacts in Virtual and Classroom-Based Charter Schools in Ohio . . . 40
3.5. Estimates for Math and Reading Student Achievement While Attending a Charter School, by Age of Charter
School . . . 42
3.6. Estimates for Math and Reading Student Achievement Effects, by Race or Ethnicity, Nonprimary Charter
Schools . . . 46
3.7. Standard Deviations of School-Level Achievement Effects, Charter and Traditional Public Schools . . . .49
4.1. Descriptive Statistics, by Transition Type . . . .58
4.2. Probit Estimates of Receiving a Standard High-School Diploma . . . .61
4.3. Probit Estimates of Attending a Two-Year or Four-Year College Within Five Years . . . .62
4.4. Mean Number of Schools Offering Grade 9, by Student Transition Type . . . 66
4.5. Probit Estimates of Attending a Charter High School in Grade 9, Based on Minimum Distance and Number of Schools of Given Type in Surrounding Area Offering Grade 9 in Relevant Year . . . .67
4.6. Bivariate Probit Estimates of Receiving a Standard High-School Diploma . . . .69
4.7. Bivariate Probit Estimates of Attending a Two-Year or Four-Year College Within Five Years . . . .70
4.8. Probit and Bivariate Probit Estimates of the Relationship Between Charter–High School Attendance and Educational Attainment in Florida from Alternative Samples and Models . . . .72
4.9. Probit and Bivariate Probit Estimates of the Relationship Between Charter–High School Attendance and Educational Attainment in Chicago from Alternative Samples and Models . . . .73
5.1. Estimates of Competitive Effects . . . .81
B.1. Detailed Initial Math Results for Table 3.1. . . .106
B.2. Detailed Initial Reading Results for Table 3.1 . . . .107
B.3. Detailed Math Results for Students Always in Charter Schools Relative to Students Who Transfer Between Charter Schools and Traditional Public Schools in Table 3.2 . . . .108
B.4. Detailed Reading Results for Students Always in Charter Schools Relative to Students Who Transfer Between Charter Schools and Traditional Public Schools in Table 3.2 . . . .109
B.5. Detailed Math Results for Nonprimary Charter Schools in Table 3.3 . . . 110
B.6. Detailed Reading Results for Nonprimary Charter Schools in Table 3.3 . . . 111
B.7. Detailed Math and Reading Results for Ohio Virtual
and Classroom-Based Charter Schools in Table 3.4 . . . 112
B.8. Detailed Math Results, by Age of Charter Schools, for
Table 3.5 . . . 113
B.9. Detailed Reading Results, by Age of Charter Schools,
for Table 3.5 . . . 114
B.10. Detailed Math Results, by Race and Ethnicity, for
Table 3.6 . . . 115
B.11. Detailed Reading Results, by Race and Ethnicity, for
Table 3.6 . . . 116
C.1. Tenth-Grade Location, by Type of Transition Between
Eighth and Ninth Grades . . . 117
C.2. Probit Estimates of Receiving a Standard High-School Diploma, Sample Restricted to Students Who Were in
the Same Type of School in Both Ninth and 10th Grades . . . 118
C.3. Probit Estimates of Attending a Two-Year or Four-Year College Within Five Years, Sample Restricted to
Students Who Were in the Same Type of School in Both Ninth and 10th Grades . . . 119
C.4. Ordinary Least Squares Estimates of the Determinants
of 10th-Grade Achievement-Test Scores . . . .120
C.5. Two-Stage Least Squares Estimates of the Determinants of 10th-Grade Achievement-Test Scores . . . .121
D.1. Detailed Math Results for Competitive Analysis Using Proximity to Charter Schools as a Proxy for Competition in Table 5.1 . . . .124
D.2. Detailed Reading Results for Competitive Analysis Using Proximity to Charter Schools as a Proxy for Competition in Table 5.1 . . . .125
D.3. Detailed Math Results for Competitive Analysis Using Number of Charter Schools Within 2.5 Miles as a Proxy for Competition in Table 5.1 . . . 126
D.4. Detailed Reading Results for Competitive Analysis Using Number of Charter Schools Within 2.5 Miles as a Proxy for Competition in Table 5.1 . . . 127
xi
Charter schools are publicly funded schools that operate outside the direct control of local school districts, under a publicly issued charter that gives them greater autonomy than other public schools have over curriculum, instruction, and operations. Their students (or the stu-dents’ parents) choose to attend the charter schools rather than being assigned to a school based on residential location. The first U.S. charter school opened in 1992, and the scale of the charter movement has since grown to 4,000 schools and more than a million students in 40 states and the District of Columbia. With this growth has also come a con-tentious debate. Supporters argue that charter schools can improve stu-dent achievement and attainment, serve as laboratories for innovation, provide choice to families that have few options, and promote healthy competition with traditional public schools (TPSs). Critics worry that charter schools perform no better (and, too often, worse) than TPSs, that they may exacerbate stratification by race and ability, and that they harm the students left in TPSs by skimming away financial resources and motivated families.
In recent years, research has begun to inform this debate, but many of the key outcomes have not been adequately examined or have been examined in only a few states. Moreover, questions about the validity of the findings of even the best-designed charter-school impact studies have remained, producing deep uncertainty about the interpretation of results. It has not been clear whether the conflicting conclusions of different studies reflect real differences in effects driven by variation
in charter laws and policies or, instead, reflect differences in research approaches—some of which may be methodologically flawed.
We set out to grow the evidence base and inform the debate on charter schools by examining four primary research questions across several geographic locations: (1) What are the characteristics of students transferring to charter schools? (2) What effect do charter schools have on test-score gains for students who transfer between TPSs and charter schools? (3) What is the effect of attending a charter high school on the probability of graduating and of entering college? (4) What effect does the introduction of charter schools have on test scores of students in nearby TPSs? We examine these questions using longitudinal, stu-dent-level achievement data from Chicago, San Diego, Philadelphia, Denver, Milwaukee, and the states of Ohio, Texas, and (for question 3 only) Florida. We discuss similarities and differences in charter-school effects across locations, considering whether any observed differences in effects might be related to differences in local charter laws and poli-cies. In conducting these analyses, we also shed light on key research and methodological issues relevant to past and future studies that aim to estimate the achievement effects of charter schools.
What Are the Characteristics of Students Transferring to Charter Schools?
We find no systematic evidence to support the fear that charter schools are skimming off the highest-achieving students. The prior test scores of students transferring into charter schools were near or below local (dis-trictwide or statewide) averages in every geographic location included in the study. In terms of prior achievement, in most sites, the transferring students did not differ substantially from other students in the TPSs they left: In a few sites, they were slightly higher achieving than their former peers; in other sites, they were slightly lower achieving, and, in Ohio and Texas, they were much lower achieving than their former peers. White students, who constituted a minority of charter entrants in all sites, deviated from the general pattern somewhat: In most sites,
white students entering charter schools were, on average, slightly higher achieving than the white students in their previous schools.
Transfers to charter schools did not create dramatic shifts in the sorting of students by race or ethnicity in any of the sites included in the study. In most sites, the racial composition of the charter schools entered by transferring students was similar to that of the TPSs from which the students came. There is some variation: Transfers to char-ter schools tend to marginally reduce racial integration in Philadelphia and in Texas while marginally increasing racial integration in Chicago. We find suggestive evidence that African American students are more likely to self-segregate: African American students transferring to char-ter schools moved to schools with higher concentrations of African American students in five of seven locales.
What Effect Do Charter Schools Have on Test-Score Gains for Students Who Transfer Between Traditional Public Schools and Charter Schools?
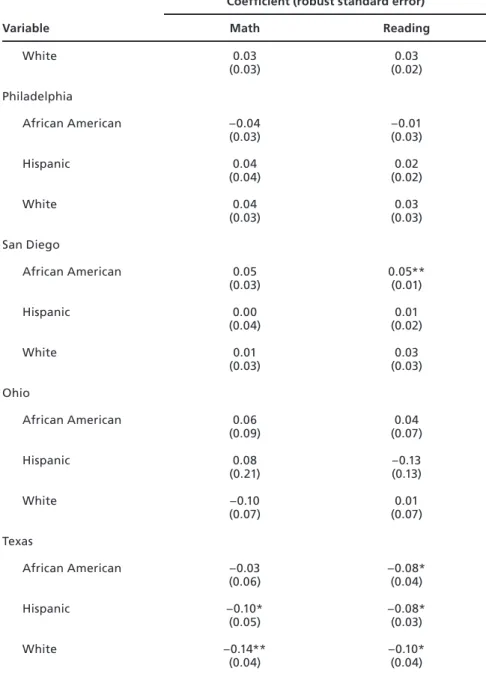
The average effect that charter schools are having on their students across grades K–12 is difficult to estimate, largely because prekinder-garten baseline test scores are unavailable to assess the achievement gains of students in elementary charters (as well as K–8 and K–12 char-ters). For charter schools with entry grades at the middle- and high-school levels (plus a handful of high-schools that begin in grades 3 and 4), for which we have baseline scores, we have greater confidence in the impact estimates. In five out of seven locales, these nonprimary charter schools are producing achievement gains that are, on average, neither substantially better nor substantially worse than those of local TPSs. In Chicago (in reading) and in Texas (in both reading and math), charter middle schools appear to be falling short of traditional public middle schools. Results that include charter schools at every tested grade level (i.e., those that start in kindergarten as well as those that serve exclu-sively middle- and high-school grades) are, in most cases, similar to the results that are limited to nonprimary charter schools, providing
no evidence that charter-school performance varies systematically by grade level.
The inclusion of kindergarten-entry charter schools in the anal-ysis makes a substantial difference to our estimate of their achieve-ment impacts in only one location. In Ohio, as in most of the other sites, the average performance of nonprimary charter schools is indis-tinguishable from that of nonprimary TPSs. But when the K-entry charter schools are included in the analysis, the estimated impact of Ohio’s charter schools is significantly and substantially negative. The dramatically lower estimated performance of Ohio’s K-entry charter schools appears to be attributable not to grade level per se but to virtual charter schools that use technology to deliver education to students in their homes. Virtual schools constitute a large part of the enrollment of K-entry charter schools in Ohio, and students have significantly and substantially lower achievement gains while attending virtual charter schools than they experience in TPSs. This result should be interpreted cautiously, because students who enroll in virtual charter schools may be quite unusual, and their prior achievement trajectories may not be good predictors of their future achievement trajectories.
In most locations, charter schools have difficulty raising stu-dent achievement in their first year of operation, typically producing achievement results that fall short of those of local TPSs. This is consis-tent with prior research and common sense and may not be a charter-specific phenomenon: Opening a new school is challenging, regardless of whether the school is a charter school. Across locations, we see a general pattern of improved performance as schools age.
Finally, charter schools in most locales have marginally greater variation in performance than TPSs, as measured by the achievement-impact estimate for each school, and, in some locations, this may simply reflect greater measurement error associated with the smaller average size of charter schools. Ohio is a notable exception: Its charter schools have a much wider range of variation in performance than its TPSs have.
What Is the Effect of Attending a Charter High School on the Probability of Graduating and of Entering College? This study was the first to examine the effects of charter schools on long-term attainment outcomes. In the two locations with attainment data (Florida and Chicago), attending a charter high school is associ-ated with statistically significant and substantial increases in the prob-ability of graduating and of enrolling in college. Among students who attended a charter middle school (for whom we can estimate impacts with greater confidence than for charter–high school students who came from conventional public middle schools), those who went on to attend a charter high school were 7 to 15 percentage points more likely to graduate than students who transitioned to a traditional public high school (controlling for observed student characteristics and test scores). Similarly, those attending a charter high school were 8 to 10 percent-age points more likely to enroll in college than were their TPS counter-parts. In Chicago, the advantage is most clearly evident in the charter high schools that include middle-school grades, eliminating the change of schools between middle and high school. However, readers should keep in mind that we cannot be certain that charter–high school stu-dents who attend traditional middle schools also experience these posi-tive effects. Nevertheless, our posiposi-tive results are promising and are not fully explained by estimated impacts on test scores, suggesting that researchers and policymakers need to look beyond test scores to fully assess charter schools’ performance.
What Effect Does the Introduction of Charter Schools Have on Test Scores of Students in Nearby Traditional Public Schools?
There is no evidence in any of the locations that charter schools are negatively affecting the achievement of students in nearby TPSs. But there is also little evidence of a positive competitive impact on nearby TPSs.
What Are the Policy Implications?
A quantitative evaluation of the relationship between charter-school effects and state policy would require data from many more than eight states. Nonetheless, we can inform policy by identifying outcomes that are consistent across sites and by examining outliers in the context of possible policy influences. We emphasize the modifier “possible” in dis-cussing policy influences: Strong causal inferences are difficult in all nonexperimental evaluations, and, with a limited sample of sites and policy variables, policy conclusions must remain tentative.
Findings on the students transferring to charter schools and on the integration effects are largely consistent across sites, suggesting that policymakers need have little fear of cream-skimming or of substantial increases in racial isolation. Relative to local averages, prior achieve-ment levels of charter entrants were particularly low in Texas, which could be attributable (at least in part) to the success of the provision in the state’s original charter law encouraging the establishment of charter schools for disadvantaged students.
The overall estimates of the average achievement impacts of char-ter schools can provide little guidance for policy, given that the validity of the estimates for elementary schools is in doubt. The estimates of the achievement impacts of nonprimary charter schools are more robust to methodological challenges, but they do not show great variation across sites, providing little purchase on the policy levers that might serve to improve the performance of charter schools. Nonetheless, some of the complementary achievement-impact analyses suggest useful guidance:
• Policymakers in every state with a charter law should look for ways to dampen the negative achievement impacts that are so fre-quently experienced by students enrolled in first-year charters. We cannot provide empirical evidence on specific strategies, but it is easy to imagine possibilities, including working with authorizers to ensure clear plans for the start-up period, providing additional start-up grants to approved operators, or reducing the reliance on brand-new start-up schools by easing the process for existing public or private schools to convert to charter status.
• Policymakers should closely examine the performance of virtual charter schools (in the states where they exist), conducting careful analysis to determine whether their negative achievement trajec-tories represent underperformance and, if so, identifying ways to improve that performance.
• Policy changes to improve or eliminate the low end of the charter-school performance distribution might be informed by examining the case of Ohio. Among the seven sites in which we conducted achievement analyses, Ohio is the outlier, with an especially wide range of variation. Greater variation in charter performance in Ohio could be related to the fact that the state’s charter law allows an unusually diverse group of organizations to serve as charter authorizers (Russo, 2005). It is also possible that the high varia-tion in performance of Ohio’s charters is partly related to resource constraints: A Thomas B. Fordham Institute report (2005) found that Ohio’s funding scheme for charter schools leaves them at a “severe” disadvantage relative to TPSs.
• Policymakers in Ohio and other states that experience high varia-tion in the performance of charter schools can view this as an opportunity: Eliminating or improving the lowest-performing charter schools has the potential to improve average results sub-stantially. This may not be easy; the challenge is to minimize the number of charter failures without sacrificing successful charter schools. The empirical record does not identify any surefire solu-tions, but various possibilities could be tried. Improving the per-formance of charter authorizers, both at the stage of authorization and in subsequent reviews of school performance, would be one place to start.
The promising results of the analysis of long-term effects of char-ter schools on educational attainment suggest at least two possibili-ties for policymakers to consider, with potential relevance for TPSs as well as charter schools. First, the favorable results for Chicago’s 6–12, 7–12, and K–12 charter schools suggest that school-district leaders and charter-school leaders alike might seriously consider eliminating the school transition between middle school and high school (although
the positive results seem to hold up for conventionally configured schools as well). The high-school transition is often a difficult one, and the simple strategy of keeping students in the same schools from sev-enth grade (or earlier) through 12th grade might reduce the dropout rate—perhaps even if the school is not a charter school. Second, the similarity of the charter attainment results to (some) previous results on Catholic schools suggests the possible value of seeking to replicate characteristics that charter and Catholic high schools have in common. We have no data on the extent to which charter high schools exhibit a similarly coherent mission-driven focus, but the ability to create such schools has often been cited by proponents of charters and other variet-ies of school choice (see, e.g., P. Hill, Foster, and Gendler, 1990; P. Hill, Pierce, and Guthrie, 1997; Whitman, 2008; and Mathews, 2009). The difference merits consideration by policymakers and further examina-tion by researchers.
The absence of evidence of substantial effects of charter schools on the achievement of students in nearby TPSs might be encouraging to policymakers who were concerned about negative effects and disap-pointing to policymakers who hoped that competition would induce TPSs to improve. Our findings support the hypothesis (see, e.g., F. Hess, 1999) that charter-school competition is unlikely to create a rising tide of school performance, in the absence of dramatic changes in the structures, incentives, culture, and operation of conventional school districts.
How Should Future Research Evaluate the Performance of Charter Schools?
This study makes clear that there are many bad ways to analyze charter-school performance. The validity of cross-sectional methods that rely on statistical controls for observable student characteristics is cast into doubt by results suggesting that students entering charter schools often have pretransfer achievement levels lower than those of local public-school students who have similar demographic characteristics. Longi-tudinal methods, such as those used in this study, have many hazards
as well, especially when used to assess the performance of charter ele-mentary schools; we therefore rely on them primarily to assess charter middle- and high-school effects.
Finally, one of the most important implications of our work for future research on charter schools is the need to move beyond test scores and broaden the scope of measures and questions examined. Our esti-mates of positive charter-school effects on high-school graduation and college entry are more encouraging than most of the test score–based studies to date (including our own test-score results). Future studies of charter schools should seek to examine a broad and deep range of student outcome measures and to provide evidence on the mechanisms producing positive long-term impacts.
xxi
Elaine Allensworth of the Consortium on Chicago School Research and Philip Gleason of Mathematica Policy Research served as techni-cal reviewers for this monograph and provided invaluable comments and suggestions, for which we are grateful. We are also grateful for the effort to develop and provide data from individuals in the various districts and states included in the monograph. In addition, we thank programmers Regan Main and Scott Ashwood along with RAND economist Gema Zamarro for their efforts to clean and manage data sets from various locations. We also appreciate the assistance of RAND senior economist Richard Buddin, who provided helpful suggestions and comments throughout our project, and administrative assistant Robert Hickam for his edits to the document. Finally, we thank the Bill and Melinda Gates Foundation, the Joyce Foundation, and the William Penn Foundation for their generous support in making this study possible.
xxiii
EDW K–20 Education Data Warehouse
FRAG Florida Resident Access Grant
GED® General Educational Development Test
ITBS Iowa Tests of Basic Skills
LEP limited English proficiency
NAEP National Assessment of Educational Progress
PSSA Pennsylvania System of School Assessment
Stanford 9 Stanford Achievement Test Series, Ninth Edition
TAAS Texas Assessment of Academic Skills
TAKS Texas Assessment of Knowledge and Skills
TPS traditional public school
1
Introduction
Over the past decade and a half, charter schools have been among the fastest-growing segments of the K–12 education market. Nationally, more than 4,000 charter schools have been established since the early 1990s, and they now serve more than 1 million students. They have spurred a contentious debate since their establishment. Supporters argue that charter schools can improve student achievement and attainment, serve as laboratories for innovation, provide choice to families that have few options, and promote healthy competition with traditional public schools (TPSs). Critics worry that charter schools perform no better than TPSs, that they may exacerbate stratification by race and ability, and that they harm the students left in TPSs by skimming away finan-cial resources and motivated families.
Although research on charter schools is growing, it has only scratched the surface of the important policy questions for the charter movement. For instance, existing studies have generally involved only a single state, and they have not produced consistent findings regard-ing the relative academic effectiveness of charter schools—which sug-gests the possibility that charter-school effectiveness may be related to features of the state policy regime in which charter schools operate (Gill, Timpane, et al., 2007).
Moreover, although it is clear that the performance of individual charter schools varies widely, research has not identified the character-istics that distinguish effective charter schools from ineffective char-ter schools. In addition, the performance of charchar-ter high schools has thus far received relatively little attention in existing research. And
the research has focused largely on the direct achievement effects of students attending charter schools, with little attention to the sys-temic effects on students who remain in conventional public schools. Given that charter schools are never likely to enroll more than a minority of the student population in most districts, their systemic effects—positive or negative—may be at least as important as their direct effects. Finally, the existing research has almost exclusively used test scores as measures of performance, ignoring other student out-comes, including measures of educational attainment, such as gradua-tion rates and enrollment in college.
In this monograph, we analyze student-level data from a number of geographic locations across the country to address research questions related to several of these disputes:
• We examine the population of students who are transferring to charter schools to provide evidence on whether charter schools are attracting high- or low-achieving students and to assess the effects of the transfers on racial stratification.
• We assess whether students experience greater achievement gains in charter schools than these same students experience in TPSs and conduct a series of sensitivity tests to inform the ongoing debate about the best ways to assess the achievement impacts of charter schools.
• In Chicago and Florida, we examine longer-term attainment out-comes, analyzing whether charter high schools are increasing (rel-ative to TPSs) their students’ likelihood of graduating and their probability of enrolling in college.
• We assess whether there is any evidence that charter-school com-petition is producing positive or negative effects on the achieve-ment of students who remain in TPSs.
Finally, in the concluding chapter of the monograph, we exam-ine consistencies and differences in the results for each question across different locations, considering the extent to which charter schools are producing similar outcomes in different environments and the extent
to which differences in outcomes might be attributable to differences in the details of charter policies.
Geographic Locations Included in the Analysis
We collected data statewide from three states and districtwide from five large, urban school districts. In total, eight states are represented in the data set. Table 1.1 lists each geographic location, the questions addressed (corresponding to the list just presented) and the number of charter schools per site included in the latest year of student achieve-ment data.
Data Description
We collected longitudinally linked student-level data from each location. Table 1.2 lists the years in which charter schools began Table 1.1
Geographic Locations Included in the Analysis
Geographic Location
Research Question Addressed
Number of Charter Schools Included in the Most Recent Year of Analysis Chicago: districtwide data 1, 2, 3, 4 33
Denver: districtwide data 1, 2, 4 21
Milwaukee: districtwide data 1, 2, 4 42
Philadelphia: districtwide data 1, 2, 4 57
San Diego: districtwide data 1, 2, 4 35
Florida: statewide data 3 37a
Ohio: statewide data 1, 2, 4 246
Texas: statewide data 1, 2, 4 198
Table 1.2
Data Included in the Analysis
Location
School Year in Which Charter Schools Began
Operating Years of K–12 Data
Years of Postsecondary Data Chicago 1997–98 1997–98 through 2006–07 2002–03 through 2006–07 Denver 1995–96 2001–02 through 2005–06 No data Milwaukee 1996–97 2000–01 through 2006–07 No data Philadelphia 1997–98 2000–01 through 2006–07 No data
San Diego 1993–94 1997–98 through 2006–07 No data Florida 1996–97 1997–98 through 2004–05 2000–01 through 2004–05 Ohio 1998–99 2004–05 through 2007–08 No data Texas 1996–97 1994–95 through 2003–04 No data
operating and the years of K–12 and postsecondary data we have for each location.
Longitudinal student-level data provide the ability to track stu-dents as they move from TPSs to charter schools and vice versa. This allows us to examine not only the effects of charter-school transfers on the mix of students in the different sectors, but also the performance of students before, during, and after attending a charter school. In addi-tion, it permits us to see how the performance of an individual student in a TPS changes as charter schools are introduced nearby.
Included in the data for each student are school identifiers, stu-dent grade, race and ethnicity, and test scores in math and reading. High school–graduation and college-entry data were available only in Chicago and Florida. The time frame in which data were collected varied by location. For instance, in San Diego, we were able to collect
data from 1997–98 through 2006–07. In contrast, in Ohio, data were available only from 2004–05 through 2007–08.
The most recent year in which we collected test-score data was generally 2006–07. Although we would like to have collected 2007–08 data, this was possible only in Ohio, as the timing of the publication was not conducive to collecting and analyzing more-recent data across all locations.
We provide a more-detailed description of each of the data sets in Appendix A, which includes information about any exclusions we made in the data sets and how we classified schools. In addition, in our description of our analysis in later chapters, we describe some of the challenges and nuances of the data sets.
7
Students Transferring to Charter Schools
We begin with a descriptive examination of students transferring to charter schools. Critics of charter schools fear that they will further racially or ethnically1 stratify an already deeply stratified system and will skim off the best students from TPSs, harming the students left behind. In contrast, some charter supporters hope that charter schools will improve racial integration by letting families choose schools outside of neighborhoods where housing is racially segregated. Integration may be an important policy outcome in its own right, and evidence suggests that the interaction with diverse backgrounds and ability levels can have positive social and academic effects for students (Frankenberg and Lee, 2003; Zimmer and Toma, 2000; Summers and Wolfe, 1977).
Several studies have examined the racial representativeness of charter schools (Powell et al., 1997; Miron and Nelson, 2002; Fran-kenberg and Lee, 2003). These studies have generally needed to rely on school-level data rather than student-level data and have examined whether the racial composition of charter schools is similar to that of the districts or states where they are located. They have not exam-ined the actual counterfactual for the charter students—what would have been the racial composition of the school the students would have attended if they had not transferred to a charter school? Nor did these studies examine whether the charter schools are skimming off the cream—the highest-achieving students from the TPSs.
To address these questions, researchers need longitudinally linked student-level data, which provides the ability to follow students as they transfer from TPSs to charter schools. Previously, Bifulco and Ladd (2007) examined migration patterns of students choosing to trans-fer to a charter school. They found that African American students in North Carolina were likely to switch to charter schools with higher concentrations of African American students than the TPSs that they left. This charter-school migration increased the racial isolation of Afri-can AmeriAfri-can students. We build on the models used by Bifulco and Ladd to examine the distributional effects of charter schools across the locations.
Prior Achievement of Students Transferring to Charter Schools
First, we examine the prior achievement levels of students who enter charters, as compared with average districtwide achievement levels and with the achievement levels of other students in the TPSs from which they transferred. This analysis examines only students who switch into charter schools after they have been in TPSs. Because test scores are not available for students prior to kindergarten, it is impossible for us to test whether charter elementary schools are attracting the best stu-dents at the entry point. In addition, the analysis removes stustu-dents who are making structural moves—i.e., students who are switching from elementary to middle school and middle to high school—because, for such students, their previous school is no longer the relevant counter-factual (and we do not have data to indicate the TPS they would have attended if they had not attended the charter school). But we also conducted alternative analyses that included structural movers (on the assumption that the average achievement levels in their previous schools might be unbiased, if noisy, proxies for average achievement levels in the unknown counterfactual schools), and the results were quite consistent with those shown in Table 2.1, with no substantive differences in any of the sites.
Table 2.1
Average Prior Math and Reading Scores of Charter Movers and Other Students at the Traditional Public Schools That They Leave
Variable Overall White Students African American Students Hispanic Students Chicago
Prior math scores of movers –0.03 0.30 –0.05 0.06
Prior math scores of TPS peers –0.12 0.36 –0.17 0.03
Difference with TPS peers 0.09 –0.06 0.12 0.03
Prior reading scores of movers 0.02 0.35 0.01 0.02
Prior reading scores of TPS peers –0.09 0.36 –0.12 –0.03
Difference with TPS peers 0.11 –0.01 0.13 0.05
Denver
Prior math scores of movers –0.32 0.16 –0.45 –0.34
Prior math scores of TPS peers –0.16 0.13 –0.13 –0.25
Difference with TPS peers –0.16 0.03 –0.32 –0.09
Prior reading scores of movers –0.25 0.47 –0.18 –0.33
Prior reading scores of TPS peers –0.17 0.22 –0.04 –0.29
Difference with TPS peers –0.08 0.25 –0.14 –0.04
Milwaukee
Prior math scores of movers –0.02 0.61 –0.33 0.10
Prior math scores of TPS peers –0.01 0.28 –0.15 0.05
Difference with TPS peers –0.01 0.33 –0.18 0.05
Prior reading scores of movers –0.04 0.52 –0.29 0.02
Prior reading scores of TPS peers –0.04 0.21 –0.16 –0.02
Variable Overall White Students African American Students Hispanic Students Philadelphia
Prior math scores of movers –0.11 0.47 –0.16 –0.20
Prior math scores of TPS peers –0.17 0.26 –0.21 –0.20
Difference with TPS peers 0.06 0.21 0.05 0.00
Prior reading scores of movers –0.05 0.53 –0.08 –0.23
Prior reading scores of TPS peers –0.18 0.22 –0.19 –0.25
Difference with TPS peers 0.13 0.31 0.11 0.02
San Diego
Prior math scores of movers –0.29 0.11 –0.54 –0.43
Prior math scores of TPS peers –0.12 0.10 –0.22 –0.21
Difference with TPS peers –0.17 0.01 –0.32 –0.22
Prior reading scores of movers –0.20 0.28 –0.42 –0.41
Prior reading scores of TPS peers –0.11 0.14 –0.21 –0.23
Difference with TPS peers –0.09 0.14 –0.21 –0.18
Ohioa
Prior math scores of movers –0.61 –0.33 –0.89 –0.60
Prior math scores of TPS peers –0.41 –0.13 –0.68 –0.51
Difference with TPS peers –0.20 –0.20 –0.21 –0.09
Prior reading scores of movers –0.56 –0.30 –0.80 –0.51
Prior reading scores of TPS peers –0.41 –0.14 –0.65 –0.49
Difference with TPS peers –0.15 –0.16 –0.15 –0.02
Variable Overall White Students African American Students Hispanic Students Texas
Prior math scores of movers –0.46 –0.03 –0.83 –0.47
Prior math scores of TPS peers –0.24 0.02 –0.41 –0.27
Difference with TPS peers –0.22 –0.05 –0.42 –0.20
Prior reading scores of movers –0.38 0.11 –0.64 –0.47
Prior reading scores of TPS peers –0.21 0.07 –0.32 –0.31
Difference with TPS peers –0.17 0.04 –0.32 –0.16
a Because Ohio has virtual schools, which are fairly unusual, we also ran the analysis
excluding virtual schools. The results for all students, for African American students, and for Hispanic students are very similar. For white students, the patterns are similar but with slightly smaller differences.
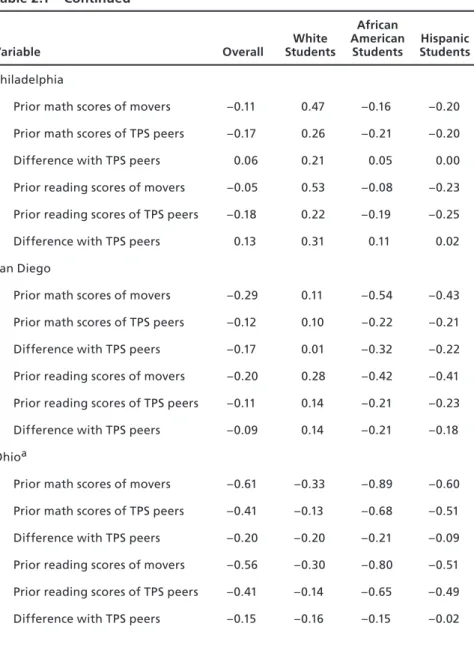
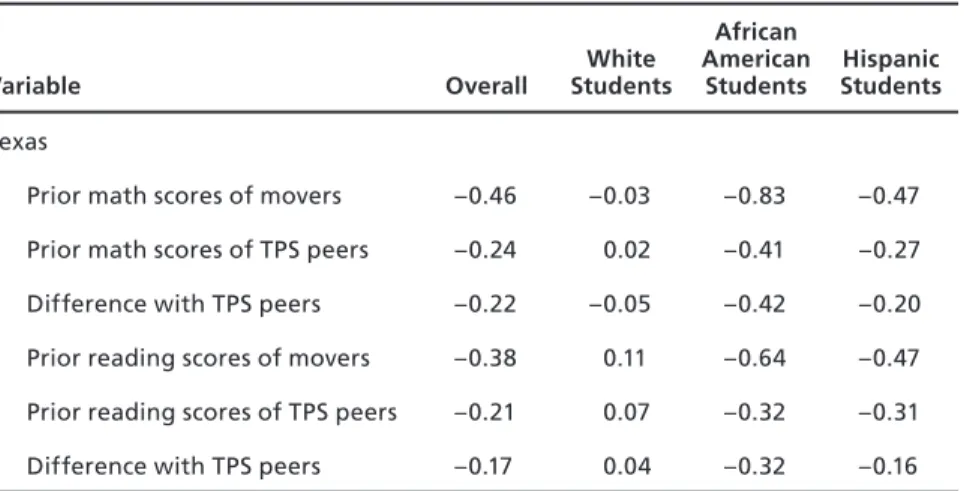
Table 2.1 shows the average standardized prior math and reading scores of charter movers and of their peers within the same grade at the TPSs the movers exited for each district. Original scores are scaled scores from state accountability tests or district-administered tests. To make the results comparable across grades and subjects and across geo-graphic locations, we standardized them relative to the districtwide or statewide distribution in each grade and subject. Therefore, scores in the table are standardized z-scores, with negative scores below the dis-trictwide or statewide average and positive scores above.
In some locations, the differences in test scores between those who move to charter schools and their peers who remain in TPSs are small. For instance, in Chicago, Philadelphia, and Milwaukee, students who switched to charter schools had prior test scores that were gener-ally slightly lower than district averages (as evidenced by the negative z-scores) but either identical to or slightly higher than the scores of their peers in the TPSs they exited. In Denver and San Diego, students transferring to charter schools had prior test scores that were not only below districtwide averages but also lower than those of the students in the TPSs they exited.
In Ohio and Texas, these differences are more pronounced. In each of these locations, students transferring to charter schools have test scores that are substantially below state averages and the average scores of the peers in the TPSs they exited. Note, however, that the standard-ized scores in Ohio and Texas should not be compared directly with those in the other sites. Charter schools often tend to locate in low-achieving school districts, so statewide average scores may be substan-tially higher than districtwide scores (thereby producing lower relative z-scores).
In sum, in all but one case (Chicago reading scores, which are vir-tually identical to the districtwide average), students switching to char-ter schools had prior test scores that were below districtwide or state-wide averages (though usually the difference was small). Compared with their immediate peers in the TPSs they exited, students transfer-ring to charter schools had slightly higher test scores in two of seven locations, while, in the other five locations, the scores of the transfer-ring students were identical to or lower than those of their TPS peers. Same-race comparisons indicate lower prior scores for charter students in five of seven sites among African Americans and in four of seven sites among Hispanics. For white students, the pattern was slightly differ-ent: In four of seven sites, white students entering charter schools had higher prior achievement than their white peers, and, in one other site, they had higher scores in one of two subjects. These results for white students had little effect on the overall averages because white students constituted a minority of charter students in every location and less than one-quarter of charter students in the four locations where their scores were consistently higher than those of their white peers (as we show in the next section).
Transfers to Charters and Racial and Ethnic Stratification In this section, we compare the racial composition of the sending (tra-ditional public) and receiving (charter) schools of students transferring to charters. Before presenting the results, we provide context with a descriptive breakdown of three major groups of students in charter and
TPSs in Table 2.2. African American students are overrepresented in charter schools in six of seven locations, which is consistent with previ-ous research (Bifulco and Ladd, 2007; Booker, Zimmer, and Buddin, 2005). Patterns for white students and Hispanic students are more mixed, varying across sites.
The data in Table 2.2 are useful for understanding aggregate rep-resentation of different racial groups across the charter and TPS sec-tors in the different locations, but they do not tell us about the relative levels of integration in charter schools and TPSs, because sectorwide numbers could mask enormous variation in the integration of indi-vidual schools. The 40-percent share of San Diego’s charter enroll-ment represented by Hispanic students, for example, could result from Hispanics constituting 40 percent of the enrollment of every charter school in San Diego, or it could result from Hispanics constituting 100 percent of the enrollment of 40 percent of the charter schools and zero in the rest. Moreover, the data in Table 2.2 do not tell us about the effects on integration of students transferring into charter schools Table 2.2
Charter and Traditional Public School Racial Representation Across All Years in Our Data (%)
Location
Charter School TPS African
American White Hispanic
African
American White Hispanic
Chicago 72.9 2.7 23.5 52.7 9.4 34.8 Denver 31.7 20.4 44.8 19.6 20.0 56.0 Milwaukee 40.7 23.0 27.1 63.8 14.1 14.4 Philadelphia 66.1 19.3 12.3 64.2 15.2 14.8 San Diego 22.9 20.4 40.4 14.5 27.1 39.4 Ohio 55.3 38.7 2.6 15.4 77.9 2.5 Texas 35.8 22.5 39.4 15.7 42.4 39.2
NOTE: Percentages do not all sum to 100 because some students do not fit these categories.
because they do not tell us where the students would have been if they had not transferred.
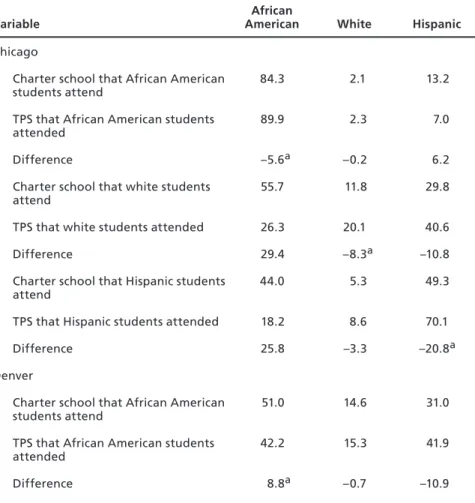
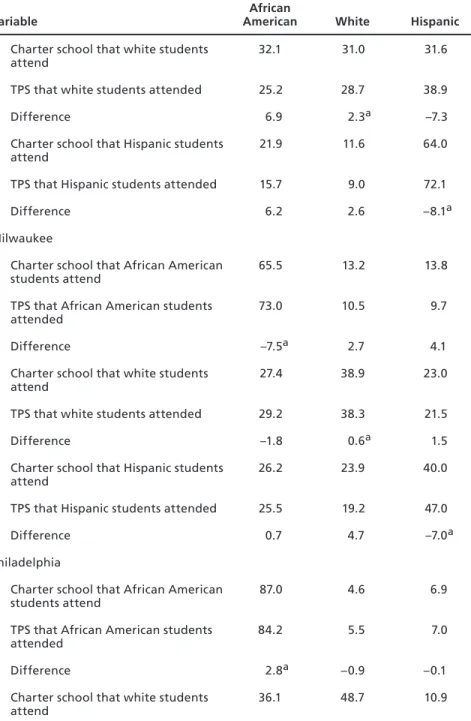
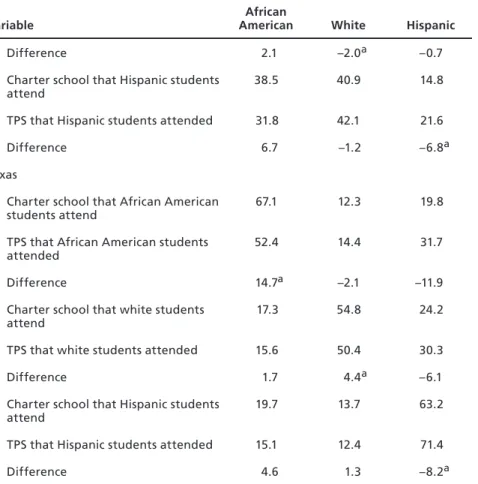
Table 2.3 attempts to shed light on these issues by comparing the peer environments (in racial terms) for charter movers before and after moving to a charter school, separately for African American students, Hispanic students, and white students. (Totals across rows may not add up to 100 percent because other racial categories are omitted, but those categories constituted only small minorities in most sites.)
Table 2.3
Traditional Public and Charter Peer Environments for Charter Movers, by Racial and Ethnic Background of Student (%)
Variable
African
American White Hispanic Chicago
Charter school that African American students attend
84.3 2.1 13.2
TPS that African American students attended
89.9 2.3 7.0
Difference –5.6a –0.2 6.2
Charter school that white students attend
55.7 11.8 29.8
TPS that white students attended 26.3 20.1 40.6
Difference 29.4 –8.3a –10.8
Charter school that Hispanic students attend
44.0 5.3 49.3
TPS that Hispanic students attended 18.2 8.6 70.1
Difference 25.8 –3.3 –20.8a
Denver
Charter school that African American students attend
51.0 14.6 31.0
TPS that African American students attended
42.2 15.3 41.9
Variable
African
American White Hispanic Charter school that white students
attend
32.1 31.0 31.6
TPS that white students attended 25.2 28.7 38.9
Difference 6.9 2.3a –7.3
Charter school that Hispanic students attend
21.9 11.6 64.0
TPS that Hispanic students attended 15.7 9.0 72.1
Difference 6.2 2.6 –8.1a
Milwaukee
Charter school that African American students attend
65.5 13.2 13.8
TPS that African American students attended
73.0 10.5 9.7
Difference –7.5a 2.7 4.1
Charter school that white students attend
27.4 38.9 23.0
TPS that white students attended 29.2 38.3 21.5
Difference –1.8 0.6a 1.5
Charter school that Hispanic students attend
26.2 23.9 40.0
TPS that Hispanic students attended 25.5 19.2 47.0
Difference 0.7 4.7 –7.0a
Philadelphia
Charter school that African American students attend
87.0 4.6 6.9
TPS that African American students attended
84.2 5.5 7.0
Difference 2.8a –0.9 –0.1
Charter school that white students attend
36.1 48.7 10.9
Variable
African
American White Hispanic TPS that white students attended 39.5 39.7 12.3
Difference –3.4 9.0a –1.4
Charter school that Hispanic students attend
35.5 6.9 55.9
TPS that Hispanic students attended 38.1 12.0 45.4
Difference –2.6 –5.1 10.5a
San Diego
Charter school that African American students attend
33.7 20.0 32.1
TPS that African American students attended
25.3 16.1 39.2
Difference 8.4a 3.9 –7.1
Charter school that white students attend
15.8 42.1 30.2
TPS that white students attended 12.5 39.0 32.3
Difference 3.3 3.1a –2.1
Charter school that Hispanic students attend
17.2 22.2 50.5
TPS that Hispanic students attended 15.8 19.0 49.4
Difference 1.4 3.2 1.1
Ohiob
Charter school that African American students attend
78.9 16.5 2.1
TPS that African American students attended
74.1 20.0 3.0
Difference 4.8a –3.5 –0.9
Charter school that white students attend
17.0 77.0 2.4
TPS that white students attended 14.9 79.0 3.1
Variable
African
American White Hispanic
Difference 2.1 –2.0a –0.7
Charter school that Hispanic students attend
38.5 40.9 14.8
TPS that Hispanic students attended 31.8 42.1 21.6
Difference 6.7 –1.2 –6.8a
Texas
Charter school that African American students attend
67.1 12.3 19.8
TPS that African American students attended
52.4 14.4 31.7
Difference 14.7a –2.1 –11.9
Charter school that white students attend
17.3 54.8 24.2
TPS that white students attended 15.6 50.4 30.3
Difference 1.7 4.4a –6.1
Charter school that Hispanic students attend
19.7 13.7 63.2
TPS that Hispanic students attended 15.1 12.4 71.4
Difference 4.6 1.3 –8.2a
a The percentage difference between the school a student exits and the school the
student enters in the student’s own race or ethnicity.
b Because Ohio has virtual schools, which are fairly unusual, we also ran the analysis
excluding virtual schools. The results show similar patterns but are slightly more pronounced.
As is the case with Table 2.1, this analysis examines only stu-dents who switch into charter schools after they have been in TPSs. We do not have data that would allow an examination of what the racial composition would have been in a TPS for students who never attended TPSs—most importantly, students who begin in charter schools in kindergarten. Also, the analysis removes students who are making structural moves because the prior TPSs may not represent a Table 2.3—Continued
strong counterfactual for the racial makeup of the school that the stu-dents would have attended in the later grade level had they not chosen a charter.
In most cases, the results in Table 2.3 suggest that (on average) transferring students are moving to charter schools with racial compo-sitions that do not differ dramatically from those of the TPSs they left behind. Across the sites, however, African American transfer students are slightly more likely than white students or Hispanic students to move to charter schools that have larger proportions of their own racial group. This does not necessarily indicate a preference for a same-race environment; it could result simply from a preference among African Americans for charter schools (in which they tend to be overrepresented, as shown in Table 2.2). In five of the seven sites, African American stu-dents transferred to charter schools with (on average) higher concentra-tions of African Americans than were present in the TPSs they exited. Across the seven jurisdictions, the (unweighted) average increase in the African American concentration experienced by an African American transfer student was 3.8 percent, versus an average increase of 1.3 per-cent in the white conper-centration experienced by transferring white stu-dents and an average decline of 5.9 percent in the Hispanic concentra-tion experienced by transferring Hispanic students.
Some differences are also evident across jurisdictions. Philadel-phia is the only site where transferring students of all three groups tend to move to charter schools with higher concentrations of their own race. In Chicago, in contrast, transferring students of all three groups tend to move to charter schools with lower concentrations of their own race. In all of the other sites, the results vary for different racial groups. Across 21 comparisons (seven sites with three racial groups each), we find only two cases in which the average difference between the send-ing TPS and the receivsend-ing charter school is greater than 10 percentage points in the concentration of the transferring student’s race.
Chapter Summary
Overall, across the two analyses, it does not appear that charter schools are systematically skimming high-achieving students or dramatically affecting the racial mix of schools for transferring students. Students transferring to charter schools had prior achievement levels that were generally similar to or lower than those of their TPS peers. And trans-fers had surprisingly little effect on racial distributions across the sites: Typically, students transferring to charter schools moved to schools with racial distributions similar to those of the TPSs from which they came. There is some evidence, however, that African American stu-dents transferring to charters are more likely to end up in schools with higher percentages of students of their own race, a finding that is con-sistent with prior results in North Carolina (Bifulco and Ladd, 2007).
21
Student Achievement in Charter Schools
In recent years, studies have attempted to examine the impact of char-ter schools on student achievement in Arizona (Solmon, Paark, and Garcia, 2001), California (Zimmer, Buddin, et al., 2003; Betts, Rice, et al., 2006; Zimmer and Buddin, 2006), Florida (Sass, 2006), Mas-sachusetts (Abdulkadiroglu et al., 2009), Michigan (Bettinger, 2005), Ohio (Ohio Department of Education, 2007), New York (Hoxby and Murarka, 2007), North Carolina (Bifulco and Ladd, 2006), Texas (Hanushek et al., 2005; Booker, Gilpatric, et al., 2007), Wisconsin (Witte et al., 2007), and Pennsylvania (Zimmer, Blanc, et al., 2008). In addition, a few recent studies have examined student achievement in charter schools nationally (Nelson, Rosenberg, and Van Meter, 2004; Hoxby, 2004).
Distinguishing the effects of schools from the effects of family and other external factors is challenging under any circumstances, and it is especially problematic in evaluating charter schools, where students are likely to differ from those in TPSs simply because they have chosen to attend charter schools. Differences between choosing and nonchoosing students may be related to achievement in positive or negative ways, thereby producing selection bias in comparing achievement in charter schools and TPSs.
Researchers have dealt with the selection bias in charter enroll-ment in three ways: randomized experienroll-ments, longitudinal analyses, and cross-sectional comparisons that attempt to match school and stu-dent characteristics or control statistically for their differences. The first two methods allow researchers to account for the amount of time a
student has spent in a particular school, and all three methods attempt to address differences among student populations served.
Randomized experiments are often considered the gold standard in research because, by assigning subjects randomly to the treatment condition or control condition, they ensure that differences observed later are the result of treatment rather than the result of background differences between the subject groups. A few studies are beginning to examine oversubscribed charter schools that randomly admit students through lotteries. For instance, Hoxby and Rockoff (2004) found that four Chicago charter schools that admitted students by lottery were outperforming TPSs as measured by students’ subsequent achieve-ment. Later, Hoxby and Murarka (2007) used a similar design to eval-uate 47 charter schools in New York City and likewise found a small positive achievement effect for students attending charter schools. Abdulkadiroglu et al. (2009) found that a subset of charter middle and high schools in Boston that used admission lotteries also found posi-tive impacts (sometimes large). And Mathematica Policy Research is engaged in a federally funded national study of oversubscribed charter middle schools that admit students by lottery; results are not yet avail-able (see Mathematica Policy Research, undated).
These lottery-based studies have strong internal validity: Research-ers can be confident that the participating charter schools caused the achievement advantages for the students who were admitted in their lotteries. But although the studies should produce internally valid and reliable results for the set of charter schools and students exam-ined, they may have limited implications for charter schools that lack lengthy waiting lists and do not use lotteries to admit students. In other words, these studies have weak external validity. Charter schools with lengthy waiting lists might well be those that are better than average. Indeed, the only study that has begun to examine the issue found that charter schools using admission lotteries appeared to be more effective than charter schools that were not oversubscribed (Abdulkadiroglu et al., 2009).
When researchers have attempted to be more inclusive in their analysis of charter schools, some have relied on school-level data or cross-sectional student-level comparisons of achievement in charter
schools and TPSs at a single point in time (e.g., Nelson, Rosenberg, and Van Meter, 2004; Hoxby, 2004). A key weakness of a school-level analysis is the high degree of aggregation, which masks changes over time in the school’s population. In essence, school-level data may not pick up the nuances of student characteristics and can provide only an incomplete picture of why outcomes vary across schools. Moreover, school-level data are especially problematic when used to compare changes over time in the performance of charter schools versus TPSs. As we discuss later, there is good evidence that charter schools often have a negative achievement effect in their first year of operation. The spring of a charter school’s first year of operation, which is the earliest possible starting point for a longitudinal analysis of schoolwide data, is, therefore, an artificially low baseline.
Meanwhile, point-in-time data, even at the student level, cannot account for the amount of time spent in different schools and may not be able to factor out the various nonschool factors that affect student achievement. Students who choose to attend charter schools are likely to differ from TPS students in unobservable ways that are not fully captured in demographic characteristics, such as poverty and race. They might have better-informed and more-motivated parents than TPS students of the same poverty level and race. Or they might be stu-dents who have had difficulties in school in the past and seek out char-ter schools because they have not done well in TPSs. If either of these stories is true, then adjusting for observed characteristics, such as race and poverty, in a cross-sectional analysis would produce an estimate of charter-school impacts that is biased upward or downward.
As an alternative nonexperimental approach, researchers have often used longitudinal data at the student level to conduct within-student comparisons of achievement gains, examining changes in the achievement trajectories of individual students who move from TPSs to charter schools or vice versa. This method allows the researcher to account for unobservable differences as well as observable differences between charter students and noncharter students, as long as those dif-ferences are fixed, i.e., consistent across time in their effects on achieve-ment. This approach was endorsed by a collection of research experts known as the Charter School Achievement Consensus Panel (Betts and
Hill, 2006). To date, a handful of studies have used a within-student longitudinal approach to evaluate charter schools in individual states and cities: Solmon, Paark, and Garcia (2001) in Arizona; Bifulco and Ladd (2006) in North Carolina; Gronberg and Jansen (2001) in Texas; Hanushek et al. (2005) in Texas; Booker, Gilpatric, et al. (2007) in Texas; Zimmer, Buddin, et al. (2003), Betts et al. (2006), and Zimmer and Buddin (2006) in California; Sass (2006) in Florida; Witte et al. (2007) in Milwaukee. These studies have produced mixed results in terms of estimates of the achievement effects of charter schools.
Because we do not have charter-school wait lists to conduct a ran-domized design, we build on this existing literature and use a longitu-dinal, within-student analysis known as a student fixed-effect approach. The student fixed-effect approach has recently been subject to questions about its validity in producing unbiased estimates of charter-school impacts (Hoxby and Murarka, 2006; Ballou, Teasley, and Zeidner, 2007), and we conduct several specification tests and make changes to our analyses to address these concerns. Three concerns about the valid-ity of the student fixed-effect approach are notable.
First, the student fixed-effect approach depends on the assump-tion that students’ past gain trajectories are good predictors of future gain trajectories. Hoxby and Murarka (2006) argue that students who transfer to charter schools in the middle of their educational careers may be those who had unusual difficulties in the immediately preced-ing year—difficulties that reflect a time-specific change in their likely future achievement trajectories. If so, the fixed-effect approach could produce biased estimates. Moreover, if a bias exists, its direction is not obvious a priori. If the pretransfer dip represents a transitory change— i.e., the student had one anomalously difficult year—then we would expect the dip to be temporary, and the estimate of the charter school’s impact would be inflated as the student’s scores regressed toward their long-term mean. If, by contrast, the pretransfer dip represents a change in the student’s long-term trajectory, then long-term prior achievement might overestimate the student’s future achievement, and the estimate of the charter school’s effects would be correspondingly biased low.
The second and related concern is that the fixed-effect approach provides an estimate of student achievement only for students who