ENHANCING SOFTWARE PROJECT OUTCOMES:
USING MACHINE LEARNING AND OPEN SOURCE
DATA TO EMPLOY SOFTWARE PROJECT
PERFORMANCE DETERMINANTS
Title Page
Lalit N. Jagtiani
Under the Supervision of Dr. Christian Bach
DISSERTATION
SUBMITTED IN PARTIAL FULFILMENT OF THE REQUIREMENTS
FOR THE DEGREE OF DOCTOR OF PHILOSOPHY IN TECHNOLOGY MANAGEMENT THE SCHOOL OF ENGINEERING
UNIVERSITY OF BRIDGEPORT CONNECTICUT
ENHANCING SOFTWARE PROJECT OUTCOMES:
USING MACHINE LEARNING AND OPEN SOURCE
DATA TO EMPLOY SOFTWARE PROJECT
PERFORMANCE DETERMINANTS
ENHANCING SOFTWARE PROJECT OUTCOMES:
USING MACHINE LEARNING AND OPEN SOURCE
DATA TO EMPLOY SOFTWARE PROJECT
PERFORMANCE DETERMINANTS
© Copyright by Lalit N. Jagtiani 2017 All Rights Reserved
ENHANCING SOFTWARE PROJECT OUTCOMES:
USING MACHINE LEARNING AND OPEN SOURCE
DATA TO EMPLOY SOFTWARE PROJECT
PERFORMANCE DETERMINANTS
Abstract
Many factors can influence the ongoing management and execution of technology projects. Some of these elements are known a priori during the project planning phase. Others require real-time data gathering and analysis throughout the lifetime of a project. These real-time project data elements are often neglected, misclassified, or otherwise misinterpreted during the project execution phase resulting in increased risk of delays, quality issues, and missed business opportunities.
The overarching motivation for this research endeavor is to offer reliable improvements in software technology management and delivery. The primary purpose is to discover and analyze the impact, role, and level of influence of various project related data on the ongoing management of technology projects. The study leverages open source data regarding software performance attributes. The goal is to temper the subjectivity currently used by project managers (PMs) with quantifiable measures when assessing project execution progress.
Modern-day PMs who manage software development projects are charged with an arduous task. Often, they obtain their inputs from technical leads who tend to be significantly more technical. When assessing software projects, PMs perform their role subject to the limitations of their capabilities and competencies. PMs are required to
contend with the stresses of the business environment, the policies, and procedures dictated by their organizations, and resource constraints.
The second purpose of this research study is to propose methods by which conventional project assessment processes can be enhanced using quantitative methods that utilize real-time project execution data. Transferability of academic research to industry application is specifically addressed vis-à-vis a delivery framework to provide meaningful data to industry practitioners.
TABLE OF CONTENTS
Title Page ... i
Approvals ... ii
Copyright Statement ... iii
Abstract ... iv
TABLE OF CONTENTS ... vi
LIST OF TABLES ... x
LIST OF FIGURES ... xi
CHAPTER 1: INTRODUCTION ... 1
CHAPTER 2: RESEARCH SCOPE ... 3
2.1. Motivation and Research Questions ... 3
2.2. Software Life Cycle and Performance Measures ... 4
2.3. Research Goals and Potential Contribution ... 9
2.4. Limitations and Constraints ... 12
CHAPTER 3: LITERATURE REVIEW ... 14
3.1. Macro Analysis ... 16
3.2. Software Quality Attributes ... 25
3.3. Research Data Validity ... 31
3.4. Software Management and Predictive Modeling ... 41
CHAPTER 5: RESEARCH DATA ... 51
5.1. Data Plan and Expected Outcomes ... 51
5.2. Data Management ... 52
5.3. Data Extraction ... 54
5.4. Data for Analysis ... 55
5.5. Research Variables... 58
CHAPTER 6: RESULTS AND IMPLICATIONS ... 61
6.1. Software Quality Attributes ... 62
6.2. Descriptive Statistics – Research Variables ... 67
6.3. Multiple Regression Model – Research Variables... 68
6.3. Towards Building and Validating a Predictive Model ... 70
6.4. Research Transferability ... 72
6.5. Developing an Applied Research Framework (ARF) ... 76
CHAPTER 7: FUTURE RESEARCH OPPORTUNITIES ... 83
CHAPTER 8: CONCLUDING REMARKS ... 86
CHAPTER 9: GLOSSARY OF TERMS ... 88
CHAPTER 10: BIBLIOGRAPHY ... 94
APPENDIX A: THE SRDA ... 109
A.1. Data Entity Relationship Diagram—SourceForge.net ... 109
A.2. Data Entity Relationship Model – SRDA – Artifact... 110
A.4. Data Entity Relationship Model – SRDA – Forums ... 112
A.5. Data Entity Relationship Model – SRDA – FRS ... 113
A.6. Data Entity Relationship Model – SRDA – Job ... 114
A.7. Data Entity Relationship Model – SRDA – Tasks ... 115
A.8. List of tables analyzed from OSS Research ... 115
A.9. Select SRDA Data Stored in Local MS Access Database ... 117
APPENDIX B: EXISTING RESEARCH – THE SRDA ... 120
B.1. Reference List by Research Focus ... 120
B.2. Yearly Cumulative Publications – SRDA ... 122
B.3. Publications by Publisher ... 123
APPENDIX C: DATA RESULTS ... 124
C.3. Weka 3.8.1 Machine Learning Algorithm – Results ... 124
C.3.1. Random Forest ... 124 C.3.2. Meta Bagging ... 125 C.3.3. J48 Decision Tree ... 126 C.3.4. Decision Table... 127 C.3.5. K-Nearest Neighbor ... 128 C.3.6. Multi-Layer Perceptron ... 129 C.3.7. Iterative Classifier ... 130 C.3.8. Naïve-Bayes ... 131
LIST OF TABLES
Table 1. Project Performance Statistics [9]... 17
Table 2. Comparison of Management and Technical Performance Levels ... 18
Table 3. Probability of Selected Outcomes [17] ... 20
Table 4. Average Software Schedules (in Calendar Months) ... 21
Table 5. Summary of Measures of Success, Indicators, and Potential Issues ... 26
Table 6. SPI Success Dimensions ... 29
Table 7. OSS by the Numbers [53] ... 33
Table 8. Gap Assessment – Learning Outcomes for Course Curricula [68] ... 42
Table 9. Gap Assessment – Software Quality Prediction Models in Research Studies ... 46
Table 10: Research Variables and Relevance ... 59
Table 11. Descriptive Statistics – Research Variables ... 67
Table 12. Research Variables – Data Quartiles ... 68
Table 13. Research Variables – Multiple Regression Results (95% C.I.) ... 69
Table 14. Relative Importance of Key Attributes in Predictive Modeling ... 70
Table 15. Classification Algorithm Performance Summary ... 71
LIST OF FIGURES
Figure 1. Software Project Delivery Life Cycle Framework ... 5
Figure 2. Objectivity of Metrics and Research Scope ... 6
Figure 3. Sample Dashboards - Release Predictability and Defects ... 11
Figure 4. Sample Dashboards - Stakeholder Engagement and Work Effort ... 12
Figure 5. Areas of Literature Review ... 15
Figure 6. Automation in Key Software Project Management Activities ... 19
Figure 7. Planned Versus Actual Software Schedules [17] ... 21
Figure 8. DeLone and McLean’s Success Model [33] ... 26
Figure 9. Mining Software Research Spanning 5 Years – ... 31
Figure 10. Select Data Entities from SRDA ... 37
Figure 11. SRDA – Existing Research – 10 Year Period, 2007 to 2016 ... 38
Figure 12. Review of 266 Research Papers Using OSS vs. PSS Artifacts ... 39
Figure 13. Influence of Top Software Management Practices on Software Quality ... 44
Figure 14. Process for Research Study Execution ... 49
Figure 15. Data plan - Key Activities and Preliminary Outcomes ... 51
Figure 16. Data analysis - Key Activities and Preliminary Outcomes ... 52
Figure 17. Research Data Management Plan ... 53
Figure 18. SRDA SourceForge Query Form ... 54
Figure 19. Key Data Relationships for Select Data from the SRDA ... 55
Figure 20. Key Steps to Derive Key Data Relationships from the SRDA ... 57
Figure 22. Sample 3D Data Plot –Sample Size of 18,019 Software Packages ... 63
Figure 23. Mean Time Between Software Release Dates and Defects Logged ... 64
Figure 24. Density Map – Group Rank and Number of Downloads ... 65
Figure 25. Relationship between Group Rank and Number of Downloads ... 66
Figure 26. MLP – Neural Network Diagram to Predict Software Rank ... 72
Figure 27. Root Cause Analysis - Select Review of Research Papers ... 73
Figure 28. Improving Software Management through Research Transferability ... 74
Figure 29. Pasteur’s Quadrant Model of Scientific Research ... 75
Figure 30: Applied Research Framework (ARF) for Research Transferability ... 78
CHAPTER 1: INTRODUCTION
While the origins of computational methods and programming date back a few centuries or more, the discipline of software engineering originated in 1968 [1]. The ISO/IEC/IEEE Systems and Software Engineering Vocabulary (SEVOCAB) defines software engineering as “the application of a systematic, disciplined, quantifiable approach to the development, operation, and maintenance of software; that is, the application of engineering to software.”1 Software engineering is therefore far more than computer programming; it is both the science and art of applying mathematical and computational logic to create a defined technological capability within resource and time constraints.
Numerous industrial and academic oriented studies have examined software development performance and prediction models for more than fifty years [2]. Theoretical and practice-oriented experts recognize several reasons which contribute to sub-optimal performance. While much of the failure can be attributed to industry, business climate, and other external forces, further research is required to determine methods that can improve aggregate results over time. Experience and research show that current software project management practices use far more subjective methods than objective data analysis to assess project progress [3].
The goal of this research study is to demonstrate concrete ways to increase objectivity in the management of software engineering. The scope of research has been aligned to address technology management issues specific to the software development process. Research objectives are established at the onset of the study; they guide the study to focus
1[1] P. Bourque and R. E. Fairley, Guide to the Software Engineering Body of Knowledge (SWEBOK (R)): Version 3.0: IEEE Computer Society Press, 2014.
on examining software quality predictors, establishing objective metrics, and recommending revised methods for improved software technology management. A thorough literature review is conducted to examine macro factors impacting software management, identify software quality attributes, establish research data validity, and discover improved software management and predictive modeling opportunities. Research study variables are established, classified, and analyzed using data extracted from an open source data archive exclusively developed for software research purposes at the University of Notre Dame. Quality prediction modeling opportunities are examined using the research variables with select machine learning enabled models trained and tested with archive data for optimal predictive performance. An applied research framework is introduced to enable the transfer of research outcomes from academia to industry. Finally, the framework is explored as a mechanism for employing predictive models within the industry to sustainably improve software project outcomes.
CHAPTER 2: RESEARCH SCOPE
2.1. Motivation and Research Questions
Although software engineering as a discipline has been around for nearly half a century, failure rates of large projects have remained high with no significant improvements reported over time. While it is generally accepted that several external factors have an influence on the management and execution of software technology projects, there needs to be a thorough examination of internal software project data that can be leveraged at appropriate times during the project life cycle. Moreover, many organizations use overly subjective (i.e., qualitative) analysis to improve project execution by relying heavily on the personal experiences of project managers. Biases associated with personal experiences often result in continued performance and quality variances and missed targets. Technological advances in software development now allow for real-time data to be utilized for rapid analysis and infusion into project management processes. This research aims to discover viable predictor(s) of software project execution quality and their potential usefulness in improving processes. More specifically, the research questions examined in this study include the following three categories:
1. Predicting the quality of the software project execution process.
a. Is software defect data a good predictor of overall project quality during the execution stage of the project?
b. What attributes of software are better predictors than others? Are there other reliable predictors?
c. Can organizations predict software release dates based on these predictors? Is it feasible to develop a learning-based, predictive model for practical application by software management professionals?
2. Increasing the objectivity of software project management.
How can objective data from past experiences with software management offer improvements to future projects using quantitative analysis?
3. Improving methods used by software project management processes.
How can project management tools and techniques be modified to incorporate quantitative methods and predictive models for use software technology management professionals?
2.2. Software Life Cycle and Performance Measures
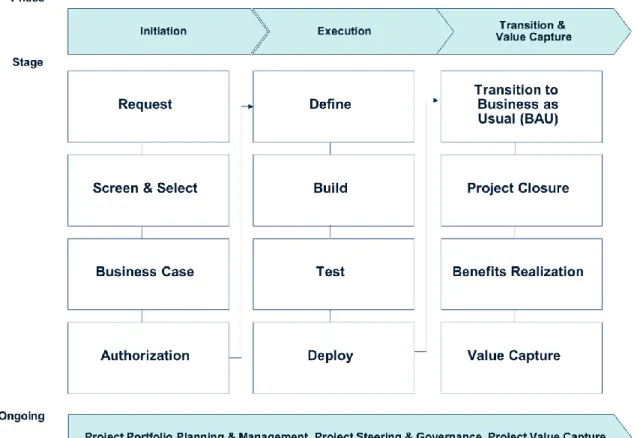
The study of software project life cycles has interested academia and industry since the advent of the software engineering discipline. Figure 1 depicts a project life cycle framework that was developed by the primary researcher of this research study based on collective industry experiences. The framework is also supported by the report IEEE Standard for Developing a Software Project Life Cycle Process published by the IEEE Computer Society in 2006 and follows the guidelines set forth [4].
Figure 1. Software Project Delivery Life Cycle Framework
While there are numerous metrics that can be measured during each stage of the software project life cycle, the scope of this study is limited to the execution phase of software projects. Several factors influence the management and execution of software technology projects. Some of these elements are known a priori during the project planning phase. Others may require real-time data gathering and analysis during project execution [5]. These real-time project data elements are often neglected, misclassified, or otherwise misinterpreted during the project execution phase. The results are higher risk of delays, quality problems, and lost opportunities. The primary purpose of this research study is to discover and analyze the impact, role, and level of influence of various project related data on the execution and ongoing management of software technology projects. This research study is focused on measuring and predicting project execution variables
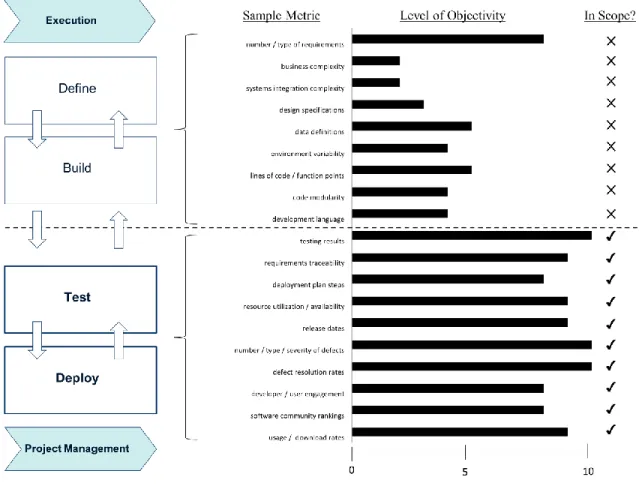
which are typically subject to high levels of uncertainty. Measures that are highly subjective or reflect the quality of the product instead of the quality of the process and may be of interest to other researchers are not in the scope of this study. Figure 2 shows the areas of focus within the project execution stage for measurement and predictability related variables in the context of this research study.
Figure 2. Objectivity of Metrics and Research Scope – Software Project Execution Phase
Sample metrics have been depicted for each stage of project execution. The level of objectivity inherent in each of these metrics has been assessed accordingly. Metrics in the early stages of execution are measured with a higher level of subjectivity, i.e., lower relative objectivity, and are therefore considered less reliable and difficult to measure. Early stage metrics are out of the scope of the study as they are typically useful in
determining the size, complexity, and features of the software product and not the quality of the development process itself. Typically, project managers use these metrics to define the project and baseline estimates against the triple constraint model of time, cost, and product scope. During the early and formative stages of project execution, i.e., design and build, the need for predictability is relatively low, the level of discovery is relatively high, and consequently, project execution risk is relatively transparent and easier to assess in these stages. In contrast, the metrics in the later stages of the project execution phase, i.e., test and deployment, can be more actionable by helping to identify and mitigate risk otherwise not visible to PM’s. Also, it is important to note that while, for example, the testing stage, is a widely accepted validation approach in industry, it is often ad-hoc, expensive, and unpredictable [6]. Some earlier studies suggest that the testing phase by itself could constitute 50 percent more of the total development cost [6, 7].
Metrics pertaining to the later stages of project execution demonstrate varying levels of objectivity with respect to their measurement and predictability. Examples of metrics that demonstrate lower levels of objectivity include the number of use cases, validity of test scripts, test case accuracy, requirements traceability, deployment plans, resource availability, and utilization. These metrics are product and organization defining, less reflective of the software development process, and can, therefore, be difficult to quantify. Such metrics are considered out of scope for this research study. However, there are a group of key metrics that is relevant to the later stages of project execution which provide greater objectivity and ease when measuring quality. They are also process -indicative by their very nature. Sample metrics in this group and in the scope for this research study include release dates, number/type/severity of defects, defect resolution
rates, developer and user engagement, software community rankings, and usage and download rates.
This research study fully recognizes the overriding premises of software development and management processes and in no way attempts to minimize the complexities and interdependencies of the subjective and objective aspects of project management that are required to produce quality software under the triple constraint model. The goal is to increase the objectivity within the software project management process where possible, making it more pragmatic and effective. While Figure 2 depicts sample metrics that are in and out of scope and draws attention to the later stages of project execution, the analysis also suggests interdependencies and the iterative nature of processes that transcend all the stages of execution including the earlier stages of software product definition and build.
This research study leverages open source software (OSS) data available from the public domain. Though sometimes difficult and complex, leveraging OSS data can provide a viable platform for research if a fit-for-purpose database environment is created that addresses specific measurement related requirements [3]. It is essential to create an environment that provides a normalized dataset and one that can reduce the layers of abstraction that would otherwise hinder research efforts. In this manner, certain insights that are developed after the analysis of OSS data can be applied to privately and commercially developed software projects.
In order to ensure feedback, there should be quantifiable improvement measures for various system states over time. The goal of this research is to add a novel body of knowledge to the technology management discipline by exploring one or more of the modern-day predictive modeling techniques.
PM’s who manage software development projects have an increasingly arduous task. Often managers receive their inputs from technical leads who are more technically oriented. When assessing software projects, PM’s perform their duties according to the limitations of their capabilities and competencies. PM’s have the need to contend with the limitations of resources made available to them such as human capital and project management tools. Furthermore, PM’s tend to follow common and industry-tested practices within their organizations.
With this motivation in mind, the secondary purpose of this research is to examine how conventional project assessment processes can be enhanced by using quantitative methods utilizing real-time project execution data.
2.3. Research Goals and Potential Contribution
This study aims to make measurable and implementable contributions in the area of software technology management. Specifically, the goals of this research study are to:
1. Discover and analyze the impact of various project related data on ongoing software technology management projects.
2. Improve upon conventional project assessment processes by using quantitative methods, which utilize real-time project execution data. In particular, the study aims to:
a. Enhance the predictors of software project execution.
b. Improve the methods used by software project management processes. c. Develop a framework to increase the objectivity of software project
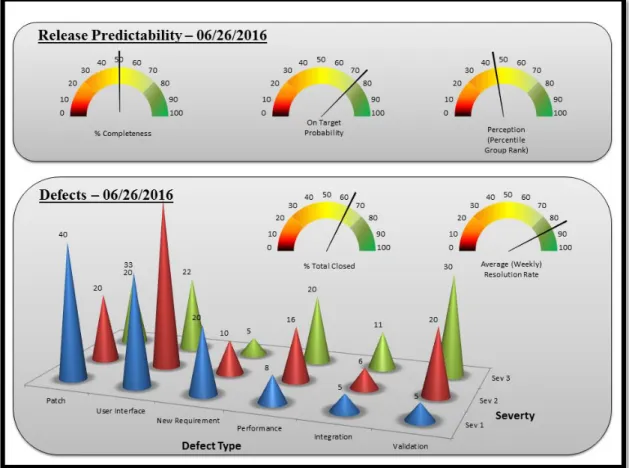
Based on previous work conducted using OSS data, this study aims to extend the research so that findings may be leveraged by future software project management professionals under appropriate conditions and parameters. By operationalizing these findings, practitioners can reasonably expect to improve the predictability and reliability of their software projects. For example, software project quality and predictability related dashboards that could be created and used by software PM’s to assess more objectively the quality and predictability of outcomes from the later stages of the software project execution phase of active projects. Conceivably, real-time data could be leveraged from projects and instantly benchmarked with historical data from similar projects to determine quality and predictability attributes. Insights provided by these types of dashboards could be valuable for mitigating project risk. PM’s who traditionally manage their projects by overly relying on subjective project information, can use such data-based insights as early warning indicators giving more time for corrective actions to be performed before it is too late. Figure 3 and Figure 4 depict representative sets of sample dashboards. In Figure 3, the Release Predictability dashboard shows predictability attributes for software release while Defects dashboard shows defect information that provides indicative information about the quality of the development process currently underway on a project:
Figure 3. Sample Dashboards - Release Predictability and Defects
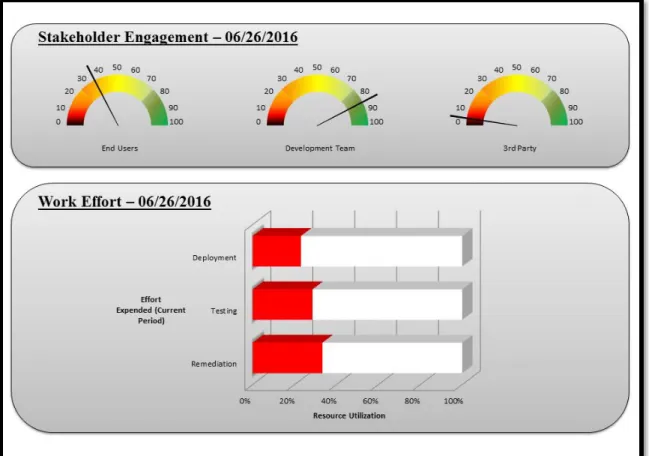
Figure 4 depicts another pair of sample dashboards representing stakeholder engagement and work effort being expended during the current stage of the project. The first dashboard shown in Figure 4 provides objective information regarding the level and type of engagement signaling potential team concerns, interest concerns, and the quality of testing underway. This can be of crucial importance to the unsuspecting PM responsible for managing a project. The second dashboard shows how resource time is utilized during the current stage of the project’s execution phase signaling potential risks related to skill set gap, product development, productivity, and resource backlog:
Figure 4. Sample Dashboards - Stakeholder Engagement and Work Effort 2.4. Limitations and Constraints
While this research study strives to add an incremental and novel value to software project management, by no means will this research study be terminal or decisive with all possible attributes, parameters, or factors. For instance, as noted earlier, numerous subjective factors influence project performance, such as organizational culture, team dynamic, competitive environment, timing, and resources. These macro factors will not be the subject of this research. In addition, there can be several other quantitative factors that influence project performance in various ways that are out of the scope of this study such as code performance, code complexity, code modularity, and hardware related parameters. While these variables could have an impact on software product quality, this
study focuses solely on software process quality. Therefore, discovery efforts for this study will be limited to process related attributes.
This research study is also bound by a few key constraints that are anticipated. Unless grant funds are awarded, research efforts for this study are not expected to be funded from external sources. When possible, university resources and the author’s personal resources are relied upon exclusively to complete this research study. Ample opportunity is expected for further research that extends beyond the scope of this study including the identification of additional quality predictors, the development of industry-specific quality predictive models, and the automation of methods to incorporate research data into project management tools.
CHAPTER 3: LITERATURE REVIEW
While the review of existing research continues towards the advancement of this research, the goals of this study were further explored with a thorough literature review. Specifically, research goals for this study have stemmed from the following two areas of literature review:
1. Past researchers have specifically acknowledged an opportunity for further research in a specific area based on their own published research.
2. A gap within existing research has been observed (i.e., there was no evidence found of significant progress made in the particular area of concern).
The following benefits from this research project were realized as a result of the literature review:
1. Shape and refine this research study by increasing the added value and ensuring that the research goals are novel and achievable. A thorough literature review provides clarity, conviction, and a pragmatic approach provides continuing guidance and validity to this research study.
2. Provide an interesting opportunity to review past academic research to identify gaps and refine research goals that can maximize intellectual merit while minimizing implementation complexity.
4. Develop and validate assumptions regarding required data and an appropriate approach to research – the selection of right data is an important component for this research study.
5. Validate data sources and discovery of criteria for data source selection – selected data requirements will require the proper data sources that are easy to access, supported by a credible research community and tested by academic researchers. 6. Provide insights on the selection of statistical and modeling methods to use when
analyzing the data to create the best prediction model within the scope of this study.
The research goals of this study are developed and refined based on a comprehensive review of literature in specific areas of software management. Numerous academic publications, authored by experts in their respective fields, are reviewed and categorized in the following areas as shown in Figure 5:
Figure 5. Areas of Literature Review Macro Analysis
Assess broader level issues affecting software industry and management
challenges
Research Data Validity
Confirm validity of OSS business models and repositories in research
Software Quality Attributes
Identify metrics and measurements of software success and quality
Software Management and Predictive Modeling
Review project management practices and predictive modeling opportunities
Research Objectives
3.1. Macro Analysis
While the global information technology industry has grown to over $3.5T dollars including a software segment that generates in excess of $310M revenues annually. In just over half a century, the practices of software technology management have been severely stressed [8]. As is the case with most disruptive technologies that experience high growth rates, the software industry has experienced extreme challenges that have resulted from the hyper the growth rate. Numerous studies, surveys, and assessments are routinely conducted by organizations and independent third parties to better understand and alleviate the challenges. This study starts by examining software project failure rates. In 2013, the CHAOS Report published by The Standish Group showed an alarming rate of 79% for projects that either failed or where challenged [9]. Failed projects were defined as projects that are canceled at some point during the development cycle. Challenged projects were defined as projects that are completed and operational but over-budget, over the time estimate, and/or that offer fewer features and functions than originally specified. Successful projects were defined as projects that are completed on time and on budget with all features and functions as initially specified. The Standish Group has been publishing the report for more than thirty years.
Analyses show high failure or challenged project rates with the root cause centered squarely on lack of adequate planning, readiness, and assessment methods. Mandal and Pal establish, with their research, that more than 50% of all Information Technology (IT) projects become “runaway” projects [10]. These projects exceed budgets and schedules while failing to deliver the expected outcomes [10-12]. Furthermore, project results based on the triple constraint model of time, cost, and scope become even more concerning.
Table 1 depicts that most of the projects exceed on two of the most important constraints: time and cost:
Table 1. Project Performance Statistics [9] Year Successful (A) Challenged (B) Failed (C) Unsuccessful (B + C) Time Overrun Cost Overrun Undelivered Scope
1994 16% 53% 31% 84% N/A N/A N/A
1996 27% 33% 40% 73% N/A N/A N/A
1998 26% 46% 28% 74% N/A N/A N/A
2000 28% 49% 23% 72% N/A N/A N/A
2002 34% 51% 15% 66% N/A N/A N/A
2004 29% 53% 18% 71% 84% 56% 36%
2006 35% 46% 19% 65% 72% 47% 32%
2008 32% 44% 24% 68% 79% 54% 33%
2010 37% 42% 21% 63% 71% 46% 26%
2012 39% 43% 18% 61% 74% 59% 31%
For years 2004 to 2012, Table 1 shows no significant annual improvement when examining software project performance for these two constraints (i.e., time and cost) even while scope remains generally under delivered. Project success seems to be arbitrarily achieved by the reduction of project scope rather than improving performance using other drivers [5]. These findings should raise a significant concern for software technology managers. The implications are sub-optimal aggregate productivity, increased risk of missing project expectations, and a greater allocation of project resources than planned. Software quality predictors have been studied by several researchers in the past. In one such study, the analysis of an OSS repository, SourceForge, showed that software quality indicators such as the number of downloads, rank, operating system, language, and days-to-build can, in fact, be examined to predict outcomes [13].
Lee, Kim, and Gupta also point out abysmal statistics on OSS projects [14]. They note that most of the success with large OSS projects can be attributed to backend servers and internet-related software. The number of failed or dormant OSS projects is notable.
They base their findings on data extracted from SourceForge and confirm that most OSS projects have ended in failure. An alarming 58% of the projects do not advance beyond the alpha developmental stage, 22% remain in the planning phase, whereas the remaining 17% remain in the pre-alpha phase, and some become inactive. The authors point out similar results which have been reported by the World Bank which cites an excess of 50% failure rates for OSS projects [15]. With such results and claims, additional research on software process improvement and related investments appears justified.
A study conducted over one hundred assessments as part of a research project to better understand software productivity [16]. The findings on the performance levels of managers and technical staff are summarized in Table 2:
Table 2. Comparison of Management and Technical Performance Levels Management Activities Sizing Fair Estimating Poor Planning Fair Tracking Poor Measuring Poor Overall Poor Technical Activities Analysis Fair Design Fair Coding Good Reviews Poor Testing Good Overall Fair to Good
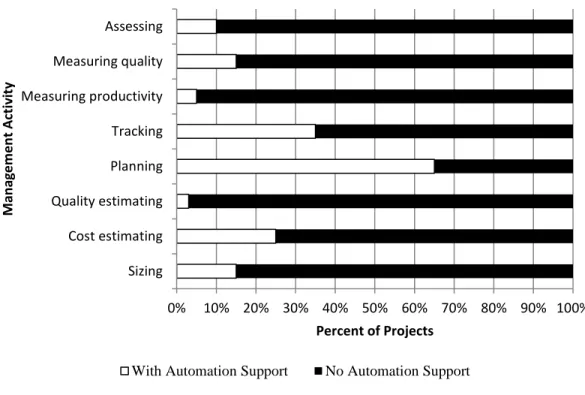
A comparison of projects using automation with those that do not use any automation in their assessment processes is shown in Figure 6 below.
Figure 6. Automation in Key Software Project Management Activities
A correlation between the presence or absence of project management automation and practical results on software projects has been observed. 40% of large software projects having 2,000 function points or more miss their anticipated delivery dates by more than six months and about 15% miss by more than 12 months. In addition, some large projects are canceled and not delivered at all [16]. When either automated planning or automated estimating methods are used, approximately 12% of software projects miss their scheduled dates in excess of 6 months and about 5% were delayed by more than 1 year. When both methods are used, less than 5% of software projects miss their delivery dates by more than 6 months, and only 1% were delayed by more than 1 year. A secondary benefit is also observed. Since automated estimating and planning tools provide a much stronger grounding, the use of these tools prevents arbitrary efforts to compress schedules without rationale.
0% 10% 20% 30% 40% 50% 60% 70% 80% 90% 100% Sizing Cost estimating Quality estimating Planning Tracking Measuring productivity Measuring quality Assessing Percent of Projects M an ag e m e n t A ctiv ity
Table 3 shows that larger software projects have a higher risk of cancelations or major delays when compared to smaller projects:
Table 3. Probability of Selected Outcomes [17]
Early On Time Delayed Canceled
1 FP 14.68% 83.16% 1.92% 0.25% 10 FP 11.08% 81.25% 5.67% 2.00% 100 FP 6.06% 74.77% 11.83% 7.33% 1000 FP 1.24% 60.76% 17.67% 20.33% 10000 FP 0.14% 28.03% 23.83% 48.00% 100000 FP 0.00% 13.67% 21.33% 65.00% Average 5.53% 56.94% 13.71% 23.82%
In his paper, Jones further highlights the risk of client conflict, lost credibility, and risk of litigation resulting in immense financial stress to organizations because of the delays [18]. The author confirms that the most frequent complaint about software projects from executives in the private and public sectors is that the larger the software system, the greater the delays experienced with delivery schedules. Figure 7 depicts this problem in terms of function points (FP) and delivery schedule delays:
Figure 7. Planned Versus Actual Software Schedules [17]
A study conducted in 2001 of 1,000 U.S. software projects further substantiates the notion that on average, larger projects experience greater delays. Software development schedules depicted in Table 4 are in calendar months (in decimal units) for 6 size ranges and 6 categories of software projects: end-user development; management information systems (MIS), outsource projects (OutS), commercial software (Comm), system software, and military software [19]:
Table 4. Average Software Schedules (in Calendar Months)
End-User MIS OutS Comm System Military Average
1FP 0.05 0.10 0.10 0.20 0.20 0.30 0.16 10FP 0.50 0.75 0.90 1.00 1.25 2.00 1.07 100FP 3.50 9.00 9.50 11.00 12.00 15.00 10.00 1000FP 0.00 24.00 22.00 24.00 28.00 40.00 27.60 10000FP 0.00 48.00 44.00 46.00 47.00 64.00 49.80 100000FP 0.00 72.00 68.00 66.00 78.00 85.00 73.80
Table 4 highlights some potential nuances among software variants in various yet representative categories. As supported by the data, larger and more complex software is deployed by military organizations, core systems, and those having their own intrinsic commercial value in the market place. This is also highlighted by the longer delivery schedules to allow for longer testing cycles for these categories of software. For example, if these categories of software are contrasted with software that serves the end-user community, the data show that end-user software is generally of lower complexity and consequently shorter delivery timelines. It is also reasonable to assume that this is due to simpler requirements and perhaps lower risk perceived by sponsoring organizations catering to individual end-user needs than those catering to larger constituents with expansive software utility and more at stake.
In a study that examined 250 large software projects over a 9 year period, software management practices were examined to determine patterns inherent in project failures and successes. The study confirmed a few patterns which are of particular relevance to this research study and provides added impetus [20]:
1. The majority of schedule and cost overrun related failures occur in the testing stage caused by poor project quality control, management of defect resolution, and planning for the remaining stages of the project. These factors are not as easily predictable in advance by the project management team. This naturally substantiates premise of this research study which is to focus metrics that most closely correspond to the later stages of the project execution phase – testing and deployment.
2. Most project failures trace back to poor project planning while successful project planning methods tend to be highly automated. This declaration further supports the need to improve automation tools for the software PM in particular and is, therefore, a focus area of this research study.
3. Successful projects have a higher defect resolution rate when compared to unsuccessful projects. The study found that successful projects experience 4.0 defects per function point and remove about 95% before deployment. Unsuccessful projects experience 7.0 defects per function point and remove only about 80% before deployment.
4. Projects use one or more project management tools with varying degree of proficiency and sophistication. However, most of these tools were built for other applications aside from software engineering and do not offer any estimating capabilities, quality control features, or measuring of efficiency issues (e.g. defect removal efficiency).
It must be recognized that organizations work towards managing projects to maximize business benefit while minimizing the risk of related financial losses. Since delayed schedules can often result in increased cost, larger projects are of particular concern to sponsoring organizations since they tend to have longer delivery schedules and therefore an increased risk of experiencing substantial delays. By some measures and reports, software project failure costs and its associated implications are staggering:
• A report by Roger Sessions in 2009 stipulated that cost of IT project failure as a percent of GDP to be as follows: $6,180B (world), $1,225B (USA), $3.9B (New Zealand), $200B (UK), and $110B [21]. The report further shares that IT project
failure costs have surmounted to over $500B per month and the problem is getting worst. While these numbers represent IT aggregate numbers, the percent attributed to software related failures is lower yet still staggering [21].
• 80% of technology projects actually cost more than they return [22].
• Up to 80% of budgets are consumed fixing self-inflicted problems [23].
As discussed earlier, there continues to be a large need and associated benefit of using greater data-based automation to manage software engineering projects. In fact, the need and benefits of doing so are universal in engineering and have also been confirmed for other types of projects showing that less-performing projects present significantly lower system utilization levels than the other projects [24]. Another study by Raymond established that the use of robust project management information systems is advantageous to PM’s. The study confirmed improvements in effectiveness and efficiency in conducting managerial tasks related to project planning, scheduling, monitoring, and control. Improvements in productivity were also observed in terms of timelier decision-making [25]. This study also acknowledged that benefits often extend beyond the PM as an individual to the performance of the overall project. Such benefits included improved budget control, meeting of deadlines, and addressing technical complexity with greater ease than without having such systems in place [25].
Previous research substantiates the need for improved predictive modeling tools and techniques to alleviate challenges that result in project delays such as quality, number of defects, and complexity of software. This call for action is a key motivator for this research study.
The study of the software industry and the associated management challenges would not be complete without some important notes on factors that make projects in this industry different from other industries such as construction, automotive, scientific exploration, and medicine. Many of the techniques of general project management can be applied but software projects have certain characteristics that make them different. Most software is inherently invisible, generally complex, virtually changeable, and easily conformable [26-31]. Software project management is a process of making visible that which is invisible. Unlike a bridge being constructed, software progress is not immediately visible. Software products are more complex when measured per unit of currency, than other engineered artifacts. The ease with which software can be changed is usually seen as one of its strengths. However, this means that where the software system interfaces external systems, it is expected that software can be changed to accommodate when necessary. Software systems are likely to be subject to a high degree of change. This results in higher pressures on software project management practitioners resulting in greater variability of outcomes. Software project managers need to trade-off characteristics, preferences, and quantities while balancing requirements, expectations, perceptions, opportunities, and risks [32]. Real-time decision-making frameworks and techniques are crucially important as they can help alleviate these challenges.
3.2. Software Quality Attributes
As stated previously, many researchers have utilized a vast amount of OSS data which is publicly accessible through various software repositories. These OSS repositories can be used to gain insights into the software development process, its management, and its effectiveness. In this research study, OSS data can be used to
understand and develop improved measures of success for software projects. Measuring project success is useful for the effective and reliable assessment of ongoing projects. Measuring success is also extremely useful when software is monetized in both the OSS and PSS communities. Software project sponsors can only evaluate the return on investment if success criteria can be identified and subsequently measured. Over the years, software success has been measured in numerous ways and with varying levels of sophistication. A commonly cited model for Information Systems (IS) success was developed by DeLone and McLean [33] and is shown in Figure 8. This model suggests six interrelated measures of success: system quality, information quality, use, user satisfaction, individual impact, and organizational impact:
Figure 8. DeLone and McLean’s Success Model [33]
While the model above is considered reasonable and complete by many researchers, the literature review also suggests several challenges when trying to measure results for some of the variables referenced in the model. Crowston et al. describe each measure of success and identify key indicators [34]. They also admit to potential issues for each based on their research especially as it relates to OSS, the primary data source of interest for this study. Table 5 below summarizes these findings and claims:
Table 5. Summary of Measures of Success, Indicators, and Potential Issues
Measure of Success Indicators Potential issues
Measure of Success Indicators Potential issues Information
Quality
completeness, conciseness, portability, consistency, maintainability,
testability, usability, reliability, structure, efficiency),
Documentation quality.
generally good in OSS so the measure may prove to be of minimal value – in software engineering code quality does not imply software project execution quality.
•Data related to code quality in OSS repositories may not be adequate.
•Many of the quality indicators are highly subjective in nature making it difficult for researchers to code accurately.
User Satisfaction User ratings,
Opinions on mailing lists, User surveys.
•Surveys are the only reasonable way of ascertaining this measure; surveys are often subjective and based on a non-random sample (i.e., users who take the time to volunteer a rating within the OSS community).
Use Use (e.g. Debian Popularity Contest), Number of users,
Number of downloads,
Inclusion in package distributions, Popularity or views of information page,
Package dependencies, Reuse of code.
•The best measure of the four identified by DeLone and McLean’s Success Model.
•Used by many studies as an indicator of success.
•Especially relevant for OSS.
•In research, must adjust for the
phenomena that highly successful (and stable) software may not be downloaded too often
Measure of Success Indicators Potential issues
as there would be no need by users to do so.
Individual and Organization Impacts
Economic and other implications. •Impact measures are difficult to define for OSS and PSS projects; they are even harder for OSS due to the difficulty in defining the intended user base and expected
outcomes.
Usage and user satisfaction related measures are easiest to measure with the least amount of issues that can be anticipated as shown in Table 5 and therefore highlighted in Figure 8. Based on these findings, many researchers have settled on relating software success to the level of use of the software over periods of time [14, 34]. It has been acknowledged that software measurement is required for practical software process improvement (SPI) to ensure improvements are actually addressing the correct issues [35]. SPI has been in the spotlight in industry and academia in recent years. Additional bodies of research and publications have focused on practical SPI. Despite the increased focus placed on SPI by researchers, change management professionals, quality assurance managers, process owners, and researchers continue to be challenged in defining success achieved in SPI [35-37]. After conducting an independent literature review, Abrahamsson appropriately lays out SPI success dimensions and differentiates between “hard” and “soft” measures with a relative estimate of difficulty in attainment in Table 6 below [38]:
Table 6. SPI Success Dimensions
Success Dimension Types of Measurements
Relative Estimate Difficulty
Project Efficiency Hard measures (e.g. work effort) Low
Impact on the Process User Soft measures (e.g. satisfaction, ease of use; work morale; level of excitement, teaming,
collaborative practices used)
High
Business Success Hard measures (e.g. productivity) Moderate
Direct Operational Success Hard measures (e.g. defect ratio) Moderate
Process Improvement Both (experience database) High
As with software metrics, one can reasonably assume that SPI related soft measures such as satisfaction levels, morale, and level of excitement are more difficult to measure with sufficient objectivity than hard measures such as level of productivity and defect ratios. Soft measures present the greatest challenges when measuring their direct impact on SPI. Such measures have increased subjectivity and may not be easily attributable to a specific SPI related variable (e.g. individual morale can be influenced by many variables).
Equally important to using proven predictors is the notion of establishing metrics that can be tied to processes being addressed programmatically as part of the software engineering process. Catal suggests that metrics based models are so important that they must be frequently revised (i.e., real-time) while the project is underway – perhaps even rebuilt from scratch each time the process or the organization experiences a change [39]. Other researchers have also suggested that evaluation and prediction are two separate learning schemes using historical defect data to predict defects for new data [40]. Song, Shepperd, and Liu note considerable variations in the performances of predictors across
data sets suggesting that a simple search for the “best” predictor may prove to be pointless unless the research is targeted towards answering a very specific question [40].
At this time, there is an important and final point to be made regarding the dangers of measurement and software metrics in general. While DeMarco classically reminds us that in order to be able to control a process or a product, measurements are a definite prerequisite, he equally reminds us that it can be very expensive to collect “good” metrics and even more expensive if “bad” ones are inadvertently collected and used [41]. However, the author goes on to support his claim that software metrics are worth it in the end as they can help the organization improve processes and focus management attention on the real drivers to course correct when necessary. Dekkers and McQuaid submit that measurements can enhance or misguide software projects [42]. The authors explicitly state that it behooves software project management spend the required time on the people and cultural issues that ultimately can provide lasting remedies. These findings support the motivation and premise for this research study and guide the efforts accordingly. This research will focus on hard measurements (i.e., easier to measure, more objective, and more quantifiable measures) in favor of subsequent management action required to course-correct projects by adjusting the levers in softer aspects (i.e., culture, environment, and change management aspects) that impact projects. The social science aspect of timely management decisions in these softer areas of software project management has been amply studied and conjectured by academia and industry practitioners. However, a gap appears to be in the use of the hard measures in real-time while project activities are underway to drive timely management intervention to achieve course-correction before
3.3. Research Data Validity
One of the greatest challenges experienced when researching the quality of software management is the reluctance of organizations to share unbiased data related to their own software management practices. In their research study, Tripathi et al. reviewed 187 research studies that span over a period of 5 years (2010 to 2014) and found that 91.9% of them rely solely on OSS datasets and only 14.4% involve university-industry collaboration [43]:
Figure 9. Mining Software Research Spanning 5 Years – Study of 187 research papers, 2010 – 2014
Subsequently, Sureka et al. reported that more than 50% of the researchers which they surveyed had reported difficulties in obtaining industry data on software and indicated that this was a major impediment to greater university-industry [44]. OSS communities have helped to address this research data gap to some extent [13, 44-48]. Many researchers and practitioners have acknowledged that there is an abundance of OSS data available and some of these are proven and tested as reliable inputs for conducting unbiased research in related areas. Large OSS communities of actively engaged contributors have documented the features of numerous software products and various
other key process related attributes that help researchers understand the quality of software development and management practices. Proper due diligence to appropriately consume OSS data can be facilitated to determine track record, performance, and maintenance aspects of software [49].
The validity of software engineering research and supporting sources of data continues to be investigated by researchers. By recognizing the benefits and biases of various data sources, researchers can better improve research quality and address the issues of validity given the differences between proprietary and open source software development. Mathieu et al. [50] establish a key connection between OSS creators and entrepreneurs by examining OSS creator motivations across 3 entrepreneurial dimensions: the opportunity, the organization, and the business models. They find similarities as both constituents exclusively aim for value creation. With regards to OSS-based business models specifically, the authors find that they fall into one of 5 categories: donations or gifts from users, enhancements of preexisting products, software sold for commercial interest, services-based offerings, and services-based partnerships. This finding supports modern day market place realities of OSS and explains how globally based open entrepreneurs have self-organized themselves initially and virtually to ultimately create enhanced, mega-sized commercial software adaptations leveraging the open source movement. Open source software (OSS) and related communities provide product offerings that compete head-to-head with proprietarily source software (PSS) across most emerging software categories, including cloud-based operating systems (e.g. Linux) web server technology (e.g. Apache HTTP Server), database engines (e.g. MySQL Database), Web 2.0+ development environments (e.g. PHP), and widely adopted
internet browsers (e.g. Firefox) [50-52]. In fact, OSS provides ample opportunity for generating revenue and reducing certain costs and is therefore heavily leveraged by most enterprises on a global basis. Table 7 shows relevant statistics and summarized results of a recent OSS survey (2016) by BlackDuck Software Enterprises, an independent authority on OSS and has been surveying the market annually for the past 10 years:
Table 7. OSS by the Numbers [53]
Statistic
Percent of enterprises globally run on OSS 78%
Percent of enterprises that do not rely on OSS 3%
Estimated number of active OSS projects 180,000+
Percent of enterprises contributing to OSS 65%
Percent increased use of OSS within the enterprise 65%
Top reasons cited for using OSS Increased efficiency, improved
interoperability, and greater innovation
Emerging technologies leveraging OSS Cloud computing components,
big data, content management, databases, operating systems, development tools, and mobile technologies
Notable examples of such OSS-based collaborative efforts include LINUX, Apache, MySQL, and the Java programming language.
In the category of large distributed projects, proprietary software systems (PSS) and OSS is very similar in nature. However, PSS teams generally operate with a greater degree of privacy, resulting in weaker datasets that are a barrier for research. This is especially true of software fault prediction and related data that has been experienced by researchers in the past [54]. OSS data, on the other hand, can provide a richer data set full of insights that are transferable when trying to understand PSS management processes. Many organizations leverage the possibilities of increased globalization to widely
distributed teams in an effort to maximize PSS team productivity. Such software development practices mirror those of the open source [55].
A separate body of research has theorized extensively on organizational learning in the context of software development. Organizational learning is a prerequisite for long-term, continued adoption of software quality predictive models. In order for predictive models to be effective and sustaining, sponsoring organizations must be willing to learn and they must have a robust knowledge management process already in place. Classic research studies such Raymond’s Cathedral and Bazar [56] explain that OSS and PSS communities have vastly different cultures in the way in which they release software and their fear threshold for rejection by their peers. The author claims that, by nature, OSS is served by iterative communities who strive for small incremental wins whereas, in contrast, commercial vendors (considered as part of the PSS community) are expected to strive for increased perfection than the frequency of release, defect resolution, and predefined software quality goals. The implication is that it is the commercial aspect which drives PSS delivery, not the individuality and free spirit which drives OSS community members. More generally, the authors seem to imply that intrinsic motivators behind the actions taken by key actors are perceived as being different for the two communities being compared. Israeli and Feitelson [57] highlight the dominating indicators of software success as being market share in the case of PSS and the number of downloads in the case of OSS. However, the findings of this body of existing research need to be tempered appropriately by recognizing that the main purpose being strived for is singular in either case; it is to develop good quality software products which command high rates of adoption by the target set(s) of users. A second argument can be made that
organizational learning happens within both OSS and PSS communities as long as the appropriate tools are made available to capture the right data, organize the information, and engage community members adequately. Third, from a practical perspective, OSS and PSS communities increasingly co-mingle and work in cooperation with each other since many of their members also benefit from having joint membership of both communities.
Huntley, while elaborating on the same topic, credits Raymond’s contrast of the two communities [58]. The author provides a strong argument and a perspective – while the individual OSS developer operates under minimal supervision and is not confined by lack of rigor and process, collectively these individuals are highly effective and are able to perform and create quality products over periods of time. The OSS communities achieve this by employing rigorous learning processes using specialized tools at each stage of the process (e.g. use of formalized bug tracking and version management processes). Some of these tools can be used to learn more about software quality processes which can have implications that are transferrable to both OSS and PSS projects.
Most primary research projects are bounded by the quality, availability, and accessibility of relevant data. This study is no different. SourceForge provides a large and adequate set of accessible data on OSS development projects. This has made the world’s largest repository a highly valuable data source for research [59]. Even still there have been concerns expressed about the accuracy and validity of data available in SourceForge. One of the key concerns that have been raised is the quality of the data that is generally available as some of it is self-reported by project owners and administrators [59]. Lerner and Tirole [60] provide a reasonable explanation that alleviates this concern.
The authors explain that project leaders use the data to recruit new developers, attract new users, and solicit donations for their projects. As such, any deliberate entry of inaccurate data regarding projects will be naturally avoided by those who are involved with OSS development on SourceForge. Software evolution researchers have found it acceptable to use OSS data repositories for certain types of research [44]. Notably, select Lehman’s laws [61] of software evolution specifically pertaining to measuring continuing software change and growth, also established measures of software quality in the PSS domain, were deemed to be applicable to OSS [62].
The SourceForge repository was selected as the primary source of research data for this study. The criteria used for selection include relevancy, accessibility, reliability, sufficiency, validity, and longevity. SourceForge originated in 1999 and was the first provider of free and open source software (FLOSS). Over the years, the independent company was owned by many other larger ventures such as VA Software, Dice, and BizX LLC. SourceForge remains the industry default OSS repository and boasts having industry-leading tools, a collection of 430K+ projects, 3.7M+ registered users, 41.8M+ customers of software, and 4.8M downloads per day [63]. Earlier in the research effort, there were concerns that the repository’s vastness may prove to be its limitation. After further research, a solution was discovered. Exclusively for research purposes, the SourceForge Research Data Archive (SRDA), located on the University of Notre Dame data servers was created in 2003 after a group of researchers received several grants from the National Science Foundation (CISE IIS-Digital Society & Technology program under Grant ISS-0222829 and by the CISE Computing Research Infrastructure program under Grant CNS-0751120) [64].
The SRDA assimilates and normalizes a collection of OSS data directly from SourceForge on a monthly basis [46]. This practice has continued until September 2014 after which the data was frozen and has been made available for use for further research. Selected data feeds from 2003 to 2014 are licensed and provided by SourceForge to SRDA developers for research consumption. Over 100 researchers worldwide have used this data archive for research purposes because of its accessibility, ease of use, and reliability [64]. The data is made available in a relational database format which can be queried using standard SQL procedures. It is anticipated that the following data entities from SRDA will be used in support of this research study. Detailed data relationship diagrams are supplemented in Appendix A section of this report. The key data entities are shown in Figure 10 below:
Figure 10. Select Data Entities from SRDA
The SRDA has served as an established and reasonably reliable source of data used by software researchers in the past. As part of this research effort, 91 research
• Contains bugs (defects logged) for all projects on the SRDA 1. Artifact-Bugs
• Contains relationships between groups and packages 2. FRS Package
• Contains activity related to releasing software 3. FRS Release
• Contains information regarding software groups 4. Groups
• Contains select aggregate data about projects 5. Stats Project All
• Contains categories of software 6. Trove Category
• Containes relationships between groups and categories 7. Trove Group Link
publications that were readily accessible have been analyzed to determine the knowledge contributions made by the studies. The analysis has been summarized in Figure 11:
Figure 11. SRDA – Existing Research – 10 Year Period, 2007 to 2016
During the past 10 years, most of the focus of existing SRDA based research has (i.e., 82%) has been placed on better understanding OSS processes and the study of human networks and collaboration mechanisms within OSS communities. While such research provides valuable insights and support to this research study, there remains ample
research opportunity to leverage SRDA data for direct benefit to software project management and industry practitioners. It is also evident from our comprehensive review that existing research outcomes, while interesting and quite possibly applicable to the software management industry, remain in academia; there have been no frameworks, blueprints, or methods offered to aid in institutionalizing the research to help firms realize the potential organization benefits of the research. Cumulative year-wise analysis of SRDA based publications, publisher analysis and a detailed cross-reference table supporting the analyses presented in this section has been included in Appendices B.1, B.2 and B.3 respectively.
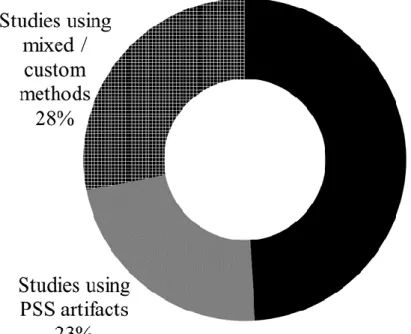
With further regard to the validity of OSS data in academic research efforts, Wright et al. investigated 266 empirical studies and found that 49% used OSS artifacts exclusively while only 23% used PSS artifacts for research [55]. The remainder used a custom (e.g. derived) or a combination approach as shown in Figure 12:

![Figure 7. Planned Versus Actual Software Schedules [17]](https://thumb-us.123doks.com/thumbv2/123dok_us/1480943.2698280/33.918.179.860.126.565/figure-planned-versus-actual-software-schedules.webp)