S
S
S
e
e
e
n
n
n
s
s
s
o
o
o
r
r
r
s
s
s
&
&
&
T
T
T
r
r
r
a
a
a
n
n
n
s
s
s
d
d
d
u
u
u
c
c
c
e
e
e
r
r
r
s
s
s
© 2014 by IFSA Publishing, S. L.
http://www.sensorsportal.com
Simulation and Optimization of SCR System
for Direct-injection Diesel Engine
1
Guanqiang Ruan,
2Zhendong Zhang,
1Jinrun Cheng
1
Shanghai Dianji University, No. 88, Wenjing Road, Minhang District, Shangshi, 200245, China
2
University of Shanghai for Science and Technology, No. 516, Jungong Road, Yangpu District, Shangshi, 200093, China
1
Tel.: +86-021-64300980 E-mail: [email protected]
Received: 24 July 2014 /Accepted: 30 October 2014 /Published: 30 November 2014
Abstract: The turbo diesel SCR system has been researched and analyzed in this paper. By using software of CATIA, three-dimensional physical model of SCR system has been established, and with software of AVL-FIRE, the boundary conditions have been set, simulated and optimized. In the process of SCR system optimizing, it mainly optimized the pray angle. Compare the effects of processing NO to obtain batter optimization results. At last the optimization results are compared by bench test, and the experimental results are quite consistent with simulation. Copyright © 2014 IFSA Publishing, S. L.
Keywords: SCR, Simulation, Optimization, Experiment.
1. Introduction
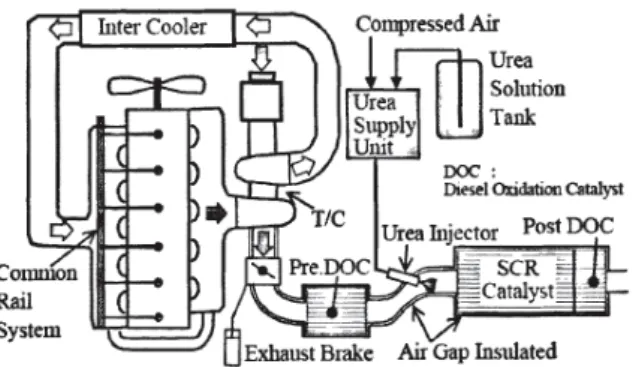
The diesel engine gets higher thermal efficiency, lower fuel consumption and CO2 emissions than the gasoline engine. Presently the diesel engines are applied in all of the heavy trucks and most of the light truck. However, as the standard of diesel emissions get to be more and more rigorous all around the world, emission control of diesel particulate matter (PM) and NOx becomes the key to the development of diesel engine technology. Using high pressure injection technology can reduce PM emissions of combustion in cylinder, and then take the Selective Catalytic Reduction (SCR) technology to control NOx as the main way of electronic-control diesel engine exhaust gas processing [1]. The SCR technology path is shown in Fig. 1.
But there are some problems in the matching between the SCR and domestic diesel engine, the
optimization of SCR is imminent. In this article, with the software of FIRE, it has simulated the SCR process of exhaust, optimized the structure parameters of SCR and verified by experiment at the same time.
2. The SCR Model
2.1. Model Analysis
The main parameters of SCR shape are: input terminal diameter D1, connecting pipe diameter D2, connecting boss small terminal diameter D3 and big terminal diameter D4, catalytic converter cavity forepart diameter D5 and posterior diameter, D6, output terminal diameter D7, output boss small terminal diameter D8 and big terminal diameter D9, cavity minimum diameter Dmin and maximum diameter Dmax, maximum depth Tmax. Use CATIA to establish SCR sketches, and then set up 3-dimension model of the SCR as shown in Fig. 2 below based on the stereoscopic model function of CATIA.
Fig. 2. SCR three-dimensional model.
2.2. The Division of Grid
Export the 3-dimension model of the SCR catalytic reactor from the CATIA, save as STL file. Open FIRE and import the model. Choose the selections, set the airway inlet and outlet. Choose the demand of the grid, and then implement. Check the quality of the grid to ensure correct. FIRE is powerful software, in the simulation of SCR, there are three major steps: first is the division of grid; second is to import grid, set conditions, namely fluid properties, boundary conditions, the control equation. The last is calculation. As shown in Fig. 3 is the meshing result of the SCR catalytic reactor in FIRE.
Fig. 3. The SCR grid.
2.3. The Initial Boundary Conditions
1) The initial conditions.
In this paper, it has simplify the design of the intake and exhaust and SCR reactor, sets the reaction time as 1 s, calculation range is set from 0 s to 1 s. In the SCR module, the efficiency of catalytic reaction has a lot to do with time, it need choose of step width accurately, because the software needs to add a certain number to repeat operations in the process of numerical calculation, the step width in this article is set as shown in Table 1.
Table 1. Step width settings.
Reaction time/ºCA 0.1 0.4 1
Step width/(s/step) 0.05 0.002 0.005
2) Boundary conditions.
Boundary conditions can be divided into boundary conditions on velocity and boundary conditions on temperature, and the boundary conditions on velocity can be divided into sliding, no-slip and wall function law boundary conditions. Generally no-slip boundary conditions are suitable for viscous fluid. In this chapter, in the simulation process, SCR import, export, the wall of converters can be treated as the fixed walls, so choose no-slip boundary conditions.
In temperature boundary conditions, the boundary of the SCR can be divided into four parts of the import, export, reactor front wall and back wall. In this paper, the temperature boundary is processed as constant temperature in model calculation. The determination of SCR initial temperature boundary conditions can be based on experience, set the temperature of the inlet (BND_inlet) as 400 °C, the front wall (BND_wall) and the back wall (BND_wall_SCR) of reactor are taken as a fixed boundary, set the temperature as 300 K, set the temperature of inlet (BND_oulet) as 300 K, cylinder liner wall temperature (BND_Liner) as 470.15 K.
3. The Establishment of Model
3.1. Mathematical Model
In the catalytic converter there are mainly two parts of the spray zone and the catalytic reaction zone [2], assume that chemical reactions occur only in the latter zone. This article selects the porous media model simulate catalytic reaction zone of ceramic honeycomb carrier.
The gas flow characteristics accord to compressible viscous fluid Navier-Stokes equation [3], N-S equation for short. Multi-dimensional numerical simulation of gas flow is the numerical solution to this equation. In the simulation model, the conservation equations referred to in this paper are: the mass conservation equation, energy conservation equation, momentum conservation equation and component balance equation, in addition to the above basic conservation equation, as the model involves the gas flow issue, it also can use turbulent flow model and state equation of ideal gas. It is worth mentioning that the whole process is in steady state, namely it is believed that the flow state is time-varying, all the calculation use the turbulence model and SIMPLE algorithm [4].
Equation (1) is the mass conservation equation:
( )
0t xj uj
ρ
ρ
∂ + ∂ =
where
u
j is the velocity component inj
direct
m
⋅
s
−1
;ρ
is the density,
kg m
⋅
−3
. Equation (2) is the momentum conservation equation:(
)
( ) t ij i i j i i j i j u u u g f x x xτ
ρ
ρ
ρ
∂ ∂ + ∂ = −∂ + + − ∂ ∂ ∂ ∂ , (2)where
p
is the hydrostatic pressure[ ]
P
a ; g is the acceleration of gravity
m
⋅
s
−2
;τ
ij is the viscous stress tensor effect on practical control volume surface of fluid[ ]
P
a .Equation (3) is the energy conservation equation:
(
)
0 0 0 ( ) ( ) t j j j h j h h h u h S x x x ρ ρ ∂ + ∂ = ∂ Γ ∂ + ∂ ∂ ∂ ∂ , (3)where h is the total stagnation enthalpy, 2 2 i p u h=c T+ , 1 [ ] J kg K − ⋅ ⋅ ;
S
h is the chemicalreaction and element strength of outside radiant heat. Equation (4) is the component balance equation:
(
)
( ) ( ) t l l j l l l j j j m m u m R x x x ρ ρ ∂ ∂ + ∂ = ∂ Γ + ∂ ∂ ∂ ∂ , (4)where
y
a is the chemical component quality fraction of unit volume; Da is the diffusion coefficient of components, 2 1m s−
⋅
; ρω is the source term of the chemical reaction rate.
Equation (5) is the state equation of ideal gas:
a a a RT p n RT m
ρ
= = , (5)where
n
a is the molar mass of components 1kg mol−
⋅
; R is the gas constant 1
[ ]
J kg K −
⋅ ⋅
; T is
the gas temperature
[ ]
K .In the process of movement, droplets will be affected by a variety of resistance, the resistance greatly depends on the spatial distribution and motion of droplet, the droplets in catalyst reactor are mainly affected by air drag force and gravity, the momentum balance equation of droplets is as follows:
(
)
. . . . . 3 1 4 g g i d D i g i d i g i d i d d d du C u u u u g dt D ρ ρ ρ ρ = ⋅ ⋅ ⋅ − ⋅ − + − ⋅ , (6) whereu
i d. is the droplet velocity component ini
direction;u
i g. is the gas flow velocity componentin
i
direction;ρ
d,ρ
g are the droplet and gas density respectively; Dd is the diameter of the droplets;g
i is the gravitational acceleration.Equation (7) is the instantaneous position of the droplet: , , i d i d dX u dt = , (7)
where
X
i d, is the droplets position vector ini
direction.3.2. SCR Catalysts Model
The ceramic honeycomb carrier researched in this paper large number of channel, each channel width is very small, only about 1 mm. researching directly the flow of each channel is complex, and even impossible, so we do need hypothesis for the model and simplify it.
Ceramic honeycomb carrier is of porous medium, equivalently tube bundles composed of a lot of tubules arrayed parallel. All gas phase fluid in different tubule flow along the carrier from the beginning to terminal in the same axial velocity. The fluid only has an axial velocity component; the other velocity component is zero.
According to Hammel model, calculate the gas pressure loss, and then according Darcy’s law, put forward extended model. This management can make it more similar to the actual situation, closer to the test data [5].
2
i i i i ip
v
v v
x
ρ
α μ
ς
∂ = − ⋅ ⋅ ⋅ ⋅ ⋅
∂
, (8)where
μ
is the dynamic viscosity;α
i is the viscosity loss coefficient (i
refer to the X, Y, Z direction);ς
is the inertial loss coefficient;v
i is the local velocity components;ρ
is the fluid density.Due to the higher exhaust temperature, evaporation of water makes urea solution separate out urea, the temperature reaches melting point, and urea generates ammonia and isocyanic acid by pyrolysis reaction [6].
2 2 3
NH CONH →NH +HNCO, (9) Because isocyanic acid is steady out of touch with catalyst, so it can be believed that the isocyanic acid hydrolysis reaction occurs only with the catalyst, without catalyst urea occurs only pyrolysis reaction [7]:
2 3 2
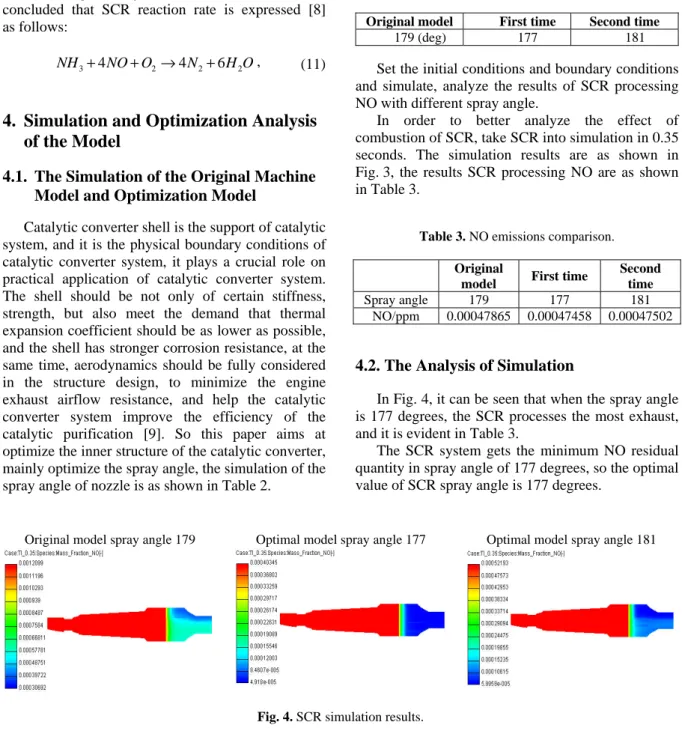
According to Eley-Rideal mechanism it can be concluded that SCR reaction rate is expressed [8] as follows:
3 4 2 4 2 6 2
NH + NO O+ → N + H O, (11)
4. Simulation and Optimization Analysis
of the Model
4.1. The Simulation of the Original Machine Model and Optimization Model
Catalytic converter shell is the support of catalytic system, and it is the physical boundary conditions of catalytic converter system, it plays a crucial role on practical application of catalytic converter system. The shell should be not only of certain stiffness, strength, but also meet the demand that thermal expansion coefficient should be as lower as possible, and the shell has stronger corrosion resistance, at the same time, aerodynamics should be fully considered in the structure design, to minimize the engine exhaust airflow resistance, and help the catalytic converter system improve the efficiency of the catalytic purification [9]. So this paper aims at optimize the inner structure of the catalytic converter, mainly optimize the spray angle, the simulation of the spray angle of nozzle is as shown in Table 2.
Table 2. Spray angle optimization settings.
Original model First time Second time
179 (deg) 177 181
Set the initial conditions and boundary conditions and simulate, analyze the results of SCR processing NO with different spray angle.
In order to better analyze the effect of combustion of SCR, take SCR into simulation in 0.35 seconds. The simulation results are as shown in Fig. 3, the results SCR processing NO are as shown in Table 3.
Table 3. NO emissions comparison.
Original
model First time
Second time
Spray angle 179 177 181
NO/ppm 0.00047865 0.00047458 0.00047502
4.2. The Analysis of Simulation
In Fig. 4, it can be seen that when the spray angle is 177 degrees, the SCR processes the most exhaust, and it is evident in Table 3.
The SCR system gets the minimum NO residual quantity in spray angle of 177 degrees, so the optimal value of SCR spray angle is 177 degrees.
Original model spray angle 179 Optimal model spray angle 177 Optimal model spray angle 181
Fig. 4. SCR simulation results.
5. Experiments
5.1. Test Equipment
To verify the correctness of the simulation results, two kinds of SCR systems with different spray angle are tested on bench. Use the CW260-1800/7500 - T490 dynamometer, and FST2CPUMApen1. 2.1 engine numerical-control system to control the working condition, AVL CEB-II exhaust analyzer is used to measure the conventional gaseous emissions of NOx, HC and CO. Use AVL SPC472 partial flow dilute particle sampling device to acquire exhaust particles, weigh it for PM total mass.
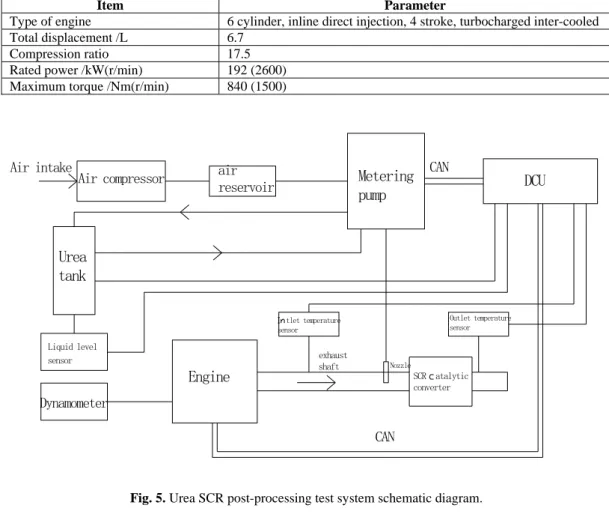
Experimental testing method is based on two kinds of working conditions, one is the steady-state circulation working condition, and the other one is transient cyclic working condition. The diameter in SCR is 26.67 cm, and length 38.1 cm, with total volume of 22 L, the BASF catalyst is used in post-processing system. Temperature sensor in catalysts inlet and outlet is PT200. Metering pump adopts urea metering pump of Grundfos Company, it can achieve high-precision injection of liquid into the exhaust post-processing system. Urea injection electronic control unit (DCU) communicates with engine ECU through CAN [10]. The engine model is shown in Table 4, dynamometer device and emissions test device is as shown in Fig. 5.
Table 4. Cummins engine performance parameters.
Item Parameter
Type of engine 6 cylinder, inline direct injection, 4 stroke, turbocharged inter-cooled
Total displacement /L 6.7
Compression ratio 17.5
Rated power /kW(r/min) 192 (2600)
Maximum torque /Nm(r/min) 840 (1500)
Dynamometer DCU Liquid level sensor U r e a t a n k CAN CAN Metering pump air reservoir Air compressor Air intake SCR atalytic converter Nozzle exhaust shaft Engine Outlet temperature sensor tlet temperature sensor
Fig. 5. Urea SCR post-processing test system schematic diagram.
5.2. Experimental Results and Analysis
In the ESC test cycle, the NO emission volume fraction comparison after urea SCR emissions processing in the specific conditions with different
spray angle is as the following Fig. 6. It can be seen that in most of the ESC test cycle, the results with urea injection angle of 177 degrees is better than that of the original machine with urea injection angle of 179 degrees. Spray angle 179 operating mode (ppm) NO x Spray angle 177 550 13 12 11 10 9 8 7 6 5 4 3 2 1 200 500 450 400 350 300 250 150 100 50 0
Fig. 6. NOx emission volume fraction in ESC conditions.
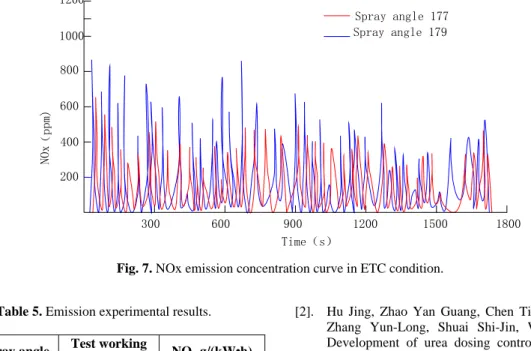
In the ETC test cycle, the comparison of NO emission volume fraction with different urea spray angle after SCR emissions processing is as Fig. 7. It shows that in most of the ETC test cycle, the results
with urea injection angle of 177 degrees is better than that of the original machine with urea injection angle of 179 degrees.
Spray angle 177 Spray angle 179 1200 1000 800 600 400 200 1800 1500 1200 900 600 Time(s) (ppm) NO x 300
Fig. 7. NOx emission concentration curve in ETC condition.
Table 5. Emission experimental results.
Urea spray angle Test working
condition NOx g/(kW•h) 177 ESC 3.12 ETC 2.31 179 ESC 3.32 ETC 2.87
6. Conclusions
In the case of optimizing SCR urea spray angle structure, simulate its effect on processing NOx emission. In the simulation diagram and the results, it can be seen that optimal structure is of great help to improve the ability of SCR exhaust processing. Finally with the SCR test bench, the results are verified. The optimal structure can improve the performance of the SCR exhaust processing, and it provides a direction for SCR system design and performance test research.
Acknowledgements
Project Supported by Foundation Project of Shanghai Dianji University (Project No. 12XKJC02) and Foundation Project of Shanghai Municipal Education Commission (Project No. E3-13SY14).
References
[1]. N. Jeuland, J. B. Dementhon et al., Performances and durability of DPF (diesel particulate filter) tested on a
fleet of Peugeot 607 taxis: final results, Society
of Automotive Engineers, 2004, SAE Paper 2004-01-0073.
[2]. Hu Jing, Zhao Yan Guang, Chen Ting, Chen Zhen, Zhang Yun-Long, Shuai Shi-Jin, Wang Jian-Xin, Development of urea dosing control unit for SCR after-treatment system of heavy duty diesel engine, Chinese Internal Combustion Engine Engineering, Vol. 32, No. 1, 2011, pp. 8-11.
[3]. VDl-Warmeatlas, Bereclmungsblatter fur den Warmenbergang, Verein Deutscher lngmieure, editor,
6th edition, VDbVerlag, Dusseldorf, 1991.
[4]. L. Lietti, I. Nova, S. Camurri, E. Tronconi,
P. Forzatti, Dynamics of the SCR-deNOx reaction by
the transient-response method, American Institute
of Chemical Engineers, Vol. 43, Issue 10, 1997, pp. 2559-2570.
[5]. E. Tronconi, I. Nova, C. Ciardelli, et a1, Modelling of SCR catalytic converter for diesel exhaust
after-treatment: Dynamic effects at low temperature, Catal
Today, Vol. 105, Issue 3-4, 2005, pp. 529-536. [6]. Da Yu Wang, Sheng Yao, Mark Shost, Ammonia
sensor for closed-loop SCR control, Society
of Automotive Engineers, 2008, SAE Paper 2008-01-0919.
[7]. Monica Calatayud, Basma Mguig, Christian Minot, Modeling catalytic reduction of NO by ammonia
OVeF V205, Surface Science Reports, Vol. 55,
Issues 6-8, 2004, pp. 169-236.
[8]. Zhang Wen-Juan, Shuai Shi-Jin, Dong Hong-Yi, Wang Zhi, Wang Jian-Xin, 3D modeling of flow, spray of reductant and surface chemical reaction in
diesel urea SCR-NOx catalytic converter,
Transactions of CSICE, Vol. 25, Issue 5, 2007, pp. 433-438.
[9]. Cristian Ciardelli, Reactivity of NO/NOx-NH3 SCR
system for diesel exhaust after treatment: Identification of the reaction networks a function of
temperature and NO2 feed content, Applied Catalysis
B: Environment, Vol. 70, 2007, pp. 8-90.
[10]. Hu Jing, Zhao Yan-Guang, Chen Ting, Chen Zhen, Zhang Yun-Long, Shuai Shi-Jin, Wang Jian-Xin, Study of control strategy for urea-SCR after-treatment system of heavy duty diesel engine, Chinese Internal Combustion Engine Engineering, Vol. 32, Issue 2, 2011, pp. 1-5.
___________________
2014 Copyright ©, International Frequency Sensor Association (IFSA) Publishing, S. L. All rights reserved. (http://www.sensorsportal.com)