Doctor of Nursing Practice School of Nursing
1-1-2017
Evaluating ADN Faculty Job Satisfaction
Karen M. ThiesEvaluating ADN Faculty Job Satisfaction
A Scholarly Project Presented to the Faculty of the School of Nursing Boise State University
In partial fulfillment of the requirements For the Degree of Doctor of Nursing Practice
By
Karen M. Thies, MN, RN
Approved: Dr. Teresa Serratt, Chairperson Dr. Sara Ahten, Committee Member
Approval Acknowledged: Dr. Pamela Strohfus, DNP Program Coordinator
Abstract Background
The U.S. is facing a critical shortage of nurses as the aging baby boomer generation is requiring more nursing care. Contributing to the nursing shortage is the inability to educate larger numbers of nurses, attributable to a lack of nursing faculty. Insufficient numbers of nursing faculty results in qualified applicants being turned away from nursing programs.
Project Design
This project evaluated faculty job satisfaction in 703 accredited Associate Degree Nursing (ADN) programs in the U.S. The Index of Work Satisfaction (IWS) (Stamps, 1997), was designed to measure specific factors of nurses’ job satisfaction and was emailed to all full and part time ADN faculty (n= 9,402) with email addresses identified on their institution’s website.
Results
The survey response rate was 26.3% (n= 2,479). The IWS analysis included two parts. Part A data were examined for the frequency of each component then the raw count was converted to a percentage of the whole sample. 1115 of 1748 respondents (64.56%) indicated that the component Autonomy was more important than pay. Autonomy was also considered more important than task requirements (83.33%), organizational policies (80.78%), professional status (84.33%) and interaction (82.88%).
The analysis of Part B assigned scores as unweighted estimates of the level of
satisfaction. A score was assigned to each component on a scale ranging from 5-70, with 5-25 representing the first quartile, indicating dissatisfaction and the 4th quartile, represented by the range of 28-70, indicating satisfaction. The three components of least satisfaction were salary (19.22), interactions between faculty and administrators (23.85) and task requirements (24.16),
while the components of greatest satisfaction were interactions (49.56), professional status (41.46) and the autonomy afforded by the position (38.76).
Recommendations
The findings in Part A of the IWS suggest that autonomy is valued higher than all other components, including salary. Program directors should consider providing nursing faculty with as much control as possible regarding scheduling, flex-hours and decision making. In Part B of the IWS, Interactions was a top component of job satisfaction; however, when analyzed by faculty-faculty interactions and faculty-administrator interactions, the latter component was the second highest area of job dissatisfaction. This suggests that program directors should focus on improving relationships between administration and faculty members in order to increase faculty's organizational commitment. When considering Task Requirements, administrators may be able to adjust or reallocate tasks, since frequently taking work home decreases the likelihood of retention (Bittner & O'Connor, 2012). These areas of least satisfaction for ADN faculty need to be addressed in order to have a positive effect in recruiting and retaining ADN nurse faculty.
Conclusions
The findings from this survey are congruent with similar findings from studies conducted with baccalaureate and graduate nursing faculty (Derby-Davis, 2014; Evans, 2013; Roughton, 2013). The nursing faculty shortage is a symptom of a pervasive nursing deficit. The three factors that are the least satisfying to ADN faculty are salary, task requirements and
organizational policies. These must be addressed by program directors as the profession seeks to address factors contributing to the nursing shortage.
Table of Contents
Abstract ...2
Problem ...6
Problem Change ...6
Background (including literature supporting problem)...6
Theoretical Model & Project Framework ...7
Implementation Process Analysis ...8
Setting and target population. ... 8
Economic, social and political environment ...9
Implementation strategies. ... 11
Program outcomes. ... 12
Project Evolution...12
Quality Assurance ...13
Bias & Threats to Quality. ... 13
IRB. ... 14
Results/Outcome Analysis ...14
Techniques for data collection and analysis. ... 14
Measures/indicators for assessing project outcomes. ... 16
Results. ... 17
Outcome Evaluation Analysis...19
Gap Analysis & Unanticipated Consequences...22
Financial analysis...22
Discussion and Recommendations...23
Maintaining and sustaining change...23
Strategic plan congruence...26
Implications to Practice...26
Policy Implications ...27
Lessons Learned...28
Dissemination to Key Stakeholders and/or Community Organization(s)...29
Conclusion...30
References...31
Problem
Qualified nursing school applicants are being denied admission into ADN nursing
programs due to a shortage of nursing faculty (National League of Nursing, 2014). Increasing the job satisfaction of current faculty may retain those members in their organizations. The factors that support positive ADN nurse faculty job satisfaction have not been adequately identified and therefore not addressed.
Problem Change
The first step towards initiating changes to retain nursing faculty is the identification and dissemination of the factors that contribute in ADN faculty job satisfaction. This step is aligned with the NLN's 2015-2016 Public Policy Agenda of increasing faculty retention (www.nln.org). The global wide shortage in nursing faculty is part of a cascading effect, as it impacts the number of qualified applicants admitted to programs, which limits the number of new nurses entering the field to care for the ever-growing number of aging baby boomers who will require care.
Background
ADN programs were initially created to provide a faster, more cost-efficient means of entry into the nursing job market; a necessity following the nursing shortages that occurred after World War II and the Korean War (Weiss & Tappen, 2015). Today they remain a faster means of educating entry-level nurses compared with 4 year baccalaureate programs. However, in 2012, ADN programs turned away 45% of qualified applicants, with 28% of those programs citing the primary factor as a lack of faculty. This is a higher percentage than applicants turned away from BSN programs, (36%), and diploma programs, (18%), (NLN, 2014). With more than 60% of the nursing workforce initially educated at the ADN level, a faculty shortage in ADN programs impacts the majority of prospective nurses, and the general public who will not have
adequate numbers of nurses to care for them (McCallister, 2012). One specific factor identified as the root cause of the faculty deficit was difficulty in attracting and then retaining nursing faculty (National Advisory Council on Nurse Education & Practice [NACNEP], 2010). This project sought to evaluate those factors that lead to ADN faculty job satisfaction, in order to inform academic leaders who are best positioned to positively address these factors, thus retaining faculty at their organizations.
A consistent theme in the literature review was the need for more data regarding the factors that contribute to job satisfaction for nursing educators (Derby-Davis, 2014; Gormley, 2003; Cash, Doyle, Von Tettenborn, Daines, & Faria, 2011; Gui, Barriball, & While, 2009; Lane, Esser, Holte, & McCusker, 2010). This identified paucity of literature on ADN faculty job
satisfaction and intent to leave was the impetus for the proposed DNP project. The significance of this ADN faculty focus lies in the fact that 60% of all nurses receive their initial education in ADN programs (McAllister, 2012).
Theoretical Model & Project Framework
The theory of Motivation-Hygiene (Herzberg, Mausner, & Snyderman, 1993) was utilized to guide this project in determining what factors constitute job satisfaction for ADN faculty nationwide. The primary tenet of this theory is people are satisfied in their jobs by the intrinsics of what they do; these factors are called the motivating factors and include items such as autonomy, recognition, achievement, advancement, and responsibility or the challenge of the work itself. Jobs, however, consist of extrinsic factors, as well. These hygiene, or extrinsic factors include items such as pay, supervision, work environment, organizational policies, benefits and relationships with colleagues. Herzberg, et al, (1993) found that when people were dissatisfied with their jobs, they were unhappy with the conditions surrounding the job, as
opposed to the work, itself, causing them to want to leave. Herzberg theorized that the extrinsic or hygiene factors independently do not lead to satisfaction, yet, without the hygiene factors, there will be no motivation. A representation of this theory is displayed in Appendix A.
The Index of Work Satisfaction (Stamps, 1997), is the measuring tool that was chosen and modified for this project, since it was specifically designed to:
• Measure the motivation-hygiene factors of nurses’ job satisfaction. • Be easily understood and utilized as a reliable and valid measurement • Be utilized routinely for the benefit of nurses (Stamps, 1997)
Permission to utilize and modify this tool is located in Appendix B and the tool, itself, is located in Appendix C.
Additionally, the Kellogg Logic Model (W.K. Kellogg Foundation,2006) was utilized for this project as an organizational framework which identified key project elements such as the project outcomes, objectives, inputs, activities, key resources and long & short term goals necessary to design and implement the project. All of these elementsfor the scholarly project can be viewed in the Kellogg Logic Model in Appendix D.
Implementation Process Analysis
Setting and target population. The project utilized SurveyMonkey™ to send the IWS (Stamps, 1997) modified survey via email to faculty members with published email addresses at 703 ADN programs nationwide over a one-month period. To enhance participation, a reminder email with the link to the survey was sent one week after the initial email, and a third reminder sent a week later, in order to achieve a better response rate through additional attempts
The target population consisted of full and part-time nursing faculty members with teaching responsibilities in the 703 ADN programs in the United States that are accredited by the Accreditation Commission for Education in Nursing (ACEN). With an average of 14 faculty members at each program, there were 9,402 emails for potential project participants sent by SurveyMonkey.
Economic, social and political environment
There are several barriers towards increasing nursing faculty. For one, the economic environment is not as lucrative as clinical practice. This is a significant barrier towards increasing nursing faculty at all levels of academia, and a subsequent cause for the waiting lists that are common for admission to nursing programs (Yucha & Witt, 2009).
Additionally, many public colleges do not have the resources to add to their faculty, due to significant budget reductions, which causes nursing programs to become creative in their staffing (Yucha, Smyer, & Strano-Perry, 2014).
From a social context, many nurses feel they lack the clinical expertise to become nursing faculty and this perception creates a barrier in seeking an academic position. Another barrier is the general lack of respect for teachers in America (Pordes, 2016). For nursing faculty, there is a misperception that nursing faculty have been away from bedside nursing for many years and are not up to date on the latest practices. Also, some nurses feel nursing faculty do not demonstrate the attributes of a nurse; nurturing, warm or caring, and do not want to emulate these behaviors; these perceptions are likely remnants from their experiences in nursing school. Other reasons nurses do not look at teaching positions include the lack of familiarity, as this wasn’t presented as a possible career option while in nursing school or early in their career (Moreland, 2011).
The political environment regarding the nursing faculty shortage is specifically correlated to funding and how the funds are provided. Frequently, lack of funds to increase the number of faculty is a barrier for many state education systems. Some states such as Wisconsin are mandating that state universities invest millions of dollars to increase economic growth and build a stronger workforce for the future. In response, a grant for 3.2 million dollars was awarded to the College of Nursing & Health Sciences at UW-Eau Claire, which is utilizing the money to increase the number of registered nurses within their programs, by expanding the number of DNP prepared nurses to specifically become educators (Young, et.al., 2016).
Politically, the U.S. government acknowledges the nursing shortage and offers a number of different grants and loans though the Health Resources and Services
Administration in order to recruit more people into the nursing workforce. Among these programs are the Faculty Loan Repayment Program, the NURSE Corps Scholarship Program and the NURSE Corps Loan Repayment Program (Health Resources & Services
Administration [HRSA], 2016).
Culturally, the lack of ethnic diversity in nursing faculty is also a barrier towards increasing nursing faculty. In efforts to remedy this, the National League for Nursing (NLN) strongly supports diversity and inclusion measures in both nursing education and practice. The organization encourages programs to welcome and sustain diverse faculty and students by designing and implementing curricula that respond to the health needs of all populations; by demonstrating a willingness to challenge intentional and unintentional biases that promote micro-inequities and barriers towards achieving diversity in nursing and nursing education (NLN Vision Series, 2016).
Implementation strategies. Several strategies were utilized in the implementation of the project. First, a pre-test of the IWS online survey was conducted in April 2016, to determine if the survey questions were written in a comprehensible manner. The result of the pretest was the subsequent re-writing of several questions. The targeted date of October 2016, to implement the project survey was strategically chosen to be congruent with nursing faculty work schedules thus maximizing the response rate. At this time of year, most programs were past the initial first chaotic weeks of a term, yet faculty was not inundated with the significant amount of work that frequently accompanies the end of a term. The initial survey was sent on a Monday night, so it would be in participants’ inboxes on Tuesday morning. Then, the first survey reminder for non-respondents was sent on a Sunday afternoon; a different day and time than the first one was sent, in order to capture more responses. The response rate was surprisingly large, with an increase from the initial responses of 11% to 22%. Many participants responded between Sunday afternoon and Monday night, in contrast to what was projected from Newcomer & Triplett (2015). The second and final survey reminder was sent the next Sunday afternoon, which elevated the response rate to the final 26. 3% (n = 2479).
Next, the decision to send the survey directly to nursing faculty emails ensured the participants were responding voluntarily, as opposed to a possible mandate from the program director. The decision to include only faculty participants from ACEN accredited programs was a strategy to utilize participants from institutions that had equivalent standards to meet
accreditation. Finally, the information disseminated to program leaders via conference presentations, as an outcome of this projectwas congruent with the goal of sharing relevant information to academic leaders to better prepare them to create an environment conducive to recruiting and retaining nurse educators. The timeliness of presentations is important, in order to
present the most current information so academic leaders may implement changes to retain nursing faculty.
Program outcomes. A national survey was conducted of both full time and part time faculty members in ACEN accredited ADN programs in the United States. The information gathered through the survey and then disseminated was aggregated national data as opposed to responses from faculty at specific institutions; general findings that are appropriate for any location. The outcomes for this project were divided into two phases. Phase I is the focus of this DNP project; Phase II will occur outside the DNP program timeframe. The program outcomes, objectives and activities for Phase I and Phase II of the project can be viewed in the Kellogg Logic Model in Appendix D.
Phase I project outcomes were:
• Identify the factors that contribute to ADN faculty job satisfaction by January 2017. • ADN faculty perceptions of factors contributing to job satisfaction would be
disseminated by December 2017, utilizing two modalities such as conferences or scholarly journals.
• ADN faculty's intent to leave academia in 1, 3 & 5 years would be disseminated by December 2017, utilizing two modalities such as conferences or scholarly journals.
Project evolution. The focus of the scholarly project was motivated by observations of high faculty turnover at the technical college where the DNP scholar was employed. The departing faculty would simply move to another community or technical college to perform in the same faculty role. Job satisfaction appeared to play a role in these transitions. The paucity of literature on ADN faculty job satisfaction indicated the need for more data regarding the factors that contribute to job satisfaction for nursing educators. The project became a nationwide survey
of ADN faculty to determine the factors contributing to job satisfaction.
The process of gathering the faculty email addresses began in the fall of 2015 and was completed in August 2016. A letter was sent to the National League for Nursing inquiring for a list of faculty members at ACEN accredited ADN programs. The response letter declining this request can be viewed in Appendix E. The lengthy process of acquiring the faculty email addresses involved looking up the website of each individual program, and then each individual faculty email.
Next, a pilot test was conducted to evaluate if the participants understood the questions. The pilot test of the modified IWS (Stamps, 1997) was emailed in April 2016, to 100 faculty members randomly chosen from the names acquired at that time. An analysis of the responses (n=16) indicated that several questions needed retooling to be more clear. The emails of those who were sent the pilot survey were then removed from the email list. The formal survey was emailed to the participants on the night of October 3rd, 2016, and an 11% response rate was
generated. A second email reminder was sent on Sunday, October 9th, and the response rate increased to 22%. The third and final reminder was sent on October 16th, and increased the final response rate to 26.3% or 2479 respondents. The complete timeline delineating all the project activities can be viewed in Appendix F.
Quality Assurance
Bias & Threats to Quality. The questions for the qualitative answers were assessed to ensure they were written in a neutral manner, so as not to lead the participant into answering in a specific direction. The dissemination of a pilot, or pre-test provided a means of looking at the answers given, and then allowed the project director to modify the questions, if needed. This assisted in neutralizing bias, in addition to being a quality control measure.
Questions in each category of Part B in the IWS are worded in both a positive and a negative manner. The reason for this is if a participant is provided with only positively-worded statements, there is the potential for a response bias. By wording the items both positively and negatively, this bias can be avoided (Stamps, 2012). The tables with the questions grouped for the 3 components of least satisfaction, pay, task requirements and organizational policies can be viewed in Appendices G-I.
Bias may have existed on behalf of any project participants who have engaged in similar projects, or, if their program directors required mandatory participation. To mitigate this possibility, the surveys were sent directly to the faculty members, and the survey instructions explicitly stated that participation was entirely voluntary and participants could exit the survey at any time.
Another method applied to avoid bias was to have a data analysis plan in place. In this plan, a paired-comparison technique was utilized in Part A of the IWS (Stamps, 1997) and a Likert-scale utilized in the data collection for Part B. The data analysis looked at the frequency of answers and converted these to an aggregated percentage. These two components were combined to assist in correctly interpreting the raw data, since inappropriate or inaccurate statistical techniques have been known to lead to an incorrect interpretation of survey results (Penwarden, 2015).
IRB. IRB approval was obtained from Boise State University prior to the start of this project. The letter of approval can be viewed in AppendixJ.
Results/Outcome Analysis
Techniques for data collection and analysis. Data were obtained from responses to questions via an anonymous online survey sent through SurveyMonkey™. By utilizing a
paired-comparisons technique in Part A, the tool's questionnaire weighs each of the six components (pay, autonomy, task requirements, organizational policies, professional status & interaction), based on its importance to providing satisfaction to the participants. This technique required the participants to choose which of two factors was most important to them and their level of
satisfaction. The data were examined and placed into a table listing the frequency of each component and then that raw count was converted to a percentage of the whole sample. The raw frequency data table can be viewed in Appendix K and the proportion table showing the
converted sample percentage is Appendix L. Next, a Component Weighting Coefficient for each of the six factors in Part A was calculated. The complete process is listed in Box 1.1 and the Z-Matrix used to calculate the Component Weighting Coefficient for each factor can be viewed in Appendix M.
Box 1.1
The data in Part B were obtained from survey questions utilizing a Likert scale. Each component had a minimum of five questions formatted in either a positive or negative manner to avoid a response bias. The analysis calculated the frequency of answers and presented the
percentages of participants who reported they either agreed, strongly agreed, disagreed or strongly disagreed. Next, scores were assigned as unweighted estimates of the level of
satisfaction. The score assigned to each component was on a scale ranging from 5-70, with 5-25
1. Create frequency matrix
2. Create a Proportion Matrix by turning the frequencies into percentages.
3. Create a matrix by converting the percentages into a proportion matrix value by utilizing a Z-value table that is provided in the scoring book.
representing the first quartile, meaning the element is at or below the 25th percentile of the total possible score, indicating dissatisfaction. The 4th quartile, represented by the range of 28-70, depending on the individual component, means the element is above 75% of the maximum total score, indicating satisfaction.
Regarding intent to leaving academe, three open-ended questions inquired about the reasons for leaving. During the analysis the qualitative answers for question numbers 84-86 were coded and categorized, then an enumerative method was used to highlight any patterns in the data.
The data were analyzed utilizing SurveyMonkey's™ analysis services. The findings from the analysis of the factors influencing faculty job satisfaction and intent to leave were then developed into recommendations to be disseminated to ADN program leaders. These recommendations and ‘lessons learned’ from this project are discussed in greater detail in a later section of this final report.
Measures/indicators for assessing project outcomes. Table 1.1 presents the three project outcomes of Phase I, as well as the indicators utilized to measure if the outcomes were met. The indicators of measurement for Phase II, which takes place outside the timeline for the DNP program, can be viewed in Appendix N.
Table 1.1
Outcomes Indicators Source of Data
Identify the factors that contribute to ADN faculty job
satisfaction by January 2017.
The top 3 factors of job satisfaction by frequency.
Modified IWS Part A & B
ADN faculty perceptions of factors contributing to job satisfaction will be disseminated
by December 2017, to at least
The dissemination will occur by 2 modalities, such
as conferences and/or publication in scholarly
Modified IWS Part A & B Open-ended questions in
70% of ACEN accredited ADN program directors
journals. ADN faculty's intent to leave
academia in 1, 3 & 5 years will be disseminated by December 2017, to at least 70% of ACEN
accredited ADN program directors
The dissemination will occur through 2 modalities,
such as conferences and/or publication in scholarly
journals.
Modified IWS Part A & B Open-ended questions in
the survey
Results. The most prolific reason ADN faculty leave academe within the next 1-3 years is retirement, which aligns with the fact that nearly 41% of respondents are between 55-64 years old. At the 5-year mark, the most commonly cited reason for leaving academe is pay. These questions and the results can be viewed in Appendices O-Q.
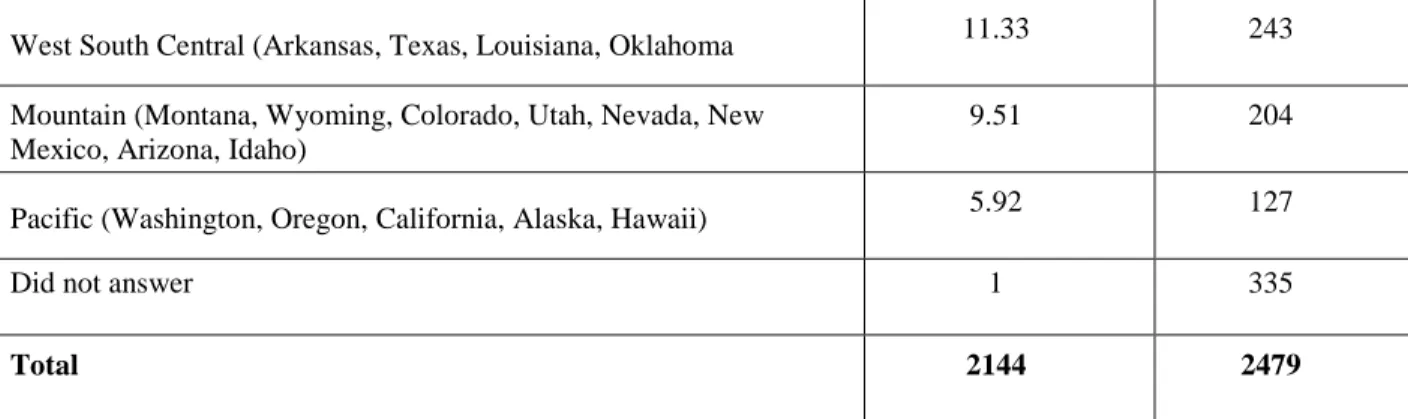
The respondents self-identified as 94.26% female, 85.46% Caucasian, and 40.85% being 55-64 years old. This sample is consistent with the literature which showed nursing faculty as being 95% female, 87.4% Caucasian and between the ages of 45-60 years old (NLN, 2009, Garbee & Killacky, 2008, Derby-Davis, 2014). Table1.2shows the geographical distribution of the participants.
Table 1.2
Region % of respondents # of respondents New England (Maine, New Hampshire, Vermont, Massachusetts,
Rhode Island & Connecticut)
6.30 135
Middle Atlantic (New York, New Jersey, Pennsylvania) 12.78 274
East North Central (Ohio, Indiana, Illinois, Michigan, Wisconsin) 23.09 495 West North Central, (Minnesota, North Dakota, South Dakota,
Iowa, Missouri, Nebraska, Kansas)
8.35 179
South Atlantic (Florida, Georgia, District of Columbia, North Carolina, South Carolina, Virginia, Maryland, Delaware, West Virginia
13.71 294
West South Central (Arkansas, Texas, Louisiana, Oklahoma 11.33 243 Mountain (Montana, Wyoming, Colorado, Utah, Nevada, New
Mexico, Arizona, Idaho)
9.51 204
Pacific (Washington, Oregon, California, Alaska, Hawaii) 5.92 127
Did not answer 1 335
Total 2144 2479
Table 1.3 displays other descriptive characteristics about the participants. Table 1.3
Characteristic % of respondents # of respondents
Teach exclusively in an ADN program 81.35 2145
Work full-time as a nurse educator 86.55 2142
Have tenure at organization of employment 39.38 2123
On a tenure track 39.11 2038
Hold a master's degree in nursing 94.45 2126
Hold a master's degree in a non-nursing field 8.29 2110
Hold a doctoral degree in nursing 10.34 2128
Hold a doctoral degree in a non-nursing field 3.92 2115
Have been nursing faculty for 10 years or more 44.47 2143
Have been nursing faculty for 5-10 years 29.91 2143
Have been nursing faculty for 0-5 years 25.62 2143
Is a Certified Nurse Educator (CNE) 14.7 2136
Organization will reimburse or increase salary for CNE certification
21.37 2078
Works a 9 month contract 57.66 2029
Works a 12 month contract 43.87 775
Would work 12 months/year if given that option 36.18 1993
Belongs to a bargaining unit 36.93 2131
The educational data about faculty varies slightly from the literature where 71% of the nursing faculty held a master’s degree and 20% held a doctoral degree (Roughton, 2013).
Outcome Evaluation Analysis
The top three components that faculty identified as providing the greatest to the least satisfaction factor are interactions, professional status, and autonomy. Each question in Part B was related to one of the motivation or hygiene components. The questions for each of the top three components have been grouped together, along with the raw frequency data. The questions related to the category ‘Interactions’ can be viewed in Table 1.4. The category of 'Professional Status' questions are in Table 1.5 and the category of 'Autonomy' questions are in Table 1.6.
Table 1.4
Interaction Questions # of Responses
Strongly Agree Agree Slightly Agree Neutral Slightly Disagree Disagree Strongly Disagree The nursing faculty at my organization
pitch in and help one another out when
things get in a rush. 588 816 353 94 116 82 42
Administrators in general cooperate with nursing faculty at my
organization. 297 870 340 181 168 138 100
It is hard for new faculty to feel "at home" at my organization
129 210 350 237 325 624 220
There is a good deal of teamwork and cooperation between various levels of
nursing faculty at my organization. 351 728 407 131 161 142 86 There is a lot of teamwork between
faculty members at my organization
392 722 410 137 159 122 66
The nursing faculty at my organization are not as friendly and outgoing as I
would like. 90 160 213 149 281 700 338
There is a lot of "rank consciousness" at my organization: faculty seldom mingle with those with less experience or different types of educational preparation.
57 85 120 156 196 741 571
I wish the administrators here would show more respect for the skill and
knowledge of the nursing faculty. 326 339 232 257 150 389 169
Administrators at this organization generally understand and appreciate
what the nursing faculty does. 234 599 348 138 210 202 128
The administrators at this organization look down too much on the nursing
faculty. 78 103 170 236 219 624 430
Table 1.5
Professional Status Questions # of Responses
Strongly Agree Agree Slightly Agree Neutral Slightly Disagree Disagree Strongly Disagree Nursing is not widely recognized as
being an important profession.
129 280 301 83 237 644 422
Most people appreciate the importance of nursing faculty to nursing students.
298 888 327 168 200 158 50
There is no doubt whatever in my mind that what I do on my job is really
What I do on my job does not add up to anything really significant.
17 21 42 61 145 689 940
It makes me proud to talk to other people about what I do on my job.
771 779 157 88 23 26 15
If I had the decision to make all over again, I would still go into nursing.
1112 434 69 105 40 60 39
My particular job really doesn't require much skill or "know-how".
12 3 9 12 27 394 1382
Table 1.6
Autonomy Questions # of Responses
Strongly Agree Agree Slightly Agree Neutral Slightly Disagree Disagree Strongly Disagree I feel that I am supervised more
closely than necessary
122 147 178 269 294 845 235
I feel I have sufficient input into the educational curriculum for my
students. 344 900 312 125 152 111 64
I have too much responsibility and not
enough authority 138 287 306 393 320 486 78
At my organization, my supervisors make all the decisions. I have little
control over my own work. 94 177 292 174 406 690 178
A great deal of independence is permitted, if not required, of me on my
job. 250 860 375 173 126 95 48
I am sometimes frustrated because all of my activities seem programmed for
me. 70 182 282 275 297 666 155
I am sometimes required to do things on my job that are against my better
I have the freedom in my work to make important decisions as I see fit, and can count on my supervisors to back me up.
163 589 434 184 179 168 123
An observation about Part B of the IWS is that the initial questions generated nearly 2100 respondents, whereas the last question had only 1835 respondents, with the rest of the
participants skipping the question. It should be noted that multiple questions in the top three components elicited a significant number of responses either 'Strongly Agreeing', 'Agreeing', 'Disagreeing' or 'Strongly Disagreeing', indicating the participants were strongly opinionated about the question. For example, the participants felt very strongly about a nurse faculty job being exceptionally important and would still go into nursing, if given a second chance. These responses can be found in Tables 1.4-1.6. In the bottom three components, the answers were generally spread out over all seven choices, indicating a more neutral stance on the components. The questions and the answers for these components can be viewed in Appendices G-I.
Gap analysis and Unanticipated consequences
This project was completed as planned, with no gaps in what was part of the
implementation plan and the actual project course. Additionally, no unanticipated consequences were experienced while conducting the online survey or during the analysis phase. All project outcomes were met.
Financial analysis. The most significant project expense was the project management hours, which were 100 hours annually of hourly pay and associated fringe benefits. These expenses were then offset by a donation of in-kind revenue, equal to the expense for project management. Other costs included the project manager's travel costs to Boise several times for project assistance/advising ($460.00 per trip) and from the SurveyMonkey™ subscription of $300.00. The primary focus of this project was online data collection, which utilized Survey
Monkey's survey function in addition to their support and analysis services. The cost of the analysis services was embedded into the annualsubscription cost. The total estimated one year cost for the project was $959.94 and can be viewed in the Statement of Operations in Appendix R. The 3-5 year estimated budget is located in Appendix S, in the event the project director continues the project into Phase II. The project expense report can be viewed in Appendix T.
Discussion and Recommendations
Maintaining and sustaining change. The survey and analysis portion of the DNP Scholarly Project is Phase I of a two stage project. The importance of identifying, evaluating and disseminating the factors influencing ADN faculty job satisfaction is to promote an examination by nursing education leaders of environmental and cultural issues of ADN nursing programs, and to make subsequent changes that positively addressthese factors. In Phase II, nursing program directors will be surveyed to identify their perceptions related to faculty attrition at their college or department. This will establish if the promotion of the job satisfaction factors identified in the 2016 study influenced any changes that aided the retention of nursing faculty, since a variety of other reasons could cause faculty to leave academia.
The associated costs of the remaining Phase II outcomes have been estimated to aid in procuring the required funding for Phase II. Potential funding sources include grants available through various nursing associations who may be interested in the information, such as the National League of Nursing or the American Nurses Foundation.
Informed Decisions and Recommendations
This purpose of this project was to identify and evaluate specific factors that contribute to job satisfaction for ADN faculty nationwide. The three factors that are the least satisfying to ADN faculty are salary, task requirements and organizational policies, of which two of these,
salary & organizational policies are extrinsic, or hygiene factors. Herzberg, Mausner & Snyderman (1993) theorized that the absence of these extrinsic factors will provide
dissatisfaction, and this is reflected in the survey results. These findings are similar to those in previous studies of baccalaureate and graduate faculty (Carlson, 2015; Derby-Davis, 2014; Yedidia, et.al, 2014).
The salaries of nursing faculty are typically only 76-79% of the salaries allocated for other academic disciplines in public institutions (McNeal, 2012, Kaufman, 2007). Faculty salaries may not be within the control of program directors; they may be subject to bargaining contracts or state economic resources, which have been generally reduced in recent years (Brady, 2007). To potentially offset a lower salary, program directors should consider that the intrinsic motivator of autonomy, one of the top three satisfiers for ADN faculty, was reflected in the raw data as being more important than all the other components, including pay. A recommendation for program directors would be to consider organizational changes such as policies promoting schedule flexibility and flexibility in job content (Carlson, 2015; Derby-Davis, 2014; Evans, 2013; Yedidia, 2014).
When considering task requirements, administrators may be able to adjust or reallocate tasks, since an increased faculty workload frequently decreases the chance of retention.
Generally, the increased faculty workload is due to the nurse faculty shortage. The program administrators expect the faculty to teach additional classes which perpetuates the problem of an increased workload when work such as grading papers cannot be completed during the scheduled workday (Garbee & Killacky, 2008; Bittner & O'Connor, 2012). Interactions, overall, was a top component of job satisfaction. However, when broken down into faculty-faculty interactions and faculty-administrator interactions, the latter component was the second highest area of job
dissatisfaction. This implies that program directors should focus on improving relationships between administration & faculty members, to increase faculty's organizational commitment, thus increasing faculty retention. Gutierrez, Candela & Carver (2012) concluded that when administrators have positive relationships with nurse faculty, organizational commitment is increased, in addition to job satisfaction, productivity and perceived organizational support.
Regarding intent to leave academe, the first question asked was, "If you are likely to leave your teaching job at your academic institution in 1 year, what is/are the reasons? There were 543 respondents, of which 30.57% said they would be retiring. 22.47% of the respondents reported the low salary being the cause for leaving. 7.73% of the respondents reported lack of autonomy in teaching, in addition to committee meetings, lack of institutional support and faculty shortages resulting in increased workloads; these are the reasons given for leaving in one year. Of the 441 respondents to the question of, "If you are likely to leave your teaching job at your academic institution in 3 years, what is/are the reasons?" 33.11 % listed retirement. This information aligns with the fact that 40.85% of the respondents are between 55-64 years old. Subsequent reasons for leaving are listed in Table 1.7.
Table 1.7
"If you are likely to leave your teaching job at your academic institution in 3 years, what is/are the reasons?
Answered: 441 Skipped: 2,038
Retirement 33.11% 146 answered
Pay 17.01% 75 answered
Teaching in a different way 5.44% 24 answered
Different opportunities 4.08% 18 answered
The recommendation for program directors is to be looking at innovative solutions and models for teaching pre-licensure students. It is suggested that one clinical instructor with a small group of students on a hospital floor is archaic and inefficient (Nardi & Gyurko, 2013). Different states have been piloting different models of teaching students, in order to overcome their own faculty shortages (Young, et al., 2016; Yucha, Smyer, & Strano-Perry, 2014; ). The second largest reason for faculty to leave academe in three years is pay, as reported by 17.01% if respondents, with the job requirements and time spent out of work hours reported by 5.90% of respondents.
Strategic plan congruence. The strategic goals of the National League for Nursing include, "Being the voice of nurse educators, " with the objective of, "leading efforts to create and sustain healthful work environments that value & support a diverse community of nurse educators," (NLN, 2016). This goal aligns with the scholarly project by identifying factors of job satisfaction for ADN faculty. By providing program leaders with information that may be utilized to promote job satisfaction among the nursing faculty, there is the potential to retain faculty at their organizations.
Implications to practice
The data and recommendations disseminated to program directors could have strong implications for the retention of nursing faculty. A significant number of respondents stated they will leave academe in the next three years for retirement, and prospective faculty are not entering
the field quickly enough to replace those that will leave. Program administrators should be exploring and acting upon creative ways to collaborate with facilities to offer flexible scheduling. It would benefit programs to entice experienced nurses into academe to widen the pool of
potential faculty; and to offer incentives to graduate nursing students to teach in prelicensure programs. Programs should be developing partnerships with healthcare delivery organizations to align and share resources in a more effective way to promote the clinical education needs of students (Yedidia, et. al., 2014).
Policy Implications
The nursing shortage in the United States is impacting all areas of nursing. Without nursing faculty and by association, a limited number of nursing students admitted into programs, the shortage will worsen (Cranford, 2013; National League of Nursing, 2014). On a national level, there have been mass campaigns to inform people about the nursing shortage, but not specificallyfocusing onhow the nurse faculty shortage impacts the admissions into nursing schools. The nursing faculty shortage needs to be publicized as an urgent problem that requires a solution; the political will to solve this must be created. The nursing faculty shortage is best described as an issue of advocacy, which Priest (2016) suggests is best addressed through the formation of coalitions.
Among organizations promoting the funding and preparation of nurse educators are the National League for Nursing (NLN), the American Association of Colleges of Nursing (AACN), the Robert Wood Johnson Foundation, and the Jonas Center for Nursing Excellence. The NLN may be very interested in the results of the project survey, which provides the components of
ADN faculty job satisfaction and gives program directors information and recommendations about the areas to focus on to retain current nurse faculty.
One possible political means of addressing the nurse faculty shortage is utilizing the states' professional nursing organizations to "friend raise" awareness of the issue with the professional organizations of state governors and their staffs. A strong relationship has been reported at the state level between effective coalitions of stakeholders willing to work on nursing workforce issues and "friend raising" (Green, Kishi, & Esperat, 2010). Professional
organizations are primary sources of information for the policymakers and by interacting with them, it may be possible to widen the policy stream (Bargagliotti, 2009). By utilizing the power of nursing professional organizations, quid-pro-quo opportunities could be developed towards moving ahead creative opportunities to address the nurse faculty shortage. Wisconsin created an innovative means to address the faculty shortage in their state. Wisconsin's policy incentivizes nursing education as a career choice, in exchange for the graduates committing to work as nursing faculty for a specified number of years(Young et al., 2016). Other states are looking at the nurse faculty shortage through workforce development organizations; Texas utilized the Health Resources Service Administration's (HRSA) Supply and Demand Model to develop their own model which generated workforce projections then utilized those to inform the policy makers and create legislation (Green, Kishi, & Esperat, 2010). Many state workforce
development centers specifically focused on nursing gather statistics, propose policy and provide resource information (Allan & Aldebron, 2008). As such, these centers may be very interested in the information disseminated from the project survey.
The planning of the scholarly project was the most difficult phase, because of the novelty of the process,as well aslearning to utilize the logic model-differentiating between objectives and outcomes and becoming detail oriented. This type of scholarly project differed from others in that there was no intervention or task created that would continue to be sustained after the project ended. This project was created after noting there was a paucity of information in the nursing literature related to job satisfaction in ADN faculty. Lessons learned during the implementation of the project include when conducting a pilot survey, choose a more
geographically diverse sample. At the phase of randomly choosing faculty emails for the pilot survey, there was not a large variety in states and colleges from which to choose, since faculty email addresses were still being gathered. Thecolleges utilized in thepilot survey were
primarily from the east and west coasts of the United States, and very few respondents from the mid-west.
The next lesson learned during the implementation was, when conducting a survey, to reduce its length. At 93 questions long, the overall response rate of 26.3% was surprisingly large. However, it was noted during the analysis that as the survey progressed, the number of respondents skipping questions increased, so that only 68% of the respondents completed the entire survey.
The most significant lesson learned during the evaluation portion of the project was to stick to the evaluation plan. If it's a sound one, things will progress smoothly.
Dissemination to Key Stakeholders and/or Community/Organization(s)
Project findings will be disseminated by potentially presenting key findings at the Doctor of Nursing Practice conference in 2017, at the 2017 Western International Nursing (WIN) conference, and at the Sigma Theta Tau Research conference in the fall of 2017. In
addition, there is potential to publish findings for the National League of Nursing or the Washington State Nurses Association publications, and various online peer-reviewed publications such as Nurse Educator and the Journal of Professional Nursing.
Conclusion
The information collected about job satisfaction and ADN faculty is congruent with similar findings of studies surveying baccalaureate and graduate nursing faculty (Derby-Davis, 2014; Evans, 2013; Roughton, 2013). The nursing faculty shortage is a symptom of the world-wide nursing shortage. The findings provide program directors with important information that can be utilized to create innovative solutions that help retain current nursing faculty. In order to ensure adequate nursing faculty is available to educate the next generation of nurses, the areas of least satisfaction for ADN faculty need to be addressed. Efforts to support greater faculty autonomy and to improve faculty interactions with administrators will create a positive
environment that encourages faculty to remain in academia. Conversely, addressing the factors that lead to job dissatisfaction can encourage faculty to remain in academe. At a time of
References
Allan, J. D., & Aldebron, J. (2008). A systematic assessment of strategies to address the nursing faculty shortage, U.S. Nursing Outlook, 56, 286-297.
Bargagliotti, L. A. (2009). State funding for higher education and RN replacement rates by state: a case for nursing by the numbers in state legislatures. Nursing Outlook, 57(5), 235-298. http://dx.doi.org/10.1016/j.outlook.2009.06.002.
Bittner, N. P., & O'Connor, M. (2012). Focus on retention: identifying barriers to nurse faculty satisfaction. Nursing Education Research, 33(4), 251-254.
Brady, M. S. (2007). Recruitment and retention of Associate Degree Nursing Faculty. Journal of Nursing Education, 46(4), 190-192.
Carlson, J. S. (2014, January-February). Factors influencing retention among part-time clinical nursing faculty. Nursing Education Perspectives, 31(1), 42-45. doi: 10.5480/13-1231.
Cash, P. A., Doyle, R., Von Tettenborn, L., Daines, D., & Faria, V. (2011, September-October). Working with nurse educators’ collective wisdom: Implications for recruitment and retention. Nursing Economic$, 29(5), 257-264.
Cranford, J. S. (2013). Bridging the gap: Clinical practice nursing and the effect of role strain on successful role transition and intent to stay in academia. International Journal of Nursing Education Scholarship, 10(1), 1-7. doi:10.1515/ijnes-2012-0018.
Derby-Davis, M. J. (2014, January/February). Predictors of nursing faculty’s job satisfaction and intent to stay in academe. Journal of Professional Nursing, 30(1), 19-25.
Evans, J. D. (2013). Factors influencing recruitment and retention of nurse educators reported by current nurse faculty. Journal of Professional Nursing, 29(1).
http://dx.doi.org/10.1016/j.profnurs.2012.04.012.
Garbee, D. D., & Killacky, J. (2008). Factors influencing intent to stay in academia for nursing faculty in the Southern United States of America. International Journal of Nursing Education Scholarship, 5(1), 1-15.
Gormley, D. K. (2003, April 5). Factors affecting job satisfaction in nurse faculty: A meta-analysis. Journal of Nursing Education, 42(4), 174-178.
Green, A., Kishi, A., & Esperat, M. R. (2010). State policy and research initiatives focused on improving nursing workforce: an integrative literature review. Annual Review of Nursing Research, 28, 63-112. http://dx.doi.org/10.1891/0739-6686.28.63.
Gui, L., Barriball, K. L., & While, A. E. (2009). Job satisfaction of nurse teachers: A literature review. Part I: Measurement, levels and components. Nurse Education Today, 29, 469-476. http://dx.doi.org/10.1016/j.nedt.2008.11.002.
Gutierrez, A. P., Candela, L. L., & Carver, L. (2012). The structural relationships between organizational commitment, global job satisfaction, developmental experiences, work values, organizational support, and person-organization fit among nursing faculty.
Journal of Advanced Nursing, 68(7), 1601-1614. doi: 10.1111/j.1365-2648.2012.05990.x Health Resources & Services Administration. (2016). www.hrsa.gov.
Herzberg, F., Mausner, B., & Snyderman, B. B. (1993). The motivation to work. New Brunswick, NJ: Transaction.
Kaufman, K. (2007). Compensation for nurse educators: Findings from the NLN/Carnegie national survey with implications for recruitment and retention. Nursing Education Perspectives, 28(4), 223-225.
Lane, K. A., Esser, J., Holte, B., & McCusker, M. (2010). A study of nurse faculty job
satisfaction in community colleges in Florida. Teaching & Learning in Nursing, 5, 16-26. http://dx.doi.org/10.1016/j.teln.2009.05.001
McCallister, A. (2012). R. Louise McManus & Mildred Montag create the associate degree model for the education of nurses: The right leaders, the right time, the right place: 1947-1959 (Doctoral dissertation, Columbia University).
McNeal, G. J. (2012). The nurse faculty shortage. The ABNF Journal, 23(2), 23.
Moreland, J. E. (2011). What prevents nurses from entering faculty positions early in their career: A qualitative study (Doctoral dissertation, Cappella University)
Nardi, D. A., & Gyurko, C. C. (2013). The global nursing faculty shortage: Status and solutions for change. Journal of Nursing Scholarship, 45(3), 317-326. doi: 10.1111/jnu.12030. National Advisory Council on Nurse Education & Practice. (2010).
www.hrsa.gov/advisorycommittees/bhpradvisory/nacnep/index/html. National League of Nursing. (2014). www.nln.org
National League of Nursing. (2016). www.nln.org
National League of Nursing. (2016, February). Achieving diversity and meaningful inclusion in nursing education: A living document from the National League for Nursing. (NLN Vision Series). Retrieved from: www.nond.org/resources/NLN-vision-statement-achieving-diversity.pdf.
Newcomer, K. E., & Triplett, T. (2015). Using surveys. In K. E. Newcomer, H. P. Hatry, & J. S. Wholey (Eds.), Handbook of practical program evaluation (4th ed., pp. 144-382). Hoboken, NJ: John Wiley & Sons.
Penwarden, R. [Rick P]. (2015, January 14). Don’t let your own opinions sneak into your survey: 4 ways to avoid researcher bias [Blog post]. Retrieved from
https://www.surveymonkey.com/blog/2015/01/14/dont-let-opinions-sneak-survey-4-ways-avoid-researcher-bias/
Pordes, J. L. (2015, August 26). What’s behind the U. S. teacher shortage? [Web log comment], Retrieved from
http://www.huffingtonpost.com/quora/whats-behind-the-us-teach_b_8044566.html
Priest, C. S. (2016). Advocacy in nursing and health care. In D. J. Mason, D. B. Gardner, F. H. Outlaw, & E. T. O’Grady (Eds.), Policy & politics in nursing and health care (7th ed. (pp. 30-37). St. Louis, MO: Elsevier.
Roughton, S. E. (2013, July-August). Nursing faculty characteristics and perceptions predicting intent to leave. Nursing Education Perspectives, 34(4), 217-225.
Stamps, P. L. (1997). Nurses and work satisfaction: An index for measurement (2nd ed.). Chicago, IL: Health Administration.
Stamps, P. L. (2012). Scoring Workbook for the Index of Work Satisfaction. Northampton, MA: Market Street Research.
W. K. Kellogg Foundation. (2006). wkkf.org
Weiss, S. A., & Tappen, R. M. (2015). Essentials of nursing leadership and management (6th ed.). Philadelphia, PA: Davis Company.
Yedidia, M. J., Chou, J., Brownlee, S., Flynn, L., & Tanner, C. A. (2014). Association of faculty perceptions of work-life with emotional exhaustion and intent to leave academic nursing: report on a national survey of nurse faculty. Journal of Nursing Education, 53(10), pp. 569-579. doi: 10.3928/01484834-20140922-03.
Young, L. K., Adams, J. L., Lundeen, S., May, K. A., Smith, R., & Wendt, L. E. (2016). Nurses for Wisconsin: A collaborative effort to enhance the nurse educator workforce. Journal of Professional Nursing, 32(4), 292-299.
http://dox.doi.org/10.1016/j.profnurs.2015.11.002
Yucha, C., Smyer, T., & Strano-Perry, S. (2014). Sustaining nursing programs in the face of budget cuts and faculty shortages. Journal of Professional Nursing, 30(1), 5-9. doi: 10.1016/j.profnurs.2013.07.002
Yucha, C. B., & Witt, R. (2009, May-June). Leveraging higher salaries for nursing faculty. Journal of Professional Nursing, 25(3), 151-155.
http://dx.doi.org/10.1016/j.profnurs.2009.01.007
Appendices
Appendix A - Theoretical Model
Appendix B - Permission to utilize the Index of Work Satisfaction Appendix C - Index of Work Satisfaction Questionnaire ©
Appendix D - Outcomes Logic Model Step III
Appendix E – Letter from National League for Nursing Appendix F - Timeline
Appendix G - Survey Questions Related to Pay
Appendix H - Survey Questions Related to Task Requirements Appendix I - Survey Questions Related to Organizational Policies Appendix J - Letter of Approval from BSU IRB
Appendix K - Frequency Matrix Appendix L - Proportion Matrix Appendix M - Matrix of Z-values
Appendix N - Measurement Indicators for Phase II Project Outcomes Appendix O - Reasons to Leave after 1 Year
Appendix P - Reasons to Leave after 3 Years Appendix Q - Reasons to Leave after 5 Years
Appendix R - Scholarly Project Statement of Operations Appendix S- Scholarly Project 3-5 Year Budget Plan Appendix T - Scholarly Project Expense Report
Appendix A
Herzberg's Motivation-Hygiene Theory
Motivational (Intrinsic) Factors Hygiene (Extrinsic) Factors Autonomy Responsibility Challenging Job Salary Benefits Relationships with Colleagues Job Satisfaction
Appendix B
Appendix C
The Index of Work Satisfaction Questionnaire
Part A (Paired Comparisons)
Listed and briefly defined below are six terms or factors that are involved in how people feel about their work situation. Each factor has something to do with “work satisfaction”. We are interested in determining which of these is most important to you in relation to the others.
Please carefully read the definitions for each factor as given below:
Pay -- dollar remuneration and fringe benefits received for work done
Autonomy -- amount of job related independence, initiative, and freedom, either permitted or required in daily work activities.
Task Requirements -- tasks or activities that must be done as a regular part of the job
Organizational Policies -- management policies and procedures put forward by the hospital and nursing administration of this hospital
Interaction -- opportunities presented for both formal and informal social and professional contact during working hours
Professional Status -- overall importance or significance felt about your job, both in your view and in the view of others
Instructions: These factors are presented in pairs on the next page. A total of 15 pairs are presented: this is every set of combinations. No pair is repeated or reversed. For each pair of terms, decide which one is more important for your job satisfaction or morale, and check the appropriate box. For example, if you feel that Pay (as defined above) is more important than Autonomy (as defined above), check the box for Pay.
It will be difficult for you to make choices in some cases. However, please do try to select the factor which is more important to you. Please make an effort to answer every item; do not go back to change any of your answers.
Part A (Paired Comparisons, Continued)
Please choose the one member of the pair which is most important to you. 1. Professional Status or Organizational Policies 2. Pay Requirements or Task Requirements 3. Organizational Policies or Interaction
4. Task Requirements or Organizational Policies 5. Professional Status or Task Requirements
6. Pay or Autonomy
7. Professional Status or Interaction 8. Professional Status or Autonomy
9. Interaction or Task Requirements
10. Interaction or Pay
11. Autonomy or Task Requirements 12. Organizational Policies or Autonomy
13. Pay or Professional Status
14. Interaction or Autonomy 15. Organizational Policies or Pay
Part B (Attitude Questionnaire)
The following items represent statements about how satisfied you are with your current nursing job. Please respond to each item. It may be very difficult to fit your responses into the seven categories; in that case, select the category that comes
closest to your response to the statement. It is very important that you give your
honest opinion. Please do not go back and change any of your answers.
Instructions: Please circle the number that most closely indicates how you feel about each statement. The left set of numbers indicates degrees of agreement. The
right set of numbers indicates degrees of disagreement. For example, if you strongly
agree with the first item, circle 1; if you agree with this item, circle 2; if you moderately agree with the first statement, circle 3. The middle response (4) is reserved for feeling neutral or undecided. Please use it as little as possible. If you moderately disagree with this first item, you should circle 5; to disagree, circle 6; and to strongly disagree, circle 7.
Part B (Attitude Questionnaire, Continued)
Remember: The more strongly you feel about the statement, the further from the center you should circle, with agreement to the left and disagreement to the right. Use 4 for neutral or undecided if needed, but please try to use this number as little as possible.
Agree
Disagree
1. My present salary is satisfactory.
1
2
3
4
5
6
7
2. Nursing is not widely recognized as being animportant profession.
1
2
3
4
5
6
7
3. The nursing faculty at my organization pitch in andhelp one another out when things get in a rush.
1
2
3
4
5
6
7
4. There is too much clerical and “paperwork” requiredof faculty at this organization.
1
2
3
4
5
6
7
5. The nursing faculty has sufficient control over theirschedule in my organization.
1
2
3
4
5
6
7
6. Administrators in general cooperate with nursingfaculty at my organization.
1
2
3
4
5
6
7
7. I feel that I am supervised more closely than isnecessary.
1
2
3
4
5
6
7
8. It is my impression that a lot of nursing faculty at
this organization are dissatisfied with their pay.
1
2
3
4
5
6
7
9. Most people appreciate the importance of nursingfaculty to nursing students.
1
2
3
4
5
6
7
10. It is hard for new faculty to feel ‘at home’ at myorganization.
1
2
3
4
5
6
7
11. There is no doubt whatever in my mind that what I
do on my job is really important.
1
2
3
4
5
6
7
12. There is a great gap between the administration ofthis organization and the daily problems of the nursing faculty.
1
2
3
4
5
6
7
13. I feel I have sufficient input into the educational
curriculum for my students.
1
2
3
4
5
6
7
14. Considering what is expected of nursing faculty atthis organization, the pay we get is reasonable.
1
2
3
4
5
6
7
15. I think I could do a better job if I did not have somuch to do all the time.
1
2
3
4
5
6
7
16. There is a good deal of teamwork and cooperationbetween various levels of nursing faculty at my organization.
Part B (Attitude Questionnaire, Continued)
Remember: The more strongly you feel about the statement, the further from the center you should circle, with agreement to the left and disagreement to the right. Use 4 for neutral or undecided if needed, but please try to use this number as little as possible.
Agree
Disagree
17. I have too much responsibility and not enough
authority.
1
2
3
4
5
6
7
18. There are not enough opportunities for
advancement of nursing faculty at this organization.
1
2
3
4
5
6
7
19. There is a lot of teamwork between facultymembers at my organization.
1
2
3
4
5
6
7
20. At my organization, my supervisors make all thedecisions. I have little direct control over my own work.
1
2
3
4
5
6
7
21. The present rate of increase in pay for nursing
faculty at this organization is not satisfactory.
1
2
3
4
5
6
7
22. I am satisfied with the types of activities that I do onmy job.
1
2
3
4
5
6
7
23. The nursing faculty at my organization are not as
friendly and outgoing as I would like.
1
2
3
4
5
6
7
24. I have plenty of time and opportunity to discussstudent problems with other nursing faculty.
1
2
3
4
5
6
7
25. There is ample opportunity for nursing faculty toparticipate in the administrative decision-making process.
1
2
3
4
5
6
7
26. A great deal of independence is permitted, if not
required, of me.
1
2
3
4
5
6
7
27. What I do on my job does not add up to anything
really significant.
1
2
3
4
5
6
7
28. There is a lot of “rank consciousness” at myorganization: faculty seldom mingle with those with less experience or different types of educational preparation.
1
2
3
4
5
6
7
29. I have sufficient time for direct student contact.
1
2
3
4
5
6
7
30. I am sometimes frustrated because all of my
activities seem programmed for me.
1
2
3
4
5
6
7
31. I am sometimes required to do things on my jobthat are against my better professional nursing faculty judgment.
Part B (Attitude Questionnaire, Continued)
Remember: The more strongly you feel about the statement, the further from the center you should circle, with agreement to the left and disagreement to the right. Use 4 for neutral or undecided if needed, but please try to use this number as little as possible.
Agree
Disagree
32. From what I hear about nursing faculty at other organizations, we at this organization are being fairly paid.
1
2
3
4
5
6
7
33. Administrative decisions at this organization interfere too much with preparations for student education.
1
2
3
4
5
6
7
34. It makes me proud to talk to other people about
what I do on my job.
1
2
3
4
5
6
7
35. I wish the administrators here would show morerespect for the skill and knowledge of the nursing faculty.
1
2
3
4
5
6
7
36. I could deliver much better lessons if I had more
planning time.
1
2
3
4
5
6
7
37. Administrators at this organization generally
understand and appreciate what the nursing faculty does.
1
2
3
4
5
6
7
38. If I had the decision to make all over again, I would
still go into nursing.
1
2
3
4
5
6
7
39. The administrators at this organization look downtoo much on the nursing faculty.
1
2
3
4
5
6
7
40. I have all the voice in planning policies andprocedures for this organization and my program that I want.
1
2
3
4
5
6
7
41. My particular job really doesn’t require much skill or
“know-how”.
1
2
3
4
5
6
7
42. The program administrators generally discuss with the faculty the problems and procedures the faculty face daily.
1
2
3
4
5
6
7
43. I have the freedom in my work to make important decisions as I see fit, and can count on my
supervisors to back me up.
1
2
3
4
5
6
7
44. An upgrading of pay schedules for nursing faculty is