All rights reserved INFORMATION TO ALL USERS
The quality of this reproduction is d e p e n d e n t upon the quality of the copy subm itted. In the unlikely e v e n t that the author did not send a c o m p le te manuscript and there are missing p a g e s , these will be n o ted . Also, if materia! had to be rem oved ,
a n o te will indicate the deletion.
Published by ProQuest LLC (2017). Copyright of the Dissertation is held by the Author. All rights reserved.
This work is protected against unauthorized copying under Title 17, United States C o d e Microform Edition © ProQuest LLC.
ProQuest LLC.
789 East Eisenhower Parkway P.O. Box 1346
THE DEMAND FOR ENERGY IN JORDAN
Ahmed Mezel Kit. AL-Azzam
Surrey Energy Economics Centre Department of Economics
University of Surrey Guildford
UK
A Thesis Submitted to the University o f Surrey fo r the Degree o f Doctor o f Philosophy in the Department o f Economics
I dedicate this Work to My Wife
A nd to My daughters Assala & Hanneen
A nd to My Sons: Muhammed, Abdul-Nasser, Muthanna, Al-Harrith, Abdullah, Azzam & Hammanu
ABSTRACT
This study represents the first econometric study that has attempted to model energy demand exclusively for Jordan. In so doing, recent developments in time series econometrics modeling techniques are adopted to estimate total energy demand functions at the aggregate and sectoral levels together with demand functions for individual fuels for Jordan using a new data set covering the period (1968-2000). Different econometric approaches were employed to estimate Hie elasticities including OLS, Johansen’s ML, DOLS and ARDL to enable a comparison o f the statistical results and the estimated price, income, urbanization elasticities. The different econometric techniques therefore act as a check o f the robustness o f the results obtained.
All estimates o f the demand functions whether at the aggregate level or at the disaggregate levels are robust not only in terms o f statistical competence but also in terms o f economic intuition. At the aggregate level, the various econometric techniques yield almost identical elasticity estimates. The estimates indicate a long run elasticity o f around unity with respect to per capita GDP, 0.35 with respect to per capita area constructed, -0.30 with respect to real energy prices, a coefficient around 0.1 for the dummy variable representing the level o f conflict in the region and a coefficient around 0.7% p.a. for the time trend as a proxy to the Underlying Energy Demand Trend (UEDT). The income elasticity implies that economic growth is likely to be accompanied by proportional increases in energy consumption. The price elasticity suggests that taxes on their own are unlikely to achieve government goals for energy conservation or environmental improvement, although they may well be efficient for revenue raising. Furthermore, evaluating the impact o f per capita area constructed on energy consumption levels helps provide guidance for the future need o f power generation and refining capacities.
The study present forecasts for aggregate energy, aggregate electricity and aggregate petroleum over the period 2001-2015 using 2000 forecasts from the Jordanian governments and international organizations for the exogenous variables. The forecasts are constructed using three different scinarios o f the GDP and area constructed growth, with constant real energy price at the 2000 level and with real energy prices increasing by '2% annually. The low growth scenario assumes 4% annual growth o f GDP and area constructed, the medium growth scenario assumes 6% for both annual growth o f GDP and area constructed, and the high growth scenario assumes 8% annual growth o f GDP and 6% annual growth o f area constructed. With constant real energy price, the low growth scenario suggests that total energy demand will increase by an average annual growth rate o f 3.9 % over the forecasted period. The medium growth scenario idicates that the total energy demand will increase by an average annual growth rate o f 6.37 % over the forecasted period, implying that aggregate energy demand will double by the year 2012. The high growth scenario suggests that the total energy demand will increase by an average annual growth rate of 8.24 % over the forecaste period and double by the year 2010.
L ist o f C on ten ts
1.1 Introduction
1.2 Objectives o f the Study 4
1.3 Plan o f the Study 6
1.4 Data Used in the Study 9
Chapter 2. Development of Energy in Jordan 10
2.1 Introduction 10
2.2 Background 11
2.3 Inventory o f Primary Jordanian Sources 12
2.3.1 Oil and Gas 13
2.3.2 Oil Shale 13
2.3.3 Renewable Energy Resources 14
2.4 Structure o f the Jordanian Economy 14
2.5 Imports o f Crude Oil and Refined Petroleum Products 17
2.6 The Cost of Petroleum Imports and the National Economy 19
2.6.1 Impact on Balance o f Payments 20
2.6.2 Impact on Government Budget 22
2.6.3 Environment 27
2.7 Energy Consumption 30
2.8 Energy Intensity 34
2.9 Summary and Conclusions 35
Chapter 3. Literature Review 38
3.1 Introduction 38
3.2 Model Stratification 40
3.2.1 Structural Approach 40
3.2.2 The End-Use Approach 41
3.2.3 The Econometric Approach 42
3.3 A summary of existing studies 44
3.3.1 Total Energy Demand 45
3.3.2 Individual Fuels 57 3.3.2.1 Petroleum Demand 57 3.3.2.2 Electricity Demand 66 3.3.2.3 Coal Demand 72 3.3.3 Sectoral Demand 73 3.3.3.1 Industrial Sector 74 3.3.3.2 Transportation Sector 76
3.3.3.3 Household and Commercial Sectors 83
3.4 Summary and Conclusion 87
4.1 Introduction 116
4.2 Analytical Framework 117
4.2.1 Consumer Behaviour 117
4.1.2 Producer Behaviour 122
4.3 Econometric Modelling o f Demand 124
4.3.1 Econometric Modelling o f Residential Energy Demand 125
4.3.1.1 The Almost Ideal Demand Systems 126
4.3.2 Econometric Modelling o f Industrial Energy Demand 127
4.4 Choice o f Functional Form 129
4.5 Accounting for Technical Progress in Energy Demand 133
4.6 Dynamic Specification 137
4.7 Summary and Conclusions 140
Chapter 5. Econometric Methods 141
5.1 Introduction 141
5.2 Addressing Non-Stationarity 141
5.3 Econometric Methodology 145
5.3.1 Testing For Unit Roots 145
5.3.1.1 The Dickey-Fuller and Augmented Dickey- Fuller Tests 146
5.3.2 The Meaning o f Cointegration 148
5.3.3 Testing and Estimating the Long Run Equilibria Cointegration 149 Vectors
5.3.3.1 Engle-Granger Static Method 149
5.3.3.2 Johansen’s Maximum Likelihood Procedure 150
5.3.3.3 Asymptotically Optimal Single-Equation Methods 154
5.3.4 Short Run Dynamics: Error Correction Mechanism 156
5.4 ARDL Modelling and Unit Root Regressors 157
5.5 Order Selection and Diagnostic tests 160
5.6 Summary and Conclusions 162
Chapter 4. Modelling Energy Demand 116
Chapter 6. Aggregate Energy Demand 164
6.1 Introduction 164
6.2 Integration (Testing for Unit Roots) 167
6.3 Testing and Estimating the LR Equilibria(Cointegration vectors) 169
6.4 Short Run Dynamics: Error Correction Mechanism 181
6.5 Summary and Conclusions 184
Chapter 7. Sectoral Energy Demand 186
7.1 Introduction 186
7.2 Integration(Testing for Unit Roots) 188
7.3 Testing and Estimating the LR Equilibria(Cointegration vectors) 192
7.3.2 Residential Sector 196
7.3.3 Transportation Sector 199
7.3.4 Commercial Sector 201
7.4 Short Run Dynamics: Error Correction Mechanism 207
7.5 Comparison of the Individual Estimates 209
7.6 Summary and Conclusions 213
Chapter 8. Demand for Electricity 216
8.1 Introduction 216
8.2 Integration(Testing for Unit Roots) 218
8.3 Testing and Estimating the LR Equilibria(Cointegration vectors) 223
8.3.1 Aggregate Electricity Demand 223
8.3.2 Industrial Electricity Demand 227
8.3.3 Residential Electricity Demand 230
8.3.4 Commercial Electricity Demand 232
8.3.5 Water pumping Electricity Demand 235
8.4 Short Rim Dynamics: Error Correction Mechanism 241
8.5 Comparison o f the Individual Estimates 244
8.6 Summary and Conclusions 247
Chapter 9. Refined Petroleum Products Demand 251
9.1 Introduction 251
9.2 Integration(Testing for Unit Roots) 253
9.3 Testing and Estimating the LR Equilibria(Cointegration vectors) 259
9.3.1 OLS 259
9.3.2 Johansen's ML 265
9.3.3 DQLS 271
9.3.4 ARDL 275
9.4 Short Run Dynamics: Error Correction Mechanism 279
9.5 Comparison o f the Individual Estimates 282
9.6 Summary and Conclusions 285
Chapter 10. Forecasting Energy Demand 291
10.1 Introduction 291
10.2 The Tracking Performance and Forecast Evaluation 292
10.3 Energy Forecasts to 2015 296
10.4 Summary and Conclusions 306
Chapter 11. Conclusions and Policy Implication 308
11.1 Introduction 308
11.2 Summary and Conclusions 308
11.3 The estimates 312
Appendix A. Data Used in the Study 322
A. 1 Consumer Price Index 322
A.2 Activity or Output 322
A.3 Population 323
A.4 Urbanization and Settlement 323
A.5 Energy Consumption 324
A.6 Energy Prices 324
Bibliography 334
Table 2.2: Quantity of Crude Oil and Petroleum Products Imports 19 Table 2.3: Cost of Energy Imports and its Ratio to Exports, Imports and GDP 22 Table 2.4: Domestic and Border Prices for Petroleum Products 23
Table 2.5: Government Subsidy for Petroleum Products 25
Table 2.6: Investment by Subsector for 1975-1980 and 1981-1985(JD Million) 26 Table 3.1: Selection of Total Energy Demand Econometric Studies for the Developed
Countries 92
Table 3.2: Selection of Econometric Studies of Sectoral energy Demand for the
Developed Countries 94
Table 3.3: Selection of Econometric Studies of Total Energy Demand for the Developing
Countries 97
Table 3.4: Selection of Econometric Studies of Total Oil & Oil Products Demand for the
Developing Countries 99
Table 3.5 Selection of Econometric Studies of Electricity Demand for the Developing
Countries 105
Table 3.6: Selection of Econometric Studies of Industrial Demand for the Developing 107 Countries
Table 3.7: Selection of Econometric Studies of Transportation Demand for the
Developing Countries 109
Table 3.8: Selection of Econometric Studies of Residential and Commercial Demand for
the Developing Countries 113
Table 3.9: Selection of Econometric Studies of Coal Demand for the Developing
Countries 115
Table 5.1: A Summary of the Properties of Stationary and Integrated Processes 145 Table 6.1: t-tests of Stationarity for the Aggregate Related Variables (1968-1997) 169 Table 6.2: OLS Estimates of The Aggregate Energy Demand (1970-1997) 172 Table 6.3: Johansen Tests of Cointegration for the Aggregate Demand (1970-1997) 174 Table 6.4: Johansen Estimates of the Cointegrating Vectors for the Aggregate Demand
(1970-1997) 174
Table 6.5: Stock-Watson Dynamic OLS estimates for the Aggregate Demand (1970-1997) 175 L ist o f T ab les
Table 6.6:Fully Modified Phillips-Hansen Estimates (truncation lag=3) for the Aggregate 177 Demand (1970-1997)
Table 6.7:Fully Modified Phillips-Hansen Estimates (truncation lag=3) for the Aggregate 177 Demand in the presence of deterministic trend (1970-1997)
Table 6.8: ARDL (1,0,0,0) selected based on Schwarz Bayesian for the Aggregate Demand
(1972-1997) 179
Table 6.9: Estimated Energy Demand based on the ARDL Approach with higher Lag 180 orders (1972-1997)
Table 6.10: A summary of the Estimated Long Rim Coefficients and Elasticities 181 Table 6.11: OLS Estimates of the Error Correction Model (1970-1997) 183
Table 7.1: t-tests for Stationarity (1968 - 1997) 192
Table 7. 2: OLS Estimation of Industrial and Residential Energy Demand (1970-1997) 204 Table 7.3: OLS Estimation of Transportation and Commercial Energy Demand (1970- 204
1997)
Table 7.4: Johansen’s ML Tests of Cointegration for Sectoral Demand (1970-1997) 205 Table7.5: Johansen’s ML Estimates of the Cointegrating Vectors for the Sectoral Demand 205 (1970-1997)
Table 7.6: Stock-Watson Dynamic OLS estimates for the Sectoral Demand (1970-1997)
206 Table 7.7: Autoregressive Distributed Lag Estimates of sectoral Energy Demand based on 207 ARDL (1,0,0,0) for the period (1970-1997)
Table 7.8: OLS Estimation of Error Coll ection Models of Sectoral Demand (1970-1997) 209 Table 7.9: A summary of the Estimated Long Run Coefficients and Elasticity 211
Table 8.1: t-tests for Stationarity (1968-1997) 223
Table 8.2: OLS Estimation of Aggregate and Sectoral Electricity Demand (1970-1997) 237 Table 8.3: Johansen Tests Of Cointegration for Aggregate and sectoral Electricity Demand 238 (1970-1997)
Table 8.4: Johansen Estimates of the Cointegrating Vectors For Aggregate and Sectoral 239 Electricity Demand (1970-1997)
Table 8.5: Stock-Watson Dynamic OLS estimates for Aggregate and Sectoral Electricity 240 Demand (1970-1997)
Table 8.6: Autoregressive Distributed Lag Estimates of Aggregate and Sectoral Electricity 241 Demand based on ARDL (1,0, 0, 0) over the period (1970-1997)
Table 9.1: T-tests for Stationarity (1968 - 2000) 258 Table 9.2a: OLS Estimation of Total petroleum, Liquid Petroleum Gas and Gasoline 264 Demands (1970-1997)
Table 9.2b: OLS Estimation of Kerosene, Diesel, Jet Fuel and Fuel Oil Demands (1970- 265 1997)
Table 9.3: Johansen’s ML Tests of Cointegration for Aggregate Petroleum and Products 269 Demand (19770-1997)
Table 9.4: Johansen’ ML Estimates of the Cointegrating Vectors for Aggregate Petroleum
and Products Demand (1970-1997) 270
Table 9.4a: Stock-Watson Dynamic OLS estimates for Aggregate Petroleum, LPG, 273 Gasoline and Kerosene Demand (1970-1997)
Table 9.4b: Stock-Watson Dynamic OLS estimates for Diesel, Jet Fuel and Fuel Oil 274 Demand (1970-1997)
Table 9.5: Autoregressive Distributed Lag Estimates of Aggregate Petroleum and the
Refined Products Demand (1970-1997) 279
Table 9.6a: OLS Estimates of Error Correction Models of Aggregate Petroleum, LPG, 281 Gasoline, and Kerosene (1970-1997)
Table 9.6b: OLS Estimates of Error Correction Models of Diesel, Jet Fuel and Fuel Oil 282 (1970-1997)
Table 9.7: A summary of the Estimated Long Run Coefficients and Elasticity 284 Table 10.1: Rates of Growth of Real GDP, Urbanisation and population assumed over the
period 2001-2015 298
Table 10.2: Forecasts of aggregate Energy Consumption in Jordan 2001-2015 With
Constant Real Energy Price at the 2000 Level 299
Table 10.3: Forecasts of aggregate Petroleum Consumption in Jordan 2001-2015 With 299 Constant Real Energy Price at the 2000 Level
Table 10.4: Forecasts of aggregate Electricity Consumption in Jordan 2001-2015 With 299 Constant Real Energy Price at the 2000 Level
Table 10.5: Forecasts of aggregate Energy Consumption in Jordan 2001-2015 With Real 303 Energy Price Increasing by 2% Yearly
Table 10.6: Forecasts of aggregate Petroleum Consumption in Jordan 2001-2015 With 303 Real Energy Price Increasing by 2% Yearly
Table 10.7: Forecasts of aggregate Electricity Consumption in Jordan 2001-2015 With 304 Real Energy Price increasing by 2% Yearly
Table 8.8: A summary of the Estimated Long Run Coefficients and Elasticity
245
Table A.2: Economic Variables 329
Table A.3: Sectoral Energy Consumption 330
Table A.4: Refined Petroleum Products Consumption 331
Table A.5: Refined Petroleum Products Prices 332
Table A.6: Sectoral Electricity Consumption 333
Table A.7: Sectoral Electricity Prices 334
List of Figures
Figure 2.1: Jordan 12
Figure 2.2a: The Relative Importance o f Economic Sectors to GDP 16
Figure 2.2b: Per Capita GDP (YFN) 16
Figure 2.3: Imported Crude Oil and Petroleum Products 18
Figure 2.4: Quantity of Oil Imports 18
Figure 2.5: Cost of Energy Imports, Total Exports & Total Imports 20 Figure 2.6a: Nominal Prices of Gasoline, kerosene, Diesel and Jet Fuel 23 Figure 2.6b: Real Prices of Gasoline, kerosene, Diesel and Jet Fuel(l 985 prices) 24
Figure 2.7: C02 Emission 29
Figure 2.8: Carbonization Index 29
Figure 2.9: Refined Petroleum Products Consumption 31
Figure 2.10: Jordan Energy Consumption 31
Figure 2.11: Energy Intensities 3 5
Figure 6.1: Per capita Total Energy Consumption (QTN) 167
Figure 6.2 Real Energy Price (PI) 167
Figure 6.3: Per capita GDP (YFN) 168
Figure 6.4: Per Capita Area Constructed (AN) 168
Figure 7.1: Per Capita Industrial Energy Consumption (QIN) 189
Table A.l: Distribution of Electricity Consumption in the Residential Sector 328
Figure 7.4: Per Capita Commercial Energy Consumption (QCN) 190
Figure 7.5: Real Average Industrial Price (Pin) 190
Figure 7.6: Real Average Transportation Price (Ptr) 191
Figure 7.7: Real Average Residential Price (Pre) 191
Figure 7.8: Scatter of Price Elasticities 212
Figure 7.9: Scatter of Income Elasticities 212
Figure 7.10: Scatter of Area-Constructed Elasticities 212
Figure 8.1: Per Capita Aggregate Electricity Consumption (QEN) 219 Figure 8.2: Per Capita Residential Electricity Consumption (QEIN) 219 Figure 8.3: Per Capita Industrial Electricity Consumption (QERN) 220 Figure 8.4: Per Capita Commercial Electricity Consumption (QECN) 220 Figure 8.5: Per Capita Water Pumping Electricity Consumption (QEON) 220 Figure 8.6: Real Average Aggregate Electricity Price (PE) 221
Figure 8.7: Real Average Industrial Electricity Price (PI) 221
Figure 8.8: Real Average Residential Electricity Price (PR) 221
Figure 8.9: Real Average Commercial Electricity Price (PC) 222
Figure 8.10: Real Average Water Pumping Electricity Price (PA) 222
Figure 8.11: Scatter of Price Elasticities 246
Figure 8.12: Scatter of Income Elasticities 246
Figure 8.13: Scatter of Area-Constructed Elasticities 246
Figure 9.1: Per Capita Aggregate Petroleum Consumption (QPN) 253 Figure 9.2: Per Capita Liquid Petroleum Gas Consumption (GN) 254
Figure 9.3: Per Capita Gasoline Consumption (BN) 254
Figure 9.4: Per Capita Kerosene Consumption (KN) 254
Figure 9.5: Per Capita Diesel Consumption (SN) 255
Figure 7.3: Per Capita Transportation Energy Consumption (QTRN) 190
Figure 9.8: Real Aggregate Petroleum Price (Pp) 256
Figure 9.9: Real Liquid Petroleum Gas Price (Pg) 256
Figure 9.10: Real Gasoline Price (Pb) 256
Figure 9.11: Real Kerosene Price (Pk) 257
Figure 9.12: Real Diesel Price (Ps) 257
Figure 9.13: Real Fuel Oil Price (Pfo) 257
Figure 9.14: Real Jet Fuel Price (Pj) 258
Figure 9.15: Scatter of Price Elasticities 284
Figure 9.16: Scatter of Income Elasticities 285
Figure 9.17: Scatter of Area-Constructed Elasticities 285
Figure 10.1: Predicted and Actual Per Capita Aggregate Energy Consumption. 294 Figure 10.2: Predicted and Actual Per Capita Aggregate Petroleum Consumption. 294 Figure 10.3: Predicted and Actual Per Capita Aggregate Electricity Consumption. 295 Figure 10.4: Cumulative Sum of Recursive Residuals (Aggregate Energy) 295 Figure 10.5: Cumulative Sum of Recursive Residuals (Aggregate Electricity) 295 Figure 10.6: Cumulative Sum of Recursive Residuals (Aggregate Petroleum) 296 Figure 10.7: Forecasts of Aggregate Energy Consumption (2000-2015) in Jordan 3 00 (Constant Real Energy Price)
Figure 10.8: Forecasts of Aggregate Petroleum Consumption (2001-2015) in Jordan 300 (Constant Real Energy Price)
Figure 10.9: Forecasts of Aggregate Electricity Consumption (2001-2015) in Jordan 300 (Constant Real Energy Price)
Figure 10.10: Forecasts of Aggregate Energy Consumption (2001-2015) in Jordan 304 (Constant and Increasing Real Energy Price)
Figure 10.11: Forecasts of Aggregate Petroleum Consumption (2001-2015) in Jordan 304 (Constant and Increasing Real Energy Price)
Figure 10.12: Forecasts of Aggregate Electricity Consumption (2001-2015) in Jordan 305 (Constant and Increasing Real Energy Price)
Figure 10.13: A comparison of Aggregate Electricity Consumption (2001-2010) 306 Forecasts with the Government Forecasts.
A ck n o w led g m en t
I would like to express my deepest gratitude to my supervisor, David Hawdon for his support, encouragement and direction throughout the entire duration o f the preparation o f this diesis. His wisdom, patience, guidance and critical analysis were invaluable. My special gratitude should be expressed to Richard Pierse for his contiual care and attention. I am also grateful to Professor Lester Hunt and John Nankervis and all other members of staff at the department of economics especially Maureen Newman for their help.
I would also like to thank His Excellency Mr.Tymoor Al-Daghistani, the Jordanian ambassador in London who showed me that people with his outstanding personality and character still exist.
I would also like to thank the staff at the Jordanian Ministry o f Energy and Mineral Resources, especially my dear friend Rashad Aburas, and Azmi Khrisat for their help in providing me with the available data.
My special gratitude should be expressed to the brothers Dr. Ammar & Dr. Hassan Al-Rashdan, Haffeedh Al-shanfari, Jaffer Al-Omari, Chris Spencer and Dr. Alex Mandilaras for sharing and reducing the burden o f four years o f intensive and sometimes, frustrating research. I am also in debt to Muhammed Al Allawneh and his wonderful family for their help.
Last and not least, a heartfelt thanks to Miss Evangelia Chaidemenou for the imconditional help, support, understanding and the belief in my ability to finish this work.
As always, I am solely responsible for any errors remaining in this thesis.
C H A P T E R 1. IN T R O D U C T IO N
1.1 Introduction
Jordan, as a small developing country, has been characterised by a high import/GDP ratio; accompanied with a weak productive sector and a relatively stagnant export sector. The development process in Jordan has been constrained by high foreign debt servicing costs and low foreign exchange resources due to fluctuations in the inflow o f Arab aid and workers remittances following the 1990-1991 Gulf crises. These constraints forced Jordan to undergo a momentous transformation process, based on a major restructuring of the country’s economy1. This includes reduction in governmental expenditures, new regulations for monetary stability and tax reform and a wide range o f privatisation programs, which includes energy and electricity sectors.
The pervasive and vital importance o f research on energy demand in Jordan stems from the importance o f energy for the processes o f production and manufacturing and it is as such a key element o f sustainable development. Thus, research on energy demand in Jordan hardly needs emphasising. Since local resources are either limited or undeveloped2. Jordan depends entirely on imported crude oil and refined petroleum products to meet its domestic energy demand, which has grown remarkably during the period o f this study.
1 Royal Jordanian Information Memorandum (2000).
2 Limited finds of natural gas and oil have made at Al-Risha in the eastern desert near the borders of Iraq, indicating the availability of some hydrocarbon resources.
Jordan’s development status shows that the growth of future energy demand will depend on a host o f factors such as the growth in various economic sectors, developments in socio-economic activities, population growth and expected international oil prices. Moreover, improvement in standard of living contributes to a continued increase in energy consumption. The continuous growth in energy consumption has imposed serious burdens on the national economy. This growth has given rise to the increase in energy cost expressed in terms o f the burden 011 the balance of payments and the increase in financial burden on the government budget. For example, the cost o f imported oil during the period of the study constituted about 6-18 % o f the GDP, 32-130 % of exported goods and 12-19 % o f imports3. Furthermore, the increasing cost o f energy directly influences all domestic macroeconomic variables such as gross domestic product (GDP), price level (inflation), and unemployment, since energy is a vital element in all economic sectors such as industry, transportation, construction, agriculture and domestic sector. This increase in energy cost also raises the question o f what alternatives Jordan should choose in directing its development process and energy structure, within the limits o f a policy aimed at rationalising utilisation of its resources.
The investment needed in the energy supply sector to meet anticipated growth in energy consumption is extremely high. This will be especially so in the provision o f adequate power generation and refining capacity which already account for a large proportion o f total public sector investment. It should be noted that investments in the energy sector accounts for about 25 % of total public capital expenditures. The capital
required for expansion o f the energy sector came from international and regional development institutions and through bilateral concessional lending or aid. For the future, the capital flow from these sources will be restricted to investments in education, health and other social projects4.
The growing concern over the environment and the global nature o f the environmental problems has focused attention on the pattern and the trend of energy demand. The environmental and health consequences of energy consumption growth are likely to be severe because o f the increasing emissions o f greenhouse gases such as carbon oxides from the energy sector. It is evident that further analysis of energy use and energy policies o f Jordan is very important.
In spite o f the importance o f the above issues and the country’s dependence on imported energy and the vulnerability to the international oil price increases, I have not found any econometric energy demand studies for Jordan in the literature. Aburas and Fromme (1991) provide a descriptive analysis of the household energy demand in Jordan based on the 1987 household energy survey. Aburas (1993) provides an inventory of Jordan’s currently proven reserves. Recently Aburas (1999) explains the recent reforms in the power sector in Jordan including the government planes o f liberalising the electricity sector. While these studies have contributed in improving our understanding o f the energy sector, they do not provide a rigorous basis for explaining past behaviour or predicting future energy requirements. This study by
contrast presents the first comprehensive econometric analysis o f energy demand in Jordan using a consistent and comparable data set.
In this study, I employ the most recent advances in econometric techniques for the analysis of dynamic models to investigate the pattern and structure o f energy demand in Jordan. My econometric analysis is based on a consistent time series data disaggregated by activity and type o f fuel, which uses the theoretically appropriate measures o f income, price and urbanisation. It is hoped that this study provides fresh data and evidence on the major determinants of energy consumption in Jordan.
The configuration of this chapter is as follows: The next Section discusses the objectives o f the study. Section Three presents the plan o f the study. Section Four deals with the sources of data used in the study.
1.2 O bjectives o f the Study
Econometric modelling o f energy demand is widely undertaken to provide information on income and price elasticities. Such information is, however, flawed if proper account is not taken o f the time series properties of the variables used in the investigation, and the size and nature of the samples from which the data is obtained. Early demand studies for industrialised countries such as (Pindyck, 1980) or (Bohi, 1981) appeared before these issues were raised, while more recent work has addressed the problem of cointegration among variables using primarily error correction methods. Few studies have been directed towards investigating the structure and characteristics o f demand for energy in the developing countries; see for example
(Munasinghe, 1990), (Dahl, 1994), (Eltony, 1995, 1996a, 1996b), (Masih and Masih, 1996a, 1996b) and (Balabanoff, 1994).
Obtaining reliable estimates o f energy demand models is made difficult by the limitations o f existing techniques. Non-stationarity o f the economic variables involved in the analysis o f energy demand leads to violation o f the classical assumptions of standard regression methods, and to spurious estimates. The possible endogeneity o f regressors is another problem not well handled by OLS. Finally, the sample sizes available for data analysis are usually small leading to small sample bias in estimates. This is particularly relevant to the developing countries where statistical data is o f recent origin.
The objectives o f this thesis are as follows:
• The analysis o f the long run characteristics o f demand for energy by developing and estimating demand functions at aggregate and sectoral levels and demand functions for individual fuels.
• The provision o f forecasts o f demand for energy in Jordan until the year* 2015 using 2000 forecasts from government and international organisations for population, economic growth and energy prices.
The government forecasts energy consumption using simple intuitive or ad hoc methods by assuming continuation o f historical patterns o f the energy consumption growth. While these methods are simple and easy to use, they are
not always as accurate as the formal method based on estimating the demand functions I am adopting in this thesis. The functions at aggregate and sectoral levels together with demand functions for individual fuels can better reveal the structure and characteristics o f demand for energy in Jordan and help to provide a framework for the analysis o f energy policy in Jordan. By identifying the main determinants o f the pattern and structure o f energy demand a deeper understanding of the issues surrounding the energy policy in Jordan can be achieved so that we are led to the provision o f improved forecasts. A fuller and more detailed understanding o f the trends o f energy demand is clearly o f crucial importance in obtaining more reliable forecasts.
1.3 Plan o f the Study
To achieve the objectives o f this study discussed above, this thesis is made in eleven chapters. Chapter Two provides a comprehensive analysis o f the developments of energy in Jordan. In particular, the imports o f oil and petroleum products and the impact o f its cost on the Jordanian economy are investigated. The energy consumption developments and the energy intensity are also discussed.
Chapter Three summarises studies pertaining to aggregate energy, electricity and refined petroleum products according to consuming sector (residential, transportation, industrial and commercial) and according to modeling technique and type o f data for the developing countries. Furthermore, special attention is paid to the oil importing developing countries; Jordan is one of the countries belonging to this specific group.
Chapter Four is concerned with the analytical framework o f deriving energy demand. The economic theory of consumer and producer are briefly overviewed. Duality aspects for consumers and producers and the special problems involved in applying the theory to energy demand are particularly emphasised. Chapter Four also discuses the choice o f econometric modelling for the sectoral energy demand. Furthermore this chapter also deals with both the dynamic specification and the choice o f functional form.
Chapter Five provides a discussion o f the latest advances in dynamic time series modelling such as stationarity, integration, and cointegration. Furthermore, this chapter describes the procedures o f estimation and tests for non-stationary time series analysis, which will be used in my empirical analysis.
My empirical results are presented in Chapters Six, Seven, Eight, and Nine. Chapter Six illustrates the application o f the methodology described in Chapter Four and Chapter Five to the aggregate energy demand for energy in Jordan. Chapter Six
i presents alternative elasticity estimates for aggregate energy.
Chapter Seven investigates energy demand at the disaggregated levels. As a first stage in disaggregation, the final consumption of energy is considered by the main sectors o f the economy namely; the industrial, residential, transportation and the commercial sector, which includes agriculture and public energy’s use.
Chapter Eight investigates energy demand at fuel type disaggregation level. Here I discuss the final consumption o f energy in Jordan disaggregated into electricity and petroleum products. This chapter examines the aggregate electricity demand in Jordan. Furthermore, the aggregate electricity demand is disaggregated into industrial, residential, commercial and the water-pumping sector. The water-pumping sector includes street lighting, hospitals, charities, and broadcasting and TV consumption o f electricity and was not further disaggregated. The chapter follows the same structure as with aggregate and sectoral data. Initially, the properties of the time series included in the model are discussed and then I proceed to analyse the results for each sector employing different econometric techniques to ensure that estimates do not vary across different estimation methods.
Chapter Nine deals with the aggregate demand for refined petroleum products as well as the individual petroleum products: Liquid Petroleum Gas, Gasoline, Kerosene, Diesel (Gas Oil), Jet Fuel (Avatage and Avatar) and Fuel Oil.
Chapter Ten evaluates the models by out-of-sample forecasts for 1996-2000, which was not used in estimation, and provides forecasts o f energy demand for the period 2001-2015 using 2000 forecasts from government and international organisations for population, economic growth and energy prices.
The final Chapter draws conclusions about the empirical results and evaluates the estimates and discusses the policy implications and future research.
Long time series o f consistent and comparable data on energy consumption at the aggregate and sectoral levels are crucial for estimating reliable econometric energy models, and for developing energy policies and forecasting future demands.
The data in this study relate to the period 1968 to 2000 to estimate elasticities with respect to the main determinants o f the energy demand in Jordan such as income, urbanisation and resettlement and domestic energy prices using advanced econometric techniques. These data are obtained from various official sources including the Ministry o f Energy and Mineral Resources (MEMR), the Central Bank o f Jordan, the General Department o f Statistics (GDS), the Jordan Electricity Authority (JEA), the National Electric Power Company (NEPCO), Jordan Petroleum Refinery Corporation (JPRC), Jordan Electric Power Company (JEPCO), and Irbid District Electric Company (IDECO)5.
1.4 D a ta U sed in th e Stud y
C H A P T E R 2. D E V E L O P M E N T O F E N E R G Y IN JO R D A N
2.1 Introduction
Jordan depends entirely on imported crude oil and refined petroleum products to meet its domestic energy demand because local sources of energy are very modest. However, since the second half o f the 1970s, Jordan witnessed a remarkable growth in energy demand. This growth has given rise to an increase in energy cost whether expressed in terms of burden on balance o f payments or o f increase in financial burden on the budget as a result of subsidising domestic energy prices. The growth in various economic sectors, developments in socio-economic activities, population growth and improvements in standard of living in Jordan, will contribute to a continued increase in energy demand.
In this chapter I provide a descriptive analysis o f the developments in the domestic energy resources as well as the developments in energy consumption over the period o f the study. This chapter also discuses the cost o f energy imports and its cost’s impact on the national economy with respect to the balance o f payments, the government budget and the environment.
The plan o f this chapter is as follows. The next section provides a backgroimd of Jordan. Section Three briefly discuses the developments in the domestic energy resources, which include oil, gas, oil shale, and renewable energy resources. Section Four discusses the structure o f the Jordanian economy. Section Five deals with the developments o f the imports o f oil and petroleum products. Section Six deals with
cost o f energy imports and its cost’s impact on the national economy with respect to the balance o f payments, the government budget and the environment. Section Seven analyses the development in the energy consumption and its sectoral distribution. Section Eight discusses the energy intensity for the period o f study. Finally, a summary and conclusion is made in Section Nine.
2.2 Background
The area of Jordan is 96.2 thousands square kilometres most o f which is arid land and the rest is wide plains on the Eastern Hills, As more than 90% o f the Jordanian population lives in the Northwestern areas. Jordan forms a geographical unit with the Sham Region (Large Syria) in the aspects o f topography, population, weather, history and national aspiration. Thus Jordan is located in Southwest Asia between latitudes 29-33 degrees north to Equator and between longitudes 34-39 degrees east. Jordan occupies a middle location among the Arab Asian states. Syria borders Jordan from the north, Iraq and Saudi Arabia from the east, Gulf o f Aqaba and Saudi Arabia from the south and Palestine from the west (see Figure 2.1).
The population o f Jordan in the year 2000 exceeded 5 million, which means that Jordan’s population almost quadrupled over the period of the last three decades. This marked increase was caused partly by the high birth rate, which has an average of 4.08% annually since 1968 and partly by the migration of people from West Bank o f Jordan, and recently from Kuwait. According to the place of residence and way o f life, the population o f Jordan is divided into two social sectors, the people o f urban areas
with 74% o f the population and the people o f rural areas with 26% o f total population1. It is worth noting that this ratio was the reverse in 1968.
Figure 2.1: Jordan
The weather in Jordan is semi-arid, and moderate in temperature, Mediterranean with four equal seasons of the year. This warm and moderate area is characterised by warm and dry weather in summer but moderate and rainy in winter. Thus Jordan does not have severe weather conditions where it requires a great deal of energy for heating or cooling.
2.3 Inventory o f Prim ary Jordanian Sources
Jordan’s presently known exploitable energy resources consist of limited quantities of crude oil, natural gas, solar energy for water heating and a very minor proportion of hydroelectric potential. Over the longer term with higher oil prices and improvement
in technology its large oil shale deposits could prove to be a significant factor in meeting local energy demand. Additionally the country’s wind energy potential is being investigated and is expected to make some contribution to electricity generation as wind technology improves. In what follows, these resources will be briefly highlighted.
2.3.1 Oil and Gas
In 1984 Jordan announced its first modest oil discovery, the Harnzeh field in the Northeastern part of the country. Since the field is still being evaluated, no estimate o f the reserves is available. In 1987, natural gas was also discovered in the same region (Al Risha). The Jordanian Electricity Authority (JEA) installed gas turbine generators at the site to utilise the gas for power generation.
2.3.2 Oil Shale
Oil shale reseives are scattered all over the country, especially in the middle and the northern part o f Jordan2. These reserves o f oil shale have been estimated at about 40 billions tonnes, which contain about 4 billion tonnes of crude oil. Their quality as a raw material for the production of oil or as fuel for generation of electricity is relatively good. Mining is inexpensive and the near surface strata of the shale facilitate open-pit mining. However, the problem with oil shale in Jordan as in every other part o f the world is economic and environmental. What complicates the economic viability o f such projects further is the volatility of international oil prices.
Great emphasis is placed on the direct application o f solar energy in domestic water heating. It is estimated that 24% o f household’s own solar water heaters, thereby saving about $6millions annually o f the cost o f imported primary energy3.
In the field of wind energy, Jordan Electricity Authority has established two wind- farms, the first in 1988 rated at 320kW; the second in 1994 rated at 1.35MW and they both are connected to the national grid. With limited water resources, currently only King Tall dam hydro station is used for electricity generation at a total capacity o f 22GWh, and consequently this figure represents the total capacity o f the available hydro energy sources in Jordan.
2.4 Structure o f the Jordanian Econom y
The productive structure of GDP and its sectoral distribution plays an important role in determining the energy consumption and its intensity in the economy. In other words, the consumption o f energy is related to the economic structure o f a country. There is a positive relationship between demand for energy and the share o f industrial sector in total output and an inverse relationship with respect to the share o f agriculture sector and services sector in the total output (Munasinghe, 1993).
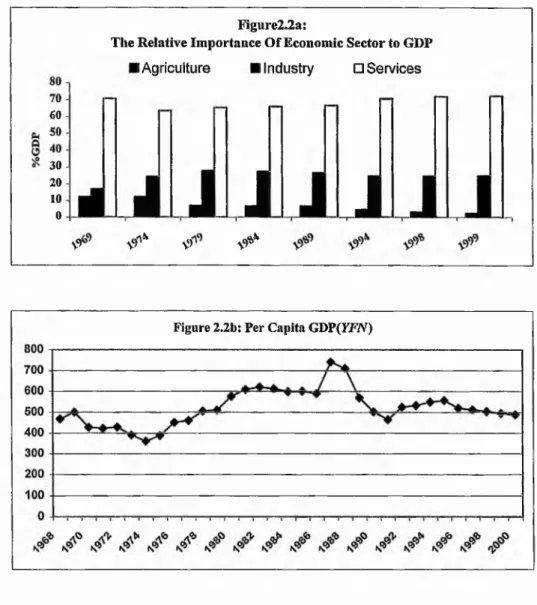
Table 2.1 summarises the relative importance o f the agriculture, industry, and services sectors to the gross domestic product in Jordan. It is apparent that industrial production has clearly made a substantial contribution to total economic growth in 2.3.3 R enew able Energy R esources
Jordan over much o f the last three decades. In the 1970s, growth in industrial output outpaced that o f GDP and it is clear that the sector’s share has increased from 17.0% in 1969 to 27.7% in 1979 (see Figure 2.1). The major factors underlying this performance has been the economic boom in the oil exporting Arab countries which has provided markets for Jordanian exports and the rapid growth in resource based industries such as phosphate, cement and potash. This growth has brought with it similar' growth in energy consumption. With the drop in oil prices in the second half o f the 1980s and the 1990 Gulf War, the industrial growth has fallen well below that o f GDP and the growth o f the service sector. As a consequence, industry’s share o f GDP fell to 24.7% in 1994. It is also clear from Table 2.1 and Figure 2.2a that the agriculture sector share has fallen from 12.3% in 1969 to 2.5% in 1999. «
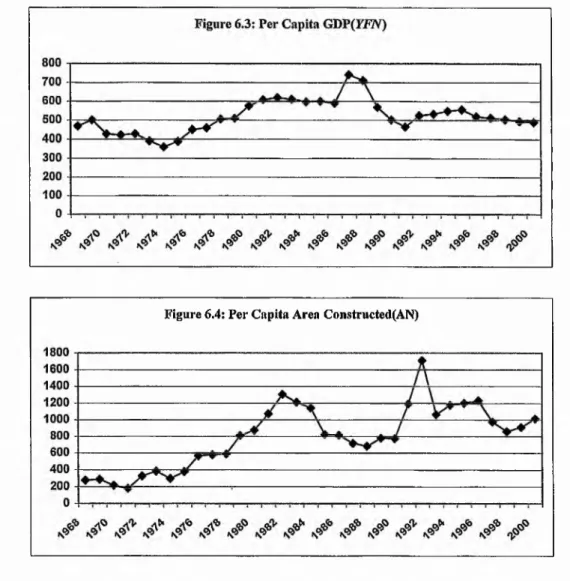
Figure 2.2b shows real per capita GDP for Jordan over the period o f study. It is evident that this was falling from the beginning o f the period o f study until the mid 1970’s because the region in this period witnessed the Arab- Israeli war and the first oil crises. The increase o f oil prices was accompanied by the economic boom in the neighbouring oil exporting Arab counfries which has provided markets for Jordanian exports, financial aids and so on. Notice that the real per capita income started increasing from 1975 until 1986. The 50% devaluation of the Jordanian Dinar in 1987 and 1988 resulted in a sharp increase in the net exports. This resulted in a sharp increase in GDP. Afterwards per capita GDP declined as a consequence o f the Gulf War and the wave o f inward migration to Jordan from the Gulf countries (particularly
from Kuwait). After the 1992 per capita income stalled to increase modestly until 1996 where it declined again.
Table 2.1:
Tbe Relative Importance of Economic Sectors to GDP (% of GDP).
Sector/Y ear 1969 1974 1979 1984 1989 1994 1998 1999
Agriculture 12.3 12.2 7.0 6.6 6.6 4.6 3.2 2.5
Industry 17.0 24.4 27.7 27.4 26.7 24.7 24.8 25.1
Services 70.7 63.4 65.4 66.0 66.7 70.7 72.0 72.4
Sources: Central Bank of Jordan, Department of Research and Studies, Yearly Statistical Series (1964-1993), October 1994.Central Bank of Jordan, Department of Research and Studies, Monthly Statistical Bulletin, different Issues. Central Bank of Jordan, Department of Research and Studies, Annual Report, Different Issues
60 30 -I 20 10 0 Figure2.2a:
The Relative Importance Of Economic Sector to GDP
I Agriculture I Industry □ Services
J
J
J
j
J
- ,-& a' V> V>fib
Jordan depends almost entirely on imported crude oil and refined petroleum products to meet its domestic energy needs, since local resources are either limited (oil and gas) or undeveloped (oil shale). In 1997 the energy production from local resources amounted to 1800 tons crude oil and 10.7 billion cubic feet of natural gas. The overall local production is 225 thousands tons o f oil equivalent and it contributes 5% o f the domestic needs4.
Jordan imported crude oil from Saudi Arabia through a single large pipeline (the Tap line) that was originally designed for much larger exports to the Mediterranean through south Lebanon. In addition, refined petroleum products were also imported from Kuwait and Iraq by road. After the 1990 Gulf War, Jordan started importing all o f its domestic needs o f energy from Iraq5.
Imports o f crude oil and refined petroleum products during 1997 reached 4373 thousand tons o f which 3444 thousand tons were crude oil and 929 thousand tons were petroleum products where the imports of crude oil in 1968 was 367 thousands tons.6 The total petroleum imports increased by 12 fold. Petroleum products were imported for the first time in 1980.This is apparent from Table 2.2 and Figures 2.3 and 2.4 which summarise quantity o f crude oil and petroleum products imports over the period 1968-1997.
4 Ministry of Energy and Mineral Resources (1998) The Annual Report.
5 Jordan imports oil from Iraq with permission from the United Nation. These imports are through official government-to-govemment sales agreements.
6 MEMR (1986, 1997) the annual reports.
5000 4500 4000 ^ 3500 J § 3000 •g 2500 i 2000 o 1000 500 Figuer 2. 3:
Imported Crude Oil & Petroleum products ^Pet.products
□ Crude oil
n n n n fi
n I
i R i l H l
Figure 2.4:
Quantity of Total Oil Imports
The period o f study will be divided into four stages through out this chapter where each stage has its own characteristics. The average annual growth o f oil imports for the period 1968-1975 was 13.03%, which is characterised by the transfer from traditional energy into the commercial energy. The average annual growth o f oil imports for the period 1976-1982 was 17.61%, in which this period witnessed a veiy high growth rate in all economic sectors.
Due to the slow down of the economic growth, the second Gulf war and the discoveiy o f natural gas during the period (1983-1991), the average annual growth o f energy imports declined to 2.61% and refined petroleum products constituted an increasing percentage o f imported petroleum. The period (1992-1997) had witnessed an improvement in the performance of the national economy. So the average annual growth o f oil imports increased to 6.2%.
Table 2.2:
Quantity of Crude Oil and Petroleum Products Imports
Period % Average growth p.a
Crude oil
%Average growth p.a Petroleum Products % Average growth p.a Total 1968-1975 13.03 0 13.03 1976-1982 17.61 0 17.61 1983-1991 -1.48 35.6 2.61 1992-1997 7.00 4.31 6.2 1968-1997 8.61 11.90 9.48
Source: Ministry of energy and Mineral Resources, Annual Reports Different Issues.
2.6 The C ost o f Petroleum Im ports and the N ational E conom y
The last two oil price shocks o f 1973-74 and 1979-80 have left a lasting impact on the entire world .The oil shocks marked the end of the rapid growth performance o f both industrialised and developing countries and were followed by higher inflation and unemployment rates7. Apart from the oil exporting countries all other country economies have suffered from the rapid increase of oil prices, the most adverse consequences were felt by a group o f oil importing developing countries in which Jordan belongs to this group.
The cost o f imported oil and refined petroleum products constitutes a major significant burden to the national economy. With the increase in both the price o f oil and the quantity imported, the cost o f energy consumed increased 114 fold from JD 3.217 million in 1968 to JD367 million in 1997s. Figure 2.5 illustrate energy imports compared with the total exports and total imports.
Figure 2.5:
Cost of Energy Imports, Total Exports & Total Imports
^ ^ ^ ^ ^
2.6.1 Impact on the Balance o f Payments
The great increase in the price o f oil in the 1970s had a significant impact on the balance o f payments o f Jordan. Table 2.3 summarises the cost o f total energy imports and its ratio to the total exports, total imports and the gross domestic product. It is apparent that total energy imports as a percent o f total exports increased drastically after 1975. The average ratio for the period 1968-1975 was 36% and this ratio rose drastically to reach 130% for the year 1983. This implies that the cost o f imports
7 See Munasinghe, M (1990).
exceeded the earnings from total exports. With the drop in oil prices in the second half of the 1980s and the increase of exports, the ratio dropped to 50%. Total energy imports as a percent of total imports increased after 1975 reaching 20.3% in 1982.
Table 2.3:
Cost of Energy Imports and its Ratio to Exports, Imports and GDP*.
y e a r Imported Total Imports Total Exports G D P Cost o f E n e rg y Im p o rts R e la ted to:
^ Total Exports Total Imports GDP
(%) (%) (%) 1968 3.22 57.49 12.17 156.1 26.43 5.60 2.06 1969 3.81 67.75 11.92 183.4 32.01 5.63 2.08 1970 3.75 65.88 9.32 174.4 40.21 5.69 2.15 1971 4.45 36.27 8.82 186.2 50.41 12.26 2.39 1972 4.59 95.31 12.61 207.2 36.37 4.81 2.21 1973 4.16 108.20 14.10 218.3 29.47 3.84 1.90 1974 5.20 156.51 39.44 247.3 13.19 3.32 2.10 1975 24.87 334.01 40.75 312.1 61.03 7.45 7.97 1976 37.14 339.54 49.55 421.6 74.95 10.94 8.81 1977 43.04 454.42 60.25 514.2 71.44 9.47 8.37 1978 46.78 458.83 64.13 632.2 72.95 10.20 7.40 1979 73.99 589.52 82.56 753 89.63 12.55 9.83 1980 122.15 715.98 120.11 984.3 101.70 17.06 12.41 1981 176.13 1043.50 169.03 1164.2 104.20 16.88 15.13 1982 231.93 1142.48 185.58 1321.2 124.97 20.30 17.55 1983 207.40 1103.31 160.09 1422.7 129.56 18.80 14.58 1984 205.13 1071.34 261.06 1498.4 78.58 19.15 13.69 1985 193.66 1074.95 255.35 1605.9 75.84 18.02 12.06 1986 111.08 850.20 225.62 1639.9 49.23 13.06 6.77 1987 149.37 915.55 248.77 2136.2 60.04 16.31 6.99 1988 151.00 1022.47 324.79 2264.4 46.49 14.77 6.67 1989 245.00 1230.01 534.11 2372.1 45.87 19.92 10.33 1990 305.75 1725.83 612.25 2668.3 49.94 17.72 11.46 1991 313.00 1710.64 598.63 2855.1 52.29 18.30 10.96 1992 332.00 2214.00 633.76 3493 52.39 15.00 9.50 1993 317.00 2453.63 691.28 3811.4 45.86 12.92 8.32 1994 300.00 2362.58 793.92 4250 37.79 12.70 7.14 1995 330.00 2590.25 1004.53 4560 32.85 12.74 7.09 1996 345.00 3043.56 1039.80 4710 33.18 11.34 6.70 1997 367.00 2908.09 1067.16 5606 34.39 12.62 6.55 1998 300.00 2727.3 1034.5 5180 29.00 11.0 5.8 1999 376.00 2686 1253.33 5290 30.00 14.0 7.0 2000 568.00 3209 1346 5450 42.2 17.7 9.6
Sources: Central Bank of Jordan, Annual Report Different Issues. Ministry of Energy and Mineral Resources, Annual Report Different Issues.* in millions JD.
However, the average annual growth rates were 27.2%, 19.2% and 20.6% for energy imports, total imports and total exports respectively. Notice that the average growth of energy imports exceeded the average growth of total imports and total exports. This indicates the importance of the energy commodity compared to all commodities the Jordanian economy traded throughout the period of this study.
2.6.2 Impact on Government Budget
It has been widely claimed in the literature that all sources of energy in the developing countries are priced below their opportunity cost (Al-Faris, 1999) and this practise is self-evident in Jordan where most petroleum products are priced below the border prices. This is apparent from Table 2.4, which shows domestic and border prices for petroleum products in 1992 for Jordan. It is apparent that the price of jet fuel, kerosene and fuel oil is well below their corresponding border prices.
Table 2. 4:
Domestic and Border Prices for Petroleum Products (January 1992)($US/ton) P r o d u c t B o r d e r P r ic e D o m e s tic P r ic e T a x o r s u b s id y % D o m e s t ic /B o r d e r L P G 390 394 4 101 G asoline 360 683 323 190 Je t fu e l* 338 201 (1 3 7 ) 59 Je t F u e l 338 449 111 133 K erosene 320 221 (9 9 ) 69
Gas O il/D ies el 318 213 (10 5) 67
F u e l O il 169 150 (19 ) 89
Source: M in istry o f Energy and M in e ral Resources, Unpublished Report. * The price fo r the national airline.
The government’s interference in the domestic energy market has been heterogeneous and varied over time. Fixing energy prices below international market prices has been common practice. Moreover, discrimination among different social or economic groups and different sources of energy has been widely prevalent practice. The
common case is to levy heavy taxation on relatively less-elastic products such as gasoline, and to subsidise what are called ‘social products4 such as kerosene, diesel and fuel oil. However, one distinct feature of energy pricing policy in Jordan has been nominal rigidity. This is evident from Figure 2.6a that shows the nominal prices of the petroleum products in Jordan over the period 1968-1997. Apart from gasoline, nominal energy prices have been kept stable for a considerable time. Figure 2.6b shows the corresponding real energy prices. It is clear that the real energy prices have declined over time. This decline is attributed to the rigidity of nominal energy price and as a consequence of the growth of general price index (inflation).
Figure 2.6a:
Nominal Prices of Gasoline,kerosene.Diesel and Jet Fuel
300.00 n
Jet fuel Price —■ — G asoline Price
Keros€ 100.00 w u 200.00 250.00 50.00 U.UU -j j ,--- ,— -i---- ,---1---- 1—
Figure 2.6b:
Real Prices of Gasoline, Kerosene, Diesel and Jet Fuel (1985 prices)
In general, energy prices are kept under government control for economic, political, and social reasons. For economic reasons, the government views pricing policy as an instrument of stabilisation to control inflation and in this context government policy has been more concerned with the extent of price fluctuations than with average price levels since international prices of refined products have experienced rather wide valuations. The government has intervened to insulate domestic consumers from instability on the world market, and has used energy pricing policy extensively in their development efforts since energy is viewed as the engine of development. Therefore the government subsidised jet fuel in order to enable the national airline to compete with other airlines. The government also subsidised fuel oil, which is mainly used in the industrial sector and electricity generation so that the Jordanian industrial sector can compete with the industrial sector in the neighbouring Arab countries such as Iraq and Saudi Arabia, which have the advantage of facing very low energy prices. As is clear from Table 2.5, the government subsidy for petroleum products was substantial as a percentage of energy imports.
Table2.5:
Government Subsidy for Petroleum Products
y e a r N e t subsidy(JD M illio n ) % E n e rg y Im p o rts 1975 17 68.4 1976 17 45.8 1977 18 41.8 1978 22 47.0 1979 37 50.0 1980 31 25.4 1981 20 11.4
Source: Ministry of Energy and Mineral Resources, Unpublished Report.
. For political reasons, an increase in energy prices (electricity and petroleum products) could have severe consequences for the Jordanian government. In a country like Jordan, where a big percentage of population lives in poverty, political instability and social unrest could increase. Moreover, Jordan imports oil and petroleum products from Iraq at a considerably low price, and thus the public perception is that these products should be available to them at cut price. The government is unwilling to eliminate subsidies or impose taxes on the so called social products having in mind the 1996 riots after even reducing the bread subsidies. One has also to take into consideration the unique social structure of Jordan; tribes whose loyalties lie with neighbouring Arabic countries that have very low energy prices dominate the rural areas. The strong ties between them and the neighbouring countries (e.g. Saudi Arabia and Iraq) make the prospect of price increases - price increases that would probably lead to social instability and upheaval- completely infeasible.
For social reasons, the common practice by the government is to impose taxes on gasoline and to a lesser extent on liquid gas, which are used by middle and upper classes and subsidise kerosene, diesel and fuel oil. The government under prices