A Performance Benchmark for NetFlow Data
Analysis on Distributed Stream Processing Systems
Milan ˇ
Cerm´ak, Daniel Tovarˇn´ak, Martin Laˇstoviˇcka, Pavel ˇ
Celeda
Institute of Computer Science, Masaryk UniversityBotanick´a 68a, 602 00 Brno, Czech Republic
E-mail:{cermak, lastovicka, celeda}@ics.muni.cz, [email protected]
Abstract—Modern distributed stream processing systems can potentially be applied to real time network flow processing. However, differences in performance make some systems more suitable than others for being applied to this domain. We propose a novel performance benchmark, which is based on common security analysis algorithms of NetFlow data to determine the suitability of distributed stream processing systems. Three of the most used distributed stream processing systems are bench-marked and the results are compared with NetFlow data process-ing challenges and requirements. The benchmark results show that each system reached a sufficient data processing speed using a basic deployment scenario with little to no configuration tuning. Our benchmark, unlike any other, enables the performance of small structured messages to be processed on any stream processing system.
I. INTRODUCTION
Network security monitoring and data analysis has become, with the increasing volume of traffic, a challenge for current data processing systems. Especially in high-speed networks, full packet capture puts high demands on storage and computa-tion capabilities. Thus, flow aggregacomputa-tion and export compatible with IPFIX IETF standards (based on NetFlow v9) has become widely used for traffic monitoring and analysis. It enables flow analysis by storing and processing only essential descriptive data about the flows, while all necessary information is pre-served [1]. However, this approach allows analysis only in batches (typically in 5 minute intervals [2]), which causes security anomaly detection to be delayed. The solution to this problem may be contemporary distributed stream processing systems, which are able to process large amounts of data in real-time. The aim of this paper is to set a performance benchmark of these systems and determine if they are suitable for real-time flow data analysis.
Several distributed stream processing systems have emerged differing in architecture, method of data processing, provided analysis methods, and programming languages. As a result, each of these systems is suited to a different type of data and purpose. However, none of these systems are directly designed for flow data processing, which means processing a large volume of small structured messages. To determine which system is suitable for this purpose, we propose a novel benchmark for measuring the performance of these systems.
To be able to appropriately specify the benchmark, we shall identify challenges and requirements for flow data processing.
A novel benchmark of a distributed stream processing sys-tem, respecting common flow security analysis algorithms, is proposed on this basis. The benchmark is used to compare Spark [3], Samza [4], and Storm [5], currently the most used distributed stream processing systems. Finally, their suitability for a flow data processing is determined by the obtained results and acquired experience.
In summary, our key contributions are as follows.
1) The specification of challenges and requirements for distributed stream processing systems for effective flow analysis.
2) The proposal of a distributed stream processing system performance benchmark based on flow data processing, reflecting challenges identified and requirements. 3) The comparison of distributed stream processing
sys-tems and determination of their suitability for flow analysis.
This paper is divided into seven sections. Section II de-scribes the state of the art of data processing. Section III presents the basic characteristics of the three most used distributed stream processing systems. Section IV proposes a novel performance benchmark. Section V contains bench-mark results. Section VI discusses the results. Section VII concludes the paper.
II. THESTATE OF THEART
The question of which data processing system is suitable for an IP flow processing appears already in the work by Hofstede et al. [6]. They compared the flow processing speed of NFDUMP and MySQL databases. With the advent of the MapReduce computation concept [7], novel distributed data processing systems were introduced, with Hadoop [8] at the forefront. This enabled the development of new network data analysis tools [9]–[11] utilizing big data architectures.
Systems based on the Hadoop technology work only with batches of data and do not permit real-time analysis. To over-come this limitation, distributed stream processing systems, such as S4 [12], Spark, Samza, Storm, and Flink [13] were introduced. These systems offer a completely new approach to processing large volumes of data in real-time. In order to determine which of these systems are suitable for flow data processing, a new comparison of these systems is needed.
Since the distributed stream processing concept is quite new, there is currently only one universal benchmark proposed by
Lu et al. [14], named StreamBench. This benchmark deter-mines system performance, fault tolerance and durability using an analysis of text and statistics data. However, StreamBench is a universal benchmark which does not respect the problem of flow data processing. Only two systems were benchmarked by StreamBench and the source code has not been made public yet. We base our work on this benchmark and propose a novel benchmark devoted exclusively to measure the performance of flow data processing.
III. DISTRIBUTEDSTREAMPROCESSINGSYSTEMS
Distributed stream processing is different from traditional batch processing. Data is not persistently stored on a disk or in memory, but they exist only as a stream of messages. In order to process them, the system must be able to capture them, process them, and produce the results of such a computation. To illustrate the workflow of stream processing, we have presented a top level abstraction consisting of three parts: data source stream, processing system and results stream, as shown in Figure 1.
Fig. 1. Stream processing abstraction.
The data source is any system producing data as a stream, typically through a network socket, but it can also be files in Hadoop Distributed File System or a specialized system, such as Apache Kafka [15]. Apache Kafka is a distributed mes-saging system providing a high level of parallelism through stream partitioning. It allows us to divide a stream of data into smaller streams called partitions, which can be consumed independently by any number of machines.
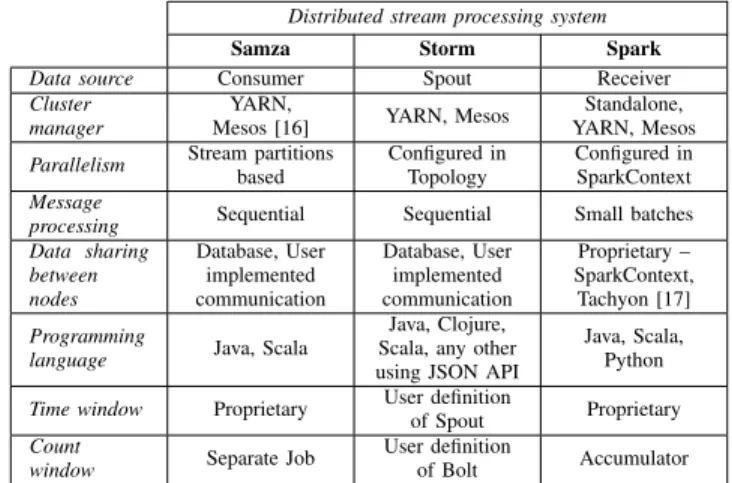
The processing system is the main part of the abstraction. It reads data from the source stream and analyses the content of every incoming message. The system allows advanced analysis and computations on different types of data from simple text to specific binary formats. There are many stream processing systems differing in architecture and data processing methods. The details and differences between the distributed stream processing systems discussed in this paper are described in Table I and sections further below.
The final part of stream processing is an output stream which can be stored into a file, database, or it can be an input of another data processing system.
A. Apache Samza
The Samza application runs in Hadoop YARN [18] con-tainers on a cluster and is divided into tasks according to input stream partitions [4]. One Samza task processes one or more partitions using exactly one processor core. Hence, the level of parallelism must be known before the input stream is partitioned. During the data processing, a message from the input stream partition is sent directly to an assigned task. This
TABLE I
CHARACTERISTICS OF DISTRIBUTED STREAM PROCESSING SYSTEMS. Distributed stream processing system
Samza Storm Spark
Data source Consumer Spout Receiver
Cluster manager
YARN,
Mesos [16] YARN, Mesos
Standalone, YARN, Mesos
Parallelism Stream partitions
based Configured in Topology Configured in SparkContext Message
processing Sequential Sequential Small batches Data sharing between nodes Database, User implemented communication Database, User implemented communication Proprietary – SparkContext, Tachyon [17] Programming
language Java, Scala
Java, Clojure, Scala, any other using JSON API
Java, Scala, Python
Time window Proprietary User definition
of Spout Proprietary
Count
window Separate Job
User definition
of Bolt Accumulator
puts high demands on the stream partitioning, because tasks are isolated and have no shared memory.
To process data using a shared state, e.g. computing overall statistics for a specific element in a message, all messages with the element must be in the same partition or the state must be synchronized through a common database. The synchroniza-tion, however, results in a serious throughput bottleneck.
Samza has built-in support for time windows, allowing an action to be executed after a specified amount of time. In the event of a need for the execution after a specified number of messages (count window), a sub-application must be implemented.
B. Apache Storm
The Storm cluster consists of sub-applications running on different machines [5]. Each sub-application can use all re-sources and is not limited by the number of partitions. An input stream is processed by a component called Spout, which reads data from an external source and emits them in the form of tuples. Computation takes place in the Bolt component.
In Storm terminology, the description of a whole cluster set-up is called Topology. It assigns sub-applications on physical machines and tells them which Spouts and Bolts will run each specific sub-application. Each Storm component can run on more processor cores inside its sub-application and the number of cores used is defined in the Topology. Storm has no requirements for a number of partitions or stream partitioning algorithm, because the assignment of tuples to Bolt is Spouts’s responsibility.
The data processing paradigm is the same as in Samza. Bolts can use shared memory only inside one sub-application. A database with concurrent access must be implemented, to allow a shared state across multiple machines. The time window has to be programmed as a special Spout, periodically sending tuples with timestamps and count windows as a Bolt aggregating all input messages.
C. Apache Spark
The Spark cluster is very similar to Storm. Messages arrive to a Spark Streaming component, which transforms them into batches, and aggregates them for a given period of time [19]. This approach is not pure stream processing, but these batches are very small, typically created at one second intervals, and computations can be called near real-time. A sequence of batches in Spark terminology is a DStream (Discrete Stream) and is passed to the Spark core.
Processing is done in a Cluster worker, where the pplica-tion can run on as many processor cores as available. The coordination of all tasks in one application is provided by Spark context, which manages workers’ tasks and allows them to share data across multiple workers, making shared state management easy.
The time window is fully supported by Spark with the only limitation that it has to be a multiple of a batching interval of Spark Streaming. The count window can be implemented by a user with an Accumulator in shared memory.
IV. PERFORMANCEBENCHMARKDEFINITION
We propose a novel benchmark following the universal StreamBench benchmark [14], to compare the processing per-formance of distributed stream processing systems. Contrary to StreamBench, our benchmark is focused on flow data processing. This allows us to compare the performance of a tested system using real network data and operations.
A. Challenges and Requirements
IP flow data processing puts high demands on a system’s performance, especially in high-speed networks, such as cam-puses or backbone networks. We observed an average of 5 000 flow/second generation rate in the Masaryk University campus network and 100 000 flow/second in the CESNET network (National Research and Education Network). Accord-ing to these observations, we estimate that the distributed stream processing system must be able to process at least 300 000 flow/second to handle normal traffic as well as peaks, which emerge during attacks and other anomalies.
To designate the system as suitable for flow data analysis, it must also meet the functional requirements in addition to the flow throughput. Distributed stream processing system must provide adequate data manipulation operations for the use of statistical and analytical methods. Support for count or time windows represents another requirement on the system, which is necessary for data computation over a specific period of time. One example of such requirements is collecting ongoing flow statistics or detection methods based on a threshold. Another requirement is support got external timestamps, which allow flows to be processed in the exact time order. This is not absolutely necessary, but it makes the implementation of anomaly detection methods more precise.
B. Selected Operations
Contrary to StreamBench, which focuses on both universal text processing and simple statistics counting, our benchmark
operations are primarily inspired by common security analysis methods of flow data [20]. Based on the exploration of these methods, we identified four basic operations that are included in the majority of them:Filtering,Count,Aggregation
and TOP N. We transformed these operations to standalone
programs to compare the performance of the tested systems over the basic processing of flow data.
These four operations are preceded by anIdentityoperation, used to determine the system’s performance baseline. We have also added a SYN DoS operation representing an example of a real network attack detection method combining the aforementioned operations. This was done to show the system performance after it executes multiple operations.
The benchmark consists of the following operations:
1) Identity: Input data processing without executing any
operation on them.
2) Filter: Only flows fitting a filtering rule are selected
from the input dataset and sent to the output.
3) Count:Flows containing a given value are filtered and
their count is returned as a result.
4) Aggregation: Contrary to the count operation, the
ag-gregation sums specific values over all flows.
5) TOP N:An extension of the aggregation returning only
a given number of flows with the highest sums of values.
6) SYN DoS: The detection of an attack represented by a
high number of flows from one source IP address with TCP SYN packets only.
C. Dataset
We have prepared a dataset based on real traffic to bring our performance benchmark of distributed stream processing system closer to real-world data computations. The basis of the dataset is formed by a network traffic sample from the CAIDA dataset [21]. Because the dataset contains full packet capture traces, we transformed the sample from PCAP format to a flow represented in JSON format, which is commonly used in distributed processing systems. The average size of the one message of the dataset basis is 270 Bytes. An example of one message is as follows: {"date_first_seen":"2015-07-18T18:07:33.475+01:00", "date_last_seen":"2015-07-18T18:07:33.475+01:00", "duration":0.000,"src_ip_addr":"86.135.210.175", "dst_ip_addr":"31.157.1.1","src_port":54700, "dst_port":80,"protocol":6,"flags":".A....", "tos":0,"packets":1,"bytes":56}
We take the first one million flows of one destination IP ad-dress (50.224.90.224) as the dataset basis and repetitively insert them into the final dataset, changing the address in each repetition. This allows us to obtain the same result on each computation node and eases data processing parallelization. The final number of repetitions (partitions) corresponds to the number of processor cores used by the tested stream processing system, or their multiples. It enables the fast distribution of data to the tested system and a full exploitation of them, while maintaining the realistic appearance of the dataset.
D. Benchmark Architecture
The benchmark corresponds to a typical architecture of the distributed stream processing system described in Section III. The input stream of data is provided by the Apache Kafka [15] messaging system, fed by a dataset using multiple writing threads such that its processing speed exceeds the speed of the tested system. The dataset is obtained from Kafka through multiple partitions corresponding to the number of cores available in the testing environment, or their multiples. This makes the tested system optimally utilized without waiting for data at any system node. Another Kafka instance is connected to the output of the tested system, but a different instance is used, so it does not affect the speed of Kafka at the input.
The performance benchmark consists of two different en-vironments for deploying the distributed stream processing system which is tested. The first one is a single host with multiple processor cores, allowing us to determine system performance without transmitting data over the network. The second environment consists of multiple hosts with the same total number of processor cores as the first one. It is used to determine the performance of the tested system operating over the network. Both environments are connected to the input and output Kafka in the same way to provide equal conditions.
E. Measurement Method
The measurement aims to compare the performance of different distributed stream processing systems. Therefore, the benchmark is focused only on a flow throughput, not on fault tolerance or durability. These system properties may be tested by other general benchmarks, e.g. StreamBench. Nevertheless, the results in [14] show that none of the tested systems had problems with durability or fault tolerance.
Measuring flow throughput poses a challenge in the case of distributed stream processing since it is difficult to reliably determine the end of data processing. Some distributed stream processing systems provide internal throughput statistics, but they are not provided by all of them. To overcome these problems, the benchmark uses an input and output Kafka system, providing internal statistics of message arrival times.
Kafka, however, does not solve the “end of data processing problem”. It was necessary to adjust the distributed stream processing system so that the end of data processing is determined internally using a previously known computation result. The end of each dataset basis was updated with the flows affecting the calculation, which enabled us to reliably determine the computation result at the end of processing. Each of the tested systems is complemented by an operation of sending a message to the output Kafka only if the computation result is equal to the value corresponding to the end of the processing.
In summary, the system throughput is measured using the dataset size and the difference between the time of the initiation of dataset sending and the arrival time of the message sent, when processing reaches the predetermined computation result. The throughput is computed as a number of flows sent per second.
V. RESULTS
The performance benchmark can be adapted to any dis-tributed stream processing system. For the needs of this paper we have selected the three currently most used systems – Samza, Storm, and Spark. The benchmark was deployed on a cluster of 7 nodes. The configuration of this cluster cor-responds to commonly used settings, making the benchmark more realistic.
A. Testbed Configuration
We prepared a dedicated cluster of 7 VMware vSphere 6.0 nodes to deploy the benchmark and three distributed stream processing systems. Each of these nodes had the following configuration:
∙ 2 x Intel○R Xeon○R E5-2670 (16/32 HT cores in total),
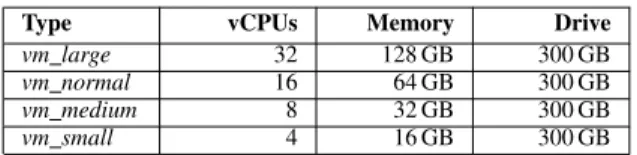
∙ 192 GB 1600M MHz RDIMM ECC RAM, ∙ 2 x HDD 600 GB SAS 10k RPM, 2,5” (RAID1), ∙ 10 Gbit/s network connection, 1 Gbit/s virtual NICs. The use of virtualization technology is very common in modern computation clusters and allows us to prepare multiple different environments to benchmark the tested system. We used four different types of VMware virtual machines differing in the number of available virtual CPUs and available memory, as described in Table II.
The following software and distributed stream processing systems were installed on virtual nodes:
∙ Debian Linux 8.1.0 x64 ∙ Oracle Java 1.8.0 ∙ Scala 2.9.2 ∙ Apache Hadoop 2.7.1 ∙ Apache Zookeeper 3.4.5 ∙ Apache Kafka 0.8.2.1 ∙ Apache Spark 1.4.1 ∙ Apache Storm 0.9.4 ∙ Apache Samza 0.8.0
The benchmark was deployed on single and four cluster nodes. The two remaining nodes were running Kafka to produce an input stream of flows and consume computation re-sults. These Kafka nodes run on thevm largevirtual machine, enabling flow generation at a maximum speed. The Kafka at the input used a dataset containing 100 million flows, with the size of 27 GB. This dataset enables the full utilization of the tested system and a correct throughput measurement.
TABLE II
VMWARE VIRTUAL MACHINES CONFIGURATIONS.
Type vCPUs Memory Drive
vm large 32 128 GB 300 GB
vm normal 16 64 GB 300 GB
vm medium 8 32 GB 300 GB
vm small 4 16 GB 300 GB
B. Benchmark Results
It is important to note that, with respect to the default settings, we have configured the tested systems only in terms of functionality, i.e. in order to run the benchmarks success-fully. No performance fine-tuning was used. Moreover, as already mentioned in the dataset-related section, only a basic partitioning scenario was used for the benchmarks , i.e. the number of partitions was equal to the sum of computing cores.
This is very important since, generally speaking, the number of partitions directly influences the level of parallelization and in turn the throughput of the tested system as a whole. However, this does not always necessarily mean the more partitions the better, e.g. too many partitions can have a negative impact on the network layer. Both the above-mentioned facts must be carefully considered when interpreting the results.
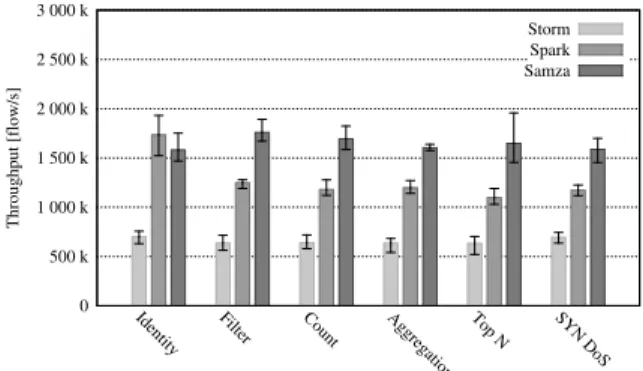
Ten throughput measurements (repetitions) were used for the benchmark of the selected distributed stream processing systems. Figures 2-5 depict the average value of these repeti-tions, along with their maximum and minimum values.
0 500 k 1 000 k 1 500 k 2 000 k 2 500 k 3 000 k
Identity Filter Count Aggregation Top N SYN DoS
Throughput [f
low/s]
Storm Spark Samza
Fig. 2. Performance benchmark using 1vm largenode (32 vCPUs in total), with scattering highlighted.
1) One vm large node: The first benchmark is performed
using one node with 32 vCPUs. The benchmark results, depicted in Figure 2, show the expected maximum throughput of each system on the Identity operation. Whereas the Samza throughput is still around 1 500 k flow/s for all operations, the throughput of Storm and Spark decreases to 700 k flow/s approximately. We believe that the throughput slowdown was caused by the shuffling of incoming messages before their pro-cessing, which led to input socket overloading. Thanks to the direct processing of messages, Samza was not affected by this.
0 500 k 1 000 k 1 500 k 2 000 k 2 500 k 3 000 k
Identity Filter Count Aggregation Top N SYN DoS
Throughput [f
low/s]
Storm Spark Samza
Fig. 3. Performance benchmark using 1vm normalnode (16 vCPUs in total), with scattering highlighted.
2) One vm normal node: Based on the analysis of systems
logs and the results of one vm large node, we decided to make a similar benchmark using a smaller number of processor cores. This led to an overall increase in the system’s through-put, since the input socket was not overloaded. Using only
16 vCPUs, Samza was able to process around 1 700 k flow/s. We also observed a significant increase in Spark throughput, while Storm retained its previous result or lower. The results of the benchmark using one vm normalnode are depicted in Figure 3. 0 500 k 1 000 k 1 500 k 2 000 k 2 500 k 3 000 k
Identity Filter Count Aggregation Top N SYN DoS
Throughput [f
low/s]
Storm Spark Samza
Fig. 4. Performance benchmark using 4vm mediumnodes (32 vCPUs in total), with scattering highlighted.
3) Four vm medium nodes: Another performance
bench-mark was performed using 4 vm medium nodes, connected in a network, with 32 vCPUs in total. With these benchmark settings, the maximum throughput reached up to 2 000 k flow/s, as depicted in Figure 4. This result shows that the architecture of the tested systems is better adapted to deployment in a clus-ter than to single node. This applies mostly to Spark, which has a similar throughput as Samza. The result also shows a large variance in maximum and minimum values which was probably caused by the network load or system errors.
0 500 k 1 000 k 1 500 k 2 000 k 2 500 k 3 000 k
Identity Filter Count Aggregation Top N SYN DoS
Throughput [f
low/s]
Storm Spark Samza
Fig. 5. Performance benchmark using 4vm smallnodes (16 vCPUs in total), with scattering highlighted.
4) Four vm small nodes: Similarly to the single node
benchmark, we decreased the number of available cores for 4 nodes to 16 in total. The results of the benchmark are depicted in Figure 5. In this case, there is no increase in data processing speed. Instead, the throughput decrease, corresponding to a reduction by half, can be noticed in the throughput of Storm. Samza’s throughput was decreased only minimally. This led us to the assumption, that Samza, deployed on 32 cores in total, was limited by network bandwidth saturation and not by computing complexity.
VI. DISCUSSION
The benchmark results show that every distributed stream processing system which was benchmarked is able to process at least 500 k flow/s using 16 or 32 processor cores. This fulfils the minimal requirement of 300 k flow/s throughput. However, Spark and Samza offer a much higher throughput than Storm. This even allows us to analyse flow data from multiple networks at the same time. We assume that the systems are probably capable of higher throughput using a more space-efficient data format than JSON (e.g. MessagePack), since its size leads to overloading of network during the benchmark.
The benchmark results also clearly show that Samza and Spark are able to provide high data processing throughput on a single node. This eliminates the need for large clusters con-taining multiple nodes for real-time flow data analysis. Thus, stream processing can be deployed on a single server together with NFDUMP [2] to extend its analysing functionality.
Although Samza has the best throughput results, we cannot say that it is perfectly suitable for flow data processing. The strict requirement for a number of data partitions correspond-ing to available processor cores is the biggest disadvantage of Samza. If partitioning cannot be performed before Samza is deployed, the analysis is performed using multiple partitions, which requires a shared state causing a throughput slowdown. Thus, in the case of selecting an appropriate system, the deci-sion needs to consider not only the advantages and disadvan-tages of system itself, but also the deployment environment.
The results show that each of the tested distributed stream processing systems have very specific behaviour depending on the cluster setup. To fully understand the behaviour of each system, a large number of test variations would have to be run considering different cluster setups, different number of partitions and different fine-tuned configurations. Although such a rigorous process is out of the scope of this paper, the proposed benchmark enables such a large number of test variations to be performed in a comparable and repeatable way.
VII. CONCLUSION
We have proposed the novel performance benchmark of a flow data analysis on distributed stream processing sys-tem. The selected systems were benchmarked using a set of operations, based on real network data analysis methods. The benchmark results of the three most used distributed stream processing systems show, that each tested system is able to handle normal traffic, as well as its peaks in both small and large networks. However, when considering default configurations and a lack of fine-tuning, only Samza and Spark have a high-enough flow throughput and can be used for the analysis of data from multiple networks at the same time. Our benchmark may be used to determine the performance of processing any small structured messages on any stream processing system.
The source code of the benchmark and dataset prepara-tion scripts can be downloaded from https://is.muni.cz/repo/ 1323006/dsp-systems-benchmark.zip.
ACKNOWLEDGEMENT
This research was supported by the Technology Agency of the Czech Republic under No. TA04010062 Technology for
processing and analysis of network data in big data concept.
REFERENCES
[1] R. Hofstede, P. ˇCeleda, B. Trammell, I. Drago, R. Sadre, A. Sperotto, and A. Pras, “Flow Monitoring Explained: From Packet Capture to Data Analysis with NetFlow and IPFIX,”Communications Surveys Tutorials, IEEE, vol. PP, no. 99, pp. 2037–2064, 2014.
[2] P. Haag, “NFDUMP,” Web page, December 2014, accessed August 6, 2015. [Online]. Available: http://nfdump.sourceforge.net/
[3] M. Zaharia, T. Das, H. Li, S. Shenker, and I. Stoica, “Discretized streams: An efficient and fault-tolerant model for stream processing on large clusters,” inProceedings of the 4th USENIX Conference on Hot Topics in Cloud Ccomputing, ser. HotCloud’12. Berkeley, CA, USA: USENIX Association, 2012.
[4] Apache Software Foundation, “Samza,” Web page, 2015, accessed August 6, 2015. [Online]. Available: http://samza.apache.org/ [5] ——, “Apache Storm,” Web page, 2014, accessed August 6, 2015.
[Online]. Available: https://storm.apache.org/
[6] R. Hofstede, A. Sperotto, T. Fioreze, and A. Pras, “The Network Data Handling War: MySQL vs. NfDump,” inNetworked Services and Applications - Engineering, Control and Management, ser. Lecture Notes in Computer Science, F. A. Aagesen and S. J. Knapskog, Eds. Springer Berlin Heidelberg, 2010, vol. 6164, pp. 167–176.
[7] J. Dean and S. Ghemawat, “MapReduce: Simplified Data Processing on Large Clusters,” Communications of the ACM, vol. 51, no. 1, pp. 107–113, January 2008.
[8] T. White, Hadoop: The Definitive Guide, M. Loukides and M. Blanchette, Eds. O’Reilly Media, Inc., May 2009.
[9] Y. Lee and Y. Lee, “Toward scalable internet traffic measurement and analysis with hadoop,” SIGCOMM Comput. Commun. Rev., vol. 43, no. 1, pp. 5–13, January 2013.
[10] R. Fontugne, J. Mazel, and K. Fukuda, “Hashdoop: A MapReduce framework for network anomaly detection,” in 2014 IEEE Conference on Computer Communications Workshops (INFOCOM WKSHPS), April 2014, pp. 494–499.
[11] S. Marchal, X. Jiang, R. State, and T. Engel, “A Big Data Architecture for Large Scale Security Monitoring,” in 2014 IEEE International Congress on Big Data (BigData Congress), June 2014.
[12] L. Neumeyer, B. Robbins, A. Nair, and A. Kesari, “S4: Distributed Stream Computing Platform,” in 2010 IEEE International Conference on Data Mining Workshops (ICDMW), December 2010.
[13] Apache Software Foundation, “Flink,” Web page, 2015, accessed August 6, 2015. [Online]. Available: https://flink.apache.org/
[14] R. Lu, G. Wu, B. Xie, and J. Hu, “Streambench: Towards benchmarking modern distributed stream computing frameworks,” in2014 IEEE/ACM 7th International Conference on Utility and Cloud Computing (UCC), December 2014, pp. 69–78.
[15] J. Kreps, N. Narkhede, and J. Rao, “Kafka: A distributed messaging sys-tem for log processing,” inProceedings of 6th International Workshop on Networking Meets Databases (NetDB), Athens, Greece, 2011. [16] Apache Software Foundation, “Apache Mesos,” Web page, 2012,
accessed December 16, 2015. [Online]. Available: http://mesos.apache. org/
[17] Tachyon Project, “Tachyon,” 2013, accessed December 16, 2015. [Online]. Available: http://tachyon-project.org/
[18] Apache Software Foundation, “Apache Hadoop NextGen MapReduce
(YARN),” web page, 2015, accessed September 8, 2015.
[Online]. Available: http://hadoop.apache.org/docs/current/hadoop-yarn/ hadoop-yarn-site/YARN.html
[19] M. Zaharia, M. Chowdhury, M. J. Franklin, S. Shenker, and I. Stoica, “Spark: Cluster Computing with Working Sets,” inProceedings of the 2Nd USENIX Conference on Hot Topics in Cloud Computing, ser. HotCloud’10. USENIX Association, 2010.
[20] A. Sperotto, G. Schaffrath, R. Sadre, C. Morariu, A. Pras, and B. Stiller, “An Overview of IP Flow-Based Intrusion Detection,”IEEE Communi-cations Surveys Tutorials, vol. 12, no. 3, pp. 343–356, 2010.
[21] CAIDA, “The CAIDA UCSD Anonymized Internet Traces 2015 - 20150219-130000.” [Online]. Available: http://www.caida.org/data/ passive/passive 2015 dataset.xml