Whittles, David N. (2000) The application of rock mass
classification principles to coal mine design. PhD thesis,
University of Nottingham.
Access from the University of Nottingham repository: http://eprints.nottingham.ac.uk/14261/1/311822.pdf
Copyright and reuse:
The Nottingham ePrints service makes this work by researchers of the University of Nottingham available open access under the following conditions.
· Copyright and all moral rights to the version of the paper presented here belong to the individual author(s) and/or other copyright owners.
· To the extent reasonable and practicable the material made available in Nottingham ePrints has been checked for eligibility before being made available.
· Copies of full items can be used for personal research or study, educational, or not-for-profit purposes without prior permission or charge provided that the authors, title and full bibliographic details are credited, a hyperlink and/or URL is given for the original metadata page and the content is not changed in any way.
· Quotations or similar reproductions must be sufficiently acknowledged.
Please see our full end user licence at:
http://eprints.nottingham.ac.uk/end_user_agreement.pdf
A note on versions:
The version presented here may differ from the published version or from the version of record. If you wish to cite this item you are advised to consult the publisher’s version. Please see the repository url above for details on accessing the published version and note that access may require a subscription.
University of Nottingham
School of Chemical, Environmental and Mining Engineering
THE APPLICATION OF ROCK MASS
CLASSIFICATION
PRINCIPLES TO COAL MINE
DESIGN
By
David N. Whittles
B.Sc.(Hons), M.Sc., FGS
Thesis submitted to the University of Nottingham
for the degree of Doctor of Philosophy
CONTENTS
Abstract i Affirmation .iii List ofFigures iv List ofTables xi CHAPTERtAN INTRODUCTION TO THE THESIS
1.1 INTRODUCTION 1
1.2 OBJECTIVES OF THESIS 4
CHAPTER2
GEOLOGY OF THE UNITED KINGDOM COAL MEASURES
2.t GENERAL STRATIGRAPHY 7
2.1.1 Introduction 7
2.1.2 Depositional Environments Of The UK Coal Measures 8
2.1.2.1 Sedimentary Province 9 2.2 DIAGENESIS 9 2.2.1 Introduction 9 2.2.2 Diagenesis Of Sandstones 10 2.2.3 Diagenesis OfMudrocks 12 2.3 TECTONIC EVENTS 11 • • • • • • • • • • • • • • • • • • • • • • • • • • • • • • • • • • " • • • • • • • • • • • • • • • • • •13
2.4 UK COAL MEASURE ROCK TYPES 15
2.4.1 Sandstones 15
2.4.2 Mudrocks 15
2.4.2.1 Siltstone 16
2.4.2.2 Mudstones 16
2.4.2.3 Claystones and Seatearths 17
2.4.2.4 Shale 17 2.4.3 Coal 17 2.S SEDIMENTARY STRUCTURES .18 2.5.1 Introduction , 18 2.5.2 Bedding , , , 18 2.5.2.1 Massive Bedding 19
2.5.2.2 Cross Bedding 19
2.5.2.3 Graded Bedding 19
2.5.2.4 Laminations 19
2.5.3 Soft Sediment Structures 19
2.5.3.1 Convoluted Bedding 20
2.5.3.2 Convoluted Laminations 20
2.5.3.3 Load Casts and Pseudo Nodules 20
2.5.3.4 Slump Structures 21
2.5.3.5 Organic Sedimentary Structures 21
2.5.4 Sedimentary Structures Affecting Coal Seams 21
2.5.4.1 Washouts 21 2.5.4.2 RoofRolls 21 2.5.4.3 Swilleys 22 2.5.4.4 Seam Splits 22 2.5.4.5 Dirt Partings , , 22 2.6 NON-SEDIMENTARY STRUCTURES 23 2.6.1 Introduction 23 2.6.2 Discontinuities 23 2.6.2.1 Joints 23 2.6.2.1.1 Mechanism ofjointformation 24 2.6.2.1.2 Coal cleat 27
2.6.2.1.3 Joint spacing distributions 28
2.6.2.1.4 Averagejoint spacing 28
2.6.2.1.5 Joint spacing in thick beds 30
2.6.2.2 Faults 31
2.6.2.2.1 Origin offaults 32
2.6.3 Folding 32
2.7 IN-SITU STATE OF STRESS WITHIN UK COAL MEASURES 34
2.7.1 Introduction 34
2.7.2 Sources Of In-Situ Stress 34
2.7.2.1 Gravitational Stress 35
2.7.2.1.1 The affect of surface topography 36
2.7.2.2 Tectonic Stress 36
2.7.2.3 Structural Stress 37
2.7.3 Global In-Situ Stress 37 2.7.4 In-Situ Stress Within The United Kingdom 38 2.7.5 In-Situ Stress Within The UK Coal Measures 41
2.8 CONCLUSION 42
CHAPTER3
UK COAL MINING AND COAL MINE STABILITY
3.1 LONGWALL EXTRACTION TECHNIQUES .43
3.1.1 Introduction 43
3.1.2 Longwall Advance Methods 43
3.1.3 Longwall Retreat Methods 44
3.1.3.1 Semi Retreat Methods 45
3.1.3.2 Single Entry Longwalls 45
3.1.4 Layout Of Longwalls 45
3.2 MINING INDUCED STRESS 46
3.2.1 Introduction 46
3.2.2 Stress Distributions Around a Simplified Excavations In
Homogeneous Medium 47
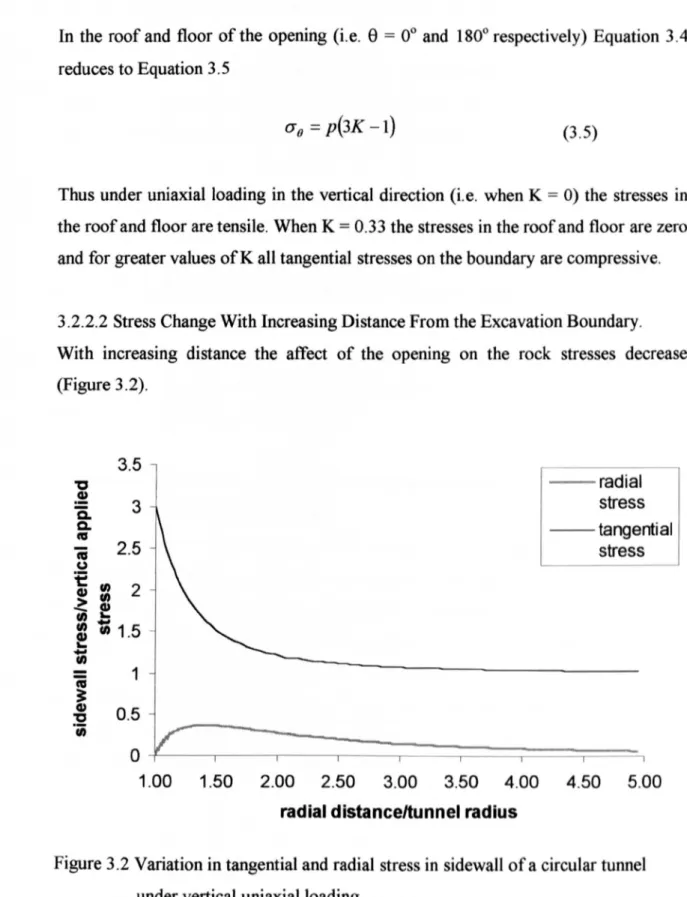
3.2.2.1 Stresses at the Excavation Boundary .48 3.2.2.2 Stress Change with Increasing Distance from the Excavation
Boundary 49
3.2.3 Stress Distributions Around Rectangular Excavations In An
Homogeneous Elastic Medium 50
3.2.4 Influence Of A Yield Zone On Stress Distributions Around A Circular
Excavation I• • • • • • • • • • • • • • • • • • • • • • • • • • • • • • • • • • • • 51 3.2.5 Stress Distributions Around Longwall Panels In Coal Measure
Strata 52
3.2.5.1 Vertical Stress Distributions 52
3.2.5.1.1 Front abutment · 54
3.2.5.1.2 Flank abutments 54
3.2.5.1.3 Rear abutments 54
3.2.6 Affect Of Differential Horizontal In-Situ Stresses On Stress
Distributions Around Longwall Panels 58
3.2.7 Affect Of Stress Interactions With Adjacent Workings 58
3.2.7.1 Neighbouring Panels 58
3.2.7.1.1 Vertical stress interaction 58
3.2.7.1.2 Horizontal stress interaction 60
3.2.7.2 Overlying and Underlying Workings 60
3.2.7.2.1 Pillars 60
3.2.7.2.2 Goafs 62
3.3 ROADWAY AND GATE ROAD STABILISATION TECHNIQUES 63
3.3.1 Introduction 63
3.3.2 Free Standing Supports 64
3.3.3 Rock Reinforcement Techniques 65
3.3.3.1 RoofBolting 65
3.3.3.2 Cable Bolting 66
3.3.3.3 Rib Bo1ting 68
3.3.4 Road Side Packs 68
3.4 CHARACTERISTIC MECHANISM OF STRATA DEFORMATION
WITHIN COAL MINES 71
3.4.1 Introduction 71
3.4.2 Roof Deformation Mechanisms 72
3.4.3 Floor Deformation Mechanisms 74
3.4.3.1 The Affect of Water on Clay Rich Mudrocks 74
3.4.3.2 Floor Deformation Mechanisms 76
3.4.4 Rib Deformation Mechanisms 79
3.5 CONCLUSIONS 81
CHAPTER4
CHARACTERISATION OF THE MECHANICAL PROPERTIES OF ROCK AND ROCK MASSES
4.1 INTRODUCTION 83
4.2 MECHANICAL PROPERTIES OF INTACT ROCK 83
4.2.3 Intact Rock Failure 87
4.2.3.1 Influencing Parameters 87
4.2.3.1.1 Confining pressure 87
4.2.3.2 Failure Criteria 88
4.2.3.3 Theoretical Failure Criteria : 88
4.2.3.3.1 Coulomb's theory and criterion 89
4.2.3.3.2 Mohr'sfailure criterion 91
4.2.3.3.3 Griffith's theory and criterion/or brittlefracture 92
4.2.3.4 Empirical Failure Criteria 94
4.2.3.4.1 Murrel's criterion 95
4.2.3.4.2 Bieniawski's criterion 95
4.3 MECHANICAL PROPERTIES OF ROCK MASSES 97
4.3.1 Introduction 97
4.3.2 Stiffness Properties Of Rock Masses 98
4.3.3 Rock Mass Failure Criteria 10 1
4.3.3.1 Hoek-Brown Criterion 101
4.3.3.2 Bieniawski- Yudhibr Criterion 105
4.3.3.3 Ramamurthy's Criterion 105
4.3.4 Application of Rock Mass Failure Criteria to the UK
Coal Measure Strata 106
4.3.4.1 Development of a Rock Mass Failure Criteria for UK
Coal Measure Strata 107
4.3.4.2 Evaluation of Most Suitable Criterion for Predicting
Failure of Coal Measure Strata 109
4.4 MECHANICAL PROPERTIES OF ANISOTROPIC ROCKS .111 4.4.1 Introduction I • • •f• • • • • • • If • • • • • • • • • • t • • • • • I • • • • • • • • • • • •111
4.4.2 Elastic Properties Of Stratified Rocks 111
4.4.2.1 Orthotropy I• • II• I. I• I• • • • • • • • 111
4.4.2.2 Transverse Isotropy 112
4.4.3 Failure Criteria For Anisotropic Rocks 113
4.5 ROCK MASS CLASSIFICATIONS 114
4.5.1 Introduction 1 • • • 1 • • • • • • • • 1• • • • • • • • • • • • • • • • • • • • • • • • • • • • • • • • 114
4.5.2 Terzaghi's Rock Load Height Classification 115
4.5.3 Lauffer's Classification 118
4.5.5 Rock Structure Rating (RSR) .119 4.5.6 Rock Mass Rating (Geomechanics Classification) 122 4.5.7 NGI Tunneling Quality Index ('Q' Index) 126 4.5.8 The Utilisation Of Rock Mass Classification In Coal Mine Design 132 4.5.9 USBM Coal Mine Roof Rating Classification 140
4.5.9.1 USBM Floor Quality Classification 143
4.6 CONCLUSIONS 143
CHAPTERS
DEVELOPMENT OF A ROCK MASS CLASSIFICATION FOR UK COAL MINE DESIGN
5.1 INTRODUCTION 145
5.2 SELECTION OF CLASSIFICATION STRUCTURE 145
5.3 IDENTIFICATION OF THE KEY CLASSIFICATION PARAMETERS 147
5.3.1 Introduction 147
5.3.2 Conceptual Mechanisms Of Strata Deformation 148 5.3.2.1 Roadway Floor Deformation Mechanisms .149 5.3.2.2 Roadway Roof Deformation Mechanisms 150
5.3.2.2 Coal Face Deformation Mechanisms 151
5.3.2.3 Pillar / Rib Side Deformation Mechanisms 152
5.3.3 Parameter Assessment 157
5.3.2.4 Path I: Assessment of Parameters Used in Existing Rock Mass
Classification Systems 157
5.3.2.5 Path 2: Assessment of Parameters Used in Existing Coal Mine
Classifications Systems 159
5.3.2.6 Path 3: Review of Lithological Classification Systems and Coal
Measure Rock Types 161
5.3.4 Synthesis OfParameters 161
5.4 DESCRIPTION OF IDENTIFIED CLASSIFICATION PARAMETERS I63
5.4.1 Introduction 163
,
5.4.2 Unconfmed Compressive Strength (UCS) 163
5.4.2.1 Point Load Test 163
5.4.2.2 NCB Cone Indenter 166
5.4.3.1 Number of Joint/Cleat Sets .168 5.4.3.2 Joint Spacing 169 5.4.3.3 Joint Roughness 169 5.4.3.4 Joint Persistence 170 5.4.3.5 Cleat Dominance 170 5.4.3.6 Joint/Cleat Orientation 171
5.4.4 Bedding And Lamination Plane Characteristics 171
5.4.4.1 Bedding / Lamination Plane Strength 171
5.4.4.2 Bedding ILamination Spacing 172
5.4.5 Fissility 172
5.4.6 Groundwater Flow 173
5.4.7 Moisture Sensitivity 173
5.5 DERIVATION OF PARAMETER IMPORTANCE RATINGS 175
5.5.1 Introduction 175
5.5.2 Maximum Importance Rating 176
5.5.3 Rating Scales 180
5.5.4 Adjustment For Joint/Cleat Orientation 181
5.6 OUTLINE OF THE COAL MINE CLASSIFICATION .181
5.6.1 Introduction 1• • • • • • • • • • • • • • • • • • • • • • • 181 5.6.2 Characterisation Of Strata Anisotropy Using Coal Mine
Classification Rating 186
5.6.3 Applying The Coal Mine Classification 188
5.7 CONCLUSIONS 189
CHAPTER6
APPLICATION OF THE COAL MINE CLASSIFICATION TO UK COAL MINES
6.1 INTRODUCTION I• • • 192
6.1.1 Data Uncertainty 192
6.2 APPLICATION OF THE COAL MINE CLASSIFICATION TO
RICCALL MINE, NORTH YORKSHIRE .192
6.2.1 Introduction , 192
6.2.2 General Strata Sequence Adjacent To The Barnsley Seam 193
6.2.4 Roadway Dimensions 198 6.2.5 Installed Supports 198 6.2.5.1 Primary Support 199 6.2.5.2 Secondary Support 199 6.2.6 Monitoring Data 199 6.2.7 In-Situ Stress 199 6.2.8 Mining Interactions 200
6.2.9 Intact Rock Properties 200
6.2.9.1 Triaxial Strength 201
6.2.9.2 Young's Modulus 201
6.2.10 Application Of The Coal Mine Classification 203 6.2.10.1 Case Study Locality 1:
Pane1438, Main Gate 214 Metre Mark 204
6.2.1 0.2 Case Study Locality 2:
Panel 478, Main Gate 31 Metre Mark 206
6.2.10.3 Case Study Locality 3:
Panel 478, Main Gate 110 Metre Mark 207
6.2.10.4 Case Study Locality 4:
Panel 478, Main Gate 387 Metre Mark 208
6.2.10.5 Case Study Locality 5:
Panel 478, Main Gate 486 Metre Mark 209
6.2.10.6 Case Study Locality 6:
Panel 478, Main Gate 587 Metre Mark 210
6.2.10.7 Case Study Locality 7:
Panel 478, Main Gate 710 Metre Mark 211
6.2.10.8 Case Study Locality 8:
Panel 50S, Tail Gate 353 Metre Mark 212
6.2.10.9 Case Study Locality 9:
Panel SOS, Tail Gate 922 Metre Mark 213
6.2.10.10 Case Study Locality 10:
Panel 505, Main Gate 669 Metre Mark 214
6.2.10.11 Case Study Locality 11:
Panel 50S, Main Gate 902 Metre Mark 215
Panel 505, Main Gate 1583 Metre Mark 216
6.3 APPLICATION OF THE COAL MINE CLASSIFICATION TO DAW
MILL MINE, WARWICKSHIRE 217
6.3.1 Introduction 217
6.3.2 General Strata Sequence Adjacent To The Warwickshire
Thick Seam 217
6.3.3 Structure Of The Warwickshire Thick Coal.. 219
6.3.4 Roadway Dimensions 219
6.3.5 Installed Supports 219
6.3.5.1 Roof Bolt Bond Strength 219
6.3.6 Monitoring Data 220
6.3.7 In-Situ Stress 221
6.3.8 Mining Interaction 221
6.3.9 Intact Rock Properties 221
6.3.9.1 Triaxial Strength 221
6.3.9.2 Young's Modulus 223
6.3.10 Application Of The Coal Mine Classification 223
6.4 APPLICATION OF THE COAL MINE CLASSIFICATION
TO ROSSINGTON MINE, SOUTH YORKSHIRE 225
6.4.1 Introduction 225
6.4.2 General Strata Sequence Adjacent To The Barnsley Seam 228
6.4.3 Roadway Dimensions 228
6.4.4 Installed Supports 228
6.4.5 Monitoring Data 229
6.4.5.1 RoofDisplacement. 229
6.4.5.2 Rib Displacement. 230
6.4.6 In-Situ Stress ...t • • • • • • • • • • • • • • • • • • • 1,.,1.1 • • II • • • • II' I• • • • • • • • • • • II • • • • • • • II • • • • 231I. I" • • • •
6.4.7 Mining Interactions 231
6.4.8 Intact Rock Properties 232
6.4.8.1 Triaxial Strength ofRoofStrata 232
6.4.8.2 Triaxial Strength of the Bamsley Seam 232
6.4.8.3 Elastic Modulus 233
6.4.9 Application Of The Coal Mine Classification 233
r ,
6.4.9.1 Classification of the RoofStrata 233
6.5 CONCLUSIONS 237
CHAPTER 7
NUMERICAL MODELLING STUDIES
7.1 INTRODUCTION 238
7.2 STRATA MODELLING TECBNIQUES 238
7.2.1 Closed Form Techniques 238
7.2.2 Limit Equilibrium Techniques 239
7.2.3 Photo-Elastic Techniques 239
7.2.4 Physical Modelling Techniques 240
7.3 COMPUTER BASED NUMERICAL MODELLING METHODS 241
7.3.1 Introduction 241
7.3.2 Solution Techniques 242
7.3.3 Numerical Modelling Methodologies 242
7.3.3.1 Boundary-Element Method 242
7.3.3.2 Distinct-Element Method 243
7.3.3.3 Finite Element Method 243
7.3.3.4 The Finite Difference Method 244
7.4 FAST LANGRANGIAN ANALYSIS
OF CONTINUA (FLAC) 245
7.4.1 Introduction 245
7.4.2 The Finite Difference Grid 247
7.4.3 FLAC Constitutive Models 247
7.4.3.1 Null Model. 247
7.4.3.2 Elastic Model Group 248
7.4.3.2.1 Elastic isotropic model 248
7.4.3.2.2 Elastic, transversely isotropic model 248
7.4.3.3 Plasticity Models 248
7.4.3.3.1 Mohr-Coulomb model 248
7.4.3.3.2 Ubiquitous joint model 249
7.4.3.3.3 Strain-softening model 249
7.4.3.3.4 Other plastic models provided/or in FLAC 249
7.4.5 Initial Stress Conditions 250
7.4.6 FLAC Modelling Methodology 250
7.S NUMERICAL MODELLING OF GATE ROAD DEFORMATIONS
WITHIN UK COAL MINES 253
7.5.1 Introduction 253
7.5.2 Numerical Modelling Of Gate Road Deformation,
Riccall Colliery 254
7.5.2.1 Establishment ofa Modelling Methodology 254
7.5.2.1.1 Roof deformation characteristics,922 mm tail gate,
505 panel, Riccall 254
7.5.2.1.2 Selection of constitutive material model.. 255
7.5.2.2 Modelling Input Parameters 256
7.5.2.2.1 Elastic parameters 256
7.5.2.2.2 Strength properties 258
7.5.2.2.3 Density 258
7.5.2.2.4 Modelling of support elements 258
7.5.2.2.5 Theflnite difference grid 261
7.5.2.2.6 Boundary conditions 261
7.5.2.2.7 Running the simulation 261
7.5.2.2.8 Time dependency 263
7.5.2.2.9 Analysis ofresults 263
7.5.2.3 Numerical Modelling of Case Study Localities at the
Riccall Mine Site 264
7.5.2.3.1 Analysis ofresults 264
7.S.3 Numerical Modelling Of Gate Roads Within Daw Mill
Colliery, Warwickshire 277
7.5.3.1 Installed Roadway Supports 277
7.5.3.2 Results of Numerical Modelling 278
7.5.3.3 Sensitivity of Model to Shear Strength of Rock/Grout Bond 278
7.5.4 Numerical Modelling Of The Tall Gate, B3 Panel,
Rossington Colliery, Yorkshire 281
7.5.4.1 Introduction 281
7.5.4.2 Modelling ofB3 Panel Main Gate 24 Metre Mark 282
7.5.4.3 Modelling ofB3 Panel Main Gate 408 Metre Mark 282
7.5.4.5 Modelling of Rib Displacement in B3 Panel,
Main Gate, 24 Metre Mark 289
7.5.4.6 Modelling of Rib Displacement in B3 Panel Main Gate,
415 Metre Mark 294
CONCLUSIONS 294
CHAPTERS
GENERAL CONCLUSIONS AND RECOMMENDATIONS
s.i
GENERAL CONCLUSIONS 295S.2 RECOMMENDATIONS FOR FUTURE STUDIES 299
REFERENCES 301
ACKNOWLEDGEMENTS
APPENDIX I
-Stress Strain Plots For Roof Strata Samples, Panels 478 and 505, Riccall Mine
APPENDIX2
-Application of Rock Mass Failure Criteria to Triaxial Data
APPENDIX3
ABSTRACT
This thesis aims to develop a rock mass classification system for UK Coal Measure strata such that the output from the classification system may provide a means by which the strength and stiffness properties of Coal Measure strata encountered within UK coal mines may be predicted.
The development of the Coal Mine Classification system is described within this thesis. A structured methodology utilising a database of information obtained from 118 different rock mass classifications, together with consideration of the typical mechanisms of strata deformation within coal mines, was employed to determine the parameters of the Coal Measure strata that have the greatest influence on the engineering properties of the strata. These identified parameters have formed the basis of the Coal Mine Classification system. By comparison to a series of conceptual models of strata deformation that occur within the roof ,floor, ribs of roadways and within the region of the coal face, relative importance weightings and rating scales for the identified classification parameters have been proposed.
The anisotropic nature of the UK Coal Measures is characterised within the Coal Mine Classification by the calculation of separate ratings for directions parallel to and perpendicular to bedding.
An appraisal of the optimum method of using the classification ratings, determined by the Coal Mine Classification, to predict the strength properties of individual strata units was undertaken. Rock mass failure criteria that utilise outputs from existing rock mass classification systems to determine the rock mass strength, have been reviewed. Utilising published triaxial data the rock mass failure criterion that best predicts the failure characteristics of UK Coal Measure strata was identified. From this study the Hoek-Brown rock mass failure criterion was identified as the optimum existing criterion for predicting the intact strength and rock mass strength of Coal Measure strata. However this criterion was still found not to produce a close fit in many cases to the intact failure strength of the strata. A modified Coal Measure Failure criterion has been developed, which for a wide range of Coal Measure rock types was found to produce a better prediction of the intact strength of Coal Measure strata than any of the existing rock mass failure criteria.
To determine the efficacy of the Coal Mine Classification system as a means of predicting the strength and stiffness properties of the rock mass the Coal Mine Classification was applied to the strata at case study localities within rock bolted roadways within three UK mine sites.
Numerical models of the case study localities were developed using the FLAC finite difference code utilising a ubiquitous jointed elastic-perfectly plastic material model to simulate strata behaviour. The output from the modelling included predicted roof and rib side displacements, and these displacements were compared to the actual monitoring data for the case study localities.
The results of the numerical modelling indicate that the predictions produced by the numerical models reflected the pattern and scale of deformations actually measured in-situ within the coal mine roadways, thus indicating that the Coal Mine Classification system provides a means of predictively determining the engineering properties of the in-situ Coal Measure strata.
The modelling also indicated that time delays related to the installation of the roof extensometers may under predict that actual roof deformation that occurs within the roadway roof.
AFFIRMATION
The following publications include the findings and results obtained during the research for this thesis:
''The Application of Rock Mass Classification Principles to Coal Mine Design" The 5th International Conference on Mining, Petroleum and Metallurgical Engineering, Suez Canal University, Feb. 24th to 26th 1997, R.K. Dunham, P.W. Lloyd, DJ. Reddish and D.N. Whittles.
"Anisotropic Strength and Stiffness Properties of Some UK Coal Measure
Siltstones", unpublished paper, (submitted to the Quarterly Journal of Engineering Geology) E. Yasar, D.N Whittles, P.W. Lloyd and DJ Reddish.
LIST OF FIGURES
Figure 2.1 Westphalian Paleogeography of the United Kingdom
Figure 2.2 Progressive Compaction of Mudrocks with Depth
Figure 2.3 Surface Features on a Joint Plane
Figure 2.4 Variation in Stress Due to Simple Uplift
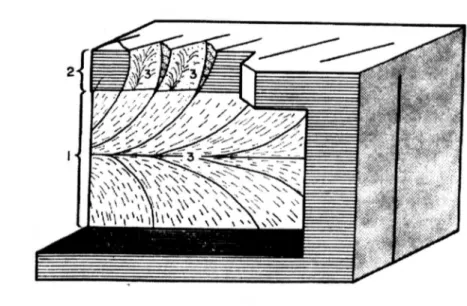
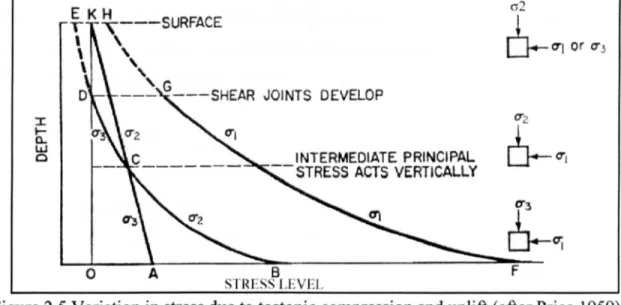
Figure 2.5 Variation in Stress Due to Tectonic Compression and Uplift
Figure 2.6 Faulting and its Relationship to the Principal Stresses at Failure.
Figure 2. 7 Vertical Stress Against Depth Below Surface
Figure 2.8 Ratio of Average Horizontal Stress to Vertical Stress With Depth Below Surface
Figure 2.9 Orientation of the Maximum Principal Stress in North West Europe
Figure 3.1 'Z' Semi-Retreat System
Figure 3.2 Variation in Tangential and Radial Stress in a Sidewall of a Circular
Tunnel Under Vertical Uniaxial Loading
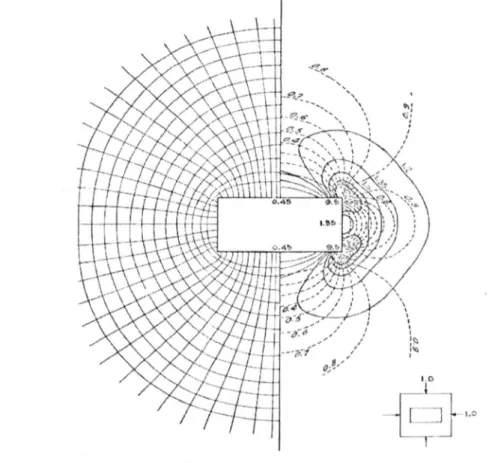
Figure 3.3 Theoretical Stress Distribution Around a Rectangular Opening in an
Homogeneous Elastic Medium.
Figure 3.4 Stresses Around a Circular Roadway Surrounded by a Yield Zone.
Figure 3.5 Vertical Stress Distribution Around a Retreat Longwall Panel
Figure 3.6 Stress Distributions along Figure 3.5
Figure 3.7 Horizontal Stress Redistribution Around a Longwall Retreat Panel
Figure 3.8 Induced Vertical Stress in Strata Above an Underlying Pillar
Figure 3.9 Vertical Stress Trajectories; Panel Moving Towards Goaf
(
Figure 3.10 Vertical Stress Trajectories; Panel Moving Away from GoafFigure 3.11 Features of a Full Column Grouted Steel Rock Bolt
Figure 3.12 Typical Load-Displacement Curves for Cable and Rock Bolts
Figure 3.13 Detached Block Theory
Figure 3.15 Load Characteristics of Pack Supports.
Figure 3.16 Redistribution of Stresses Around a Coal Mine Roadway.
Figure 3.17 Failure ofa Coal Mine Roadway Due to Cutter Roof
Figure 3.18 Mineralogy of UK Coal Measure Spoil
Figure 3.19 Mechanism of Deformation ofa Coal Mine Floor.
Figure 3.20 Lateral Gateroad Closure Expressed as a Percentage of the Original Width
Figure 3.21 Rib Extrusion With Layers of Different Engineering Properties
Figure 3.22 Rib Extrusion Within Homogeneous Coal Seams
Figure 3.23 Rib Extrusion Within Coal Seam Consisting of Hard and Soft Layers
Figure 4.1 Typical Stress-Strain Behavior of Intact Rock
Figure 4.2 Stress Strain Curve for a Brittle Material
Figure 4.3 Stress Strain Curve for a Elastic-Perfectly Plastic Material
Figure 4.4 Stress-Strain Curve for a Strain Hardening Material
Figure 4.5 Stress-Strain curve for a Strain Softening-Perfectly Plastic Material
Figure 4.6 Stress Conditions in a Biaxial Stress Field
Figure 4.7 Coulomb-Navier Failure Envelope
Figure 4.8 Mohr's Failure Envelope
Figure 4.9 Griffith Crack in a Biaxial Compressive Stress Field
Figure 4.10 Transition from Intact Rock to a Heavily Jointed Rock Mass With Increasing Sample Size
Figure 4.12 A Transversely Isotropic Body for Which the x,y Plane is the Plane of Isotropy
Figure 4.13 Application of Anisotropic Failure Theories to a Middle Coal Measure Laminated Siltstone
Figure 4.14 The Tunnel Rock-Load Concept ofTerzaghi
Figure 4.16 Adjustments to the RMR System for Mining
Figure 4.17 Relationship Between the Maximum Equivalent Dimension De of an
Unsupported Excavation and the 'Q'Index
Figure 4.18 Adjustment to RMR to Account for In-Situ Stress Condition
Figure 4.19 The Different Components of the Coal Mine Roof Rating
Figure 5.1 Flow Chart Illustrating Coal Mine Classification Development
Figure 5.2 Buckling by Horizontal stress
Figure 5.3 Swelling of Seatearth
Figure 5.4 Deformation Along Shear Planes
Figure 5.5 Extrusion of Seatearth into Roadway
Figure 5.6 Bearing Capacity Failure
Figure 5.7 Buckling of Roof Beds
Figure 5.8 Self Weight Bending
Figure 5.9 Shear Failure
Figure 5.10 ShearlParting Plane Failure
Figure 5.11 WedgelBlock Failure
Figure 5.12 Spalling of Coal Face
Figure 5.13 Bearing Capacity Failure
Figure 5.14 Collapse of Immediate Roof
Figure 5.15 WedgelBlock Failure
Figure 5.16 Cantilevering of Roof Beds
Figure 5.17 Tensile Cracking
Figure 5.18 Coal Cleat Dilation
Figure 5.19 Shear Failure
Figure 5.20 WedgelBlock failure
Figure 5.21 Yield Zone Development
Figure 5.23 Rock Mass Parameters Adopted Within Existing Classifications developed for Coal Mining/Coal measure Strata.
Figure 5.24 Point Load Test System
Figure 5.25 Diametrical Point Load Test
Figure 5.26 Axial Point Load Test
Figure 5.27 Point Load Lump Test
Figure 5.28 The NCB Cone Indenter
Figure 5.29 Barton's Joint Roughness Coefficient, JRC
Figure 5.30 Geodurability Classification
Figure 5.31 Cell and Specimen Assembly for Unconfined Swelling Test.
Figure 5.32 Methodology Developed to determine Maximum Importance Ratings
Figure 5.33 Linear Scales
Figure 5.34 Non-Linear Scales
Figure 5.35 Rating Scale for Unconfined Compressive Strength
Figure 5.36 Rating Scale for Joint/Cleat Spacing
Figure 5.37 Rating Scale for Joint/Cleat Roughness
Figure 5.38 Rating Scale for Bedding Plane Spacing
Figure 5.39 Rating Scale for Bedding Plane Cohesion
Figure 5.40 Rating Scale for Bedding Plane Roughness
Figure 5.41 Rating Scale for Fissility
Figure 5.42 Rating Scale for Moisture Sensitivity
Figure 5.43 Adjustment Rating for Cleat/Joint Orientation in RiblPillar
Figure 5.44 Adjustment Rating for Cleat/Joint Orientation in Roof/Floor
Figure 5.45 Structure of the Coal Mine Classification System
Figure 5.46 Calculation of Rating Perpendicular to Bedding.
Figure 5.48 Coal Mine Classification Data Entry Sheet
Figure 6.1 Riccall Mine, Panel 438 Layout
Figure 6.2 Riccall Mine, Panel478 Layout
Figure 6.3 Riccall Mine, Panel 505 Layout
Figure 6.4 Primary Supports, Riccall Mine
Figure 6.5 Triaxial Envelope: Mudstone, Riccall478 Panel
Figure 6.6 Triaxial Envelope: Mudstone, Riccall 505 panel
Figure 6.7 Triaxial Envelope: Siltstone, Riccall478 panel
Figure 6.8 Triaxial Envelope: Siltstone, Riccall 505 panel
Figure 6.9 Triaxial Envelope: Laminated siltstone, Riccall478 panel
Figure 6.10 Triaxial Envelope: Sandstone, Riccall478 panel
Figure 6.11 Roof Core from the Main Gate ofPanel438 at 214 Metre Mark
Figure 6.12 Roof Core from the Main Gate ofPanel478 at 31 Metre Mark
Figure 6.13 Roof Core from the Main Gate ofPanel478 at 387 Metre Mark
Figure 6.14 Roof Core from the Main Gate ofPanel478 at 486 Metre Mark
Figure 6.15 Roof Core from the Main Gate ofPanel478 at 587 Metre Mark
Figure 6.16 Roof Core from the Main Gate of Panel 478 at 710 Metre Mark
Figure 6.17 Roof Core from the Tail Gate of Panel 505 at 353 Metre Mark
Figure 6.18 Roof Core from the Tail Gate of Panel 505 at 922 Metre Mark
Figure 6.19 Roof Core from the Main Gate of Panel 50S at 669 Metre Mark
Figure 6.20 Roof Core from the Main Gate of Panel 50S at 902 Metre Mark
Figure 6.21 Roof Core from the Main Gate of Panel 50S at 1583 Metre Mark
Figure 6.22 Daw Mill Panel 94 Layout
Figure 6.23 Generalized Lithology 90's Area
Figure 6.24 Roof Displacement, Daw Mill, 94's Coal Gate, 588 metre mark.
Figure 6.26 Failure Envelope for Sandstone/Siltstone.
Figure 6.27 Failure Envelope for the Warwickshire Thick Seam.
Figure 6.28 Geotechnical Roof Log, 94's Tail Gate, 210 Metre Mark
Figure 6.29 Rossington Mine, Panel B3 Layout
Figure 6.30 Section Close to Barnsley Seam, Finningley No.2 Borehole, Rossington
Figure 6.31 Roof Displacement, 24 Metre Mark
Figure 6.32 Roof Displacement 408 Metre Mark
Figure 6.33 Roof Displacement, 594 Metre Mark
Figure 6.34 Left Rib Displacement, 24 Metre Mark, B3's Main Gate
Figure 6.35 Right Rib Displacement, 24 Metre Mark, B3's Main Gate
Figure 6.36 Left Rib Displacement, 415 Metre Mark, B3's Main Gate
Figure 6.37 Right Rib Displacement, 415 Metre Mark, B3's Main Gate
Figure 6.38 Intact Failure Envelope for the Bamsley Coal.
Figure 6.39 Geotechnical Log for B2's Tail Gate, 865 Metre Mark.
Figure 7.1 Sequence of Calculation, Finite Difference Method
Figure 7.2 FLAC Model Components
Figure 7.3 Holling's Conceptual Classification of Modelling Problems
Figure 7.4 Spectrum of Modelling Situations
Figure 7.5 Roof Extensometer 922rnrn, Tail Gate 505 Panel, Riccall
Figure 7.6 Relationship Between Rock Mass Ratings and Deformation Modulus
(Young's Modulus
=
20 GPa)Figure 7.7 FLAC's Cable Bolt Parameters
Figure 7.8 Schematic of the Finite Difference Grid Used in the Modelling of Coal
Mine Gateroads
Figure 7.9 Comparison Between FLAC Prediction and Monitored Roof Displacement at 922 Metre Mark, 505 Panel, Riccall
Figure 7.10 Comparison Between FLAC Prediction and Monitored Roof
Figure 7.11 Comparison Between FLAC Prediction and Monitored Roof Displacement at 110 Metre Mark, Main Gate of 478 Panel, Riccall
Figure 7.12 Comparison Between FLAC Prediction and Monitored Roof Displacement at 387 Metre Mark, Main Gate of 478 Panel, Riccall
Figure 7.13 Comparison Between FLAC Prediction and Monitored Roof Displacement at 486 Metre Mark, Main Gate of 478 Panel, Riccall
Figure 7.14 Comparison Between FLAC Prediction and Monitored Roof Displacement at 587 Metre Mark, Main Gate of 478 Panel, Riccall
Figure 7.15 Comparison Between FLAC Prediction and Monitored Roof Displacement at 710 Metre Mark, Main Gate of 478 Panel, Ricca11
Figure 7.16 Comparison Between FLAC Prediction and Monitored Roof Displacement at 353 Metre Mark, Tail Gate of 505 Panel, Riccall
Figure 7.17 Comparison Between FLAC Prediction and Monitored Roof Displacement at 669 Metre Mark, Main Gate of 505 Panel, Riccall
Figure 7.18 Comparison Between FLAC Prediction and Monitored Roof Displacement at 902 Metre Mark, Main Gate of 505 Panel, Riccall
Figure 7.19 Comparison Between FLAC Prediction and Monitored Roof Displacement at 1583 Metre Mark, Main Gate of 505 Panel, Riccall
Figure 7.20 Comparison Between FLAC Prediction and Monitored Roof Displacement: Coal Gate of 94 Panel, Daw Mill
Figure 7.21 Roof Displacement of the Coal Gate of94 Panel, Daw Mill
Figure 7.22 Comparison Between FLAC Prediction and Monitored Roof Displacement at 24 Metre Mark, Main Gate, B3 Panel, Rossington
Figure 7.23 Predicted Shear Strain: 24 Metre Mark, Main Gate, B3 Panel, Rossington
Figure 7.24 Comparison Between FLAC Prediction and Monitored Roof Displacement 408 Metre Mark, Main Gate, B3 Panel, Rossington
Figure 7.25 Predicted Shear Strain:408 Metre Mark, Main Gate, B3 Panel, Rossington
Figure 7.26 Comparison Between FLAC Prediction and Monitored Roof Displacement 594 Metre Mark, Main Gate, B3 Panel, Rossington
Figure 7.27 Predicted Shear Strain:594 Metre Mark, Main Gate, B3 Panel, Rossington
Figure 7.28 Comparison Between FLAC Predictions With Different Orientation Adjustment Ratings and Monitored Rib Displacement; 24 Metre Mark, Main Gate, B3 Panel, Rossington
LIST OF TABLES
Table 2.1 Classification of Mudrocks
Table 2.2 Soft Sediment Structures
Table 4.1 Factors Influencing the Strength of Intact Rock
Table 4.2 Material Constants
Table 4.3 Material Constants for UK Coal Measure Rocks
Table 4.4 Relationship Between RMR Deformation Modulus and Poisson's Ratio
Table 4.5 m,Values for Intact Rock
Table 4.6 Coefficients of Determination Calculated for Hoek-Brown Failure Criterion
Table 4.7 Terzaghi's Recommendations of Support in Steel Arch Supported Tunnels
Table 4.8 Relationship Between RQD Index and the Engineering Quality of the Rock Mass
Table 4.9 Rock Structure Rating, Parameter A
Table 4.10 Rock Structure Rating, Parameter B
Table 4.11 Rock Structure Rating, Parameter C
Table 4.12 1976 Rock Mass Rating System
Table 4.13 1989 Rock Mass Rating System
Table 4.14 Joint Orientation Adjustment Rating
Table 4.15 Relationship Between RMR and Rock Mass Quality
Table 4.16 Stand Up Time and Rock Strength for Different Rock Classes
Table 4.17 Joint Orientation for Tunnelling
Table 4.18 Rock Mass Rating Extensions
Table 4.19 The NGI Tunnelling Quality ('Q') Index
Table 4.20 ESR Values
Table 4.21 Cavability Classification
Table 4.22 Lithological Index Classification
Table 4.24 Discontinuity Index Classification
Table 4.25 Parameter Weightings CMRS Classification
Table 4.26 Relationship Between Unit Roof Rating and Rock Class
Table 4.27 Floor Classification
Table 4.28 Stratification Parameter
Table 4.29 Adjustment for Cleat Orientation
Table 4.30 CMRR Cohesion-Roughness Rating
Table 4.31 CMRR Spacing-Persistence Rating
Table 4.32 CMRR Multiple Discontinuity Set Adjustment
Table 4.33 CMRR Strength Rating
Table 4.34 CMRR Moisture Sensitivity Rating
Table 5.1 Existing Classification Systems for Coal Mining
Table 5.2 Identified Potential Classification Parameters
Table 5.3 Final List of Classification Parameters
Table 5.4 Classification of Point Load Strength Anisotropy for Foliated Rocks
Table 5.5 Importance Ratings for Rock Mass Parameters Within Roadway Floor
Table 5.6 Importance Ratings for Rock Mass Parameters Within Roadway Roof
Table 5.7 Importance Ratings for Rock Mass Parameters Within Coal Face
Table 5.8 Importance Ratings for Rock Mass Parameters Within Rib or Coal Face
Table 5.9 Average Importance Rating for RoofIFloor
Table 5.10 Average Importance Ratings Coal PillarlRiblFace
Table 5.11 Ratings for Number of Joint Cleat Sets
Table 5.12 Ratings for Joint Persistence
Table 5.13 Ratings for Joint Dominance
Table 5.14 Ratings for Bedding Plane Topography
Table 6.1 Section of Skipwith No.1 Borehole Adjacent to the Bamsley Seam, Riccall
Table 6.2 Case Study Locations Riccall Mine
Table 6.3 In-Situ Stress Results 505 Panel Tail Gate
Table 6.4 mi Variables for Riccall Lithologies
Table 6.5 Young's Modulus for Riccall Basic Lithologies
Table 6.6 Classification Ratings for Roadway Roof, Panel438 at 214 Metre Mark
Table 6.7 Coal Mine Classification Ratings Main Gate, Panel 478 at 31 Metre Mark
Table 6.8 Coal Mine Classification Ratings Main Gate, Panel478 at 110 Metre Mark
Table 6.9 Coal Mine Classification Ratings Main Gate, Panel478 at 387 Metre Mark
Table 6.10 Coal Mine Classification Ratings, Main Gate, Panel 478, 486 Metre Mark
Table 6.11 Coal Mine Classification Ratings, Main Gate, Panel 478, 587 Metre Mark
Table 6.12 Coal Mine Classification Ratings, Main Gate, Panel 478, 710 Metre Mark
Table 6.13 Coal Mine Classification Ratings, Tail Gate, Panel 50S, 353 Metre Mark
Table 6.14 Coal Mine Classification Ratings, Tail Gate, Panel 50S, 922 Metre Mark
Table 6.15 Coal Mine Classification Ratings, Main Gate, Panel 505, 669 Metre Mark
Table 6.16 Coal Mine Classification Ratings, Main Gate, Panel 50S, 902 Metre Mark
Table 6.17 Coal Mine Classification Ratings, Main Gate, Panel 505, 1583 Metre Mark
Table 6.18 Summary of Pull Test Data for 95 Tail Gate Roof Strata
Table 6.19 In-Situ Stress Results 90's Tail Gate
Table 6.20 Coal Measure Failure Criterion Material Parameters mil and mi2
Table 6.21 Classification Ratings for Roadway Roof of the Tail Gate, Panel 94 at 210 Metre Mark
Table 6.22 In-Situ Stresses, Rossington Mine
Table 6.23 Hoek-Brown m, Parameter for Rossington Roof Strata
Table 6.24 Typical Young's Modulus of Rossington Roof Strata
Table 6.26 Estimated Classification Ratings for the Rib Side Strata (Barnsley Seam) B3 Panel, Rossington Mine
Table 7.1 Strata Properties: Immediate Roof922 Metre Mark, Tail Gate, SOS Panel,
Riccall
Table 7.2 Properties of2.4 Metres Long Steel Roof Bolts
Table 7.3 Properties of 1.8 Metres Long Rib Bolts
Table 7.4 Roof Strap Properties
Table 7.5End Plate Properties
Table 7.6 Properties of Cable Bolts
Table 7.7 Strata Properties, Roof Strata, 94 Panel, Daw Mill
Table 7.8 Roof Strata Properties, B3 Panel, Rossington
CHAPTER ONE
AN INTRODUCTION TO THE THESIS
1.1 INTRODUCTION
A rock mass represents the in-situ condition of the rock material. Rock masses are almost always ubiquitously fractured and often consist of different rock types. The complexity of the rock mass prohibits, due to expense and time, the description and analysis of each individual feature that effects the rock masses engineering behaviour.
Rock mass classifications provide an alternative method of predicting the engineering behaviour of the in-situ rock material. Such classifications are typically derived by undertaking an assessment of the relative importance, on the effect of the rock masses behaviour, of five or six parameters of the rock mass that have been identified as having the greatest influence. The relative importance of each of the parameters is normally expressed as a weighted parameter rating and a combination of the weighted parameter ratings produces a final classification value of the rock mass.
Rock mass classifications were initially developed over 50 years ago by Karl Terzaghi (1946) as a means of predicting the behaviour of rock masses within tunnelling projects. Subsequently development of many new classification systems has occurred. These classification systems have been mainly developed for and applied to tunnelling. Traditionally rock mass classifications have provided an empirical means of directly predicting support requirements and approximate stand up times of civil engineering tunnels.
Although the early rock mass classifications were utilised to determine the stand up times and support requirements of sub surface excavations, more recent developments have put increased emphasis on using rock mass classifications to estimate, more representatively, in-situ strength and stiffhess properties of the rock mass. These parameters used in conjunction with numerical modelling techniques have allowed for the development of a sophisticated methodology for determining stress and displacements within the rock masses surrounding underground excavations.
Rock mass classification principles have also been applied to other rock engineering applications such as predicting the stability of rock slopes and determining the bearing capacities of rock in foundation design. On a worldwide scale, modifications of existing classifications have allowed the application of rock mass classification techniques in the design of both hard rock mining and in 'soft rock' coal mining environments. Rock mass classifications have been developed in several countries worldwide to specifically classify coal measure strata. These classification systems have been mainly utilised to predict the roof stability and support requirements within the coal mines andincivil engineering tunnels excavated in coal measure rock.
Coal mining within the UK is characterised by the relatively weak nature of the immediate strata surrounding the coal seams and by the high in-situ stress environment due to the depth of mining and horizontal stress regime, and by the method of mining itself. It is desirable to have a dedicated classification for UK Coal Measure strata due to the distinctive characteristic features of UK Coal Measure strata that effect its deformational and strength behaviour. Typically the UK Coal Measures are characterised by a distinctive sequence of strata layers known as a cyclothem. These strata layers are often laterally extensive but vertically variable and bedding planes in between each strata layer often provides planes of weakness. The strata often contains systematic jointing perpendicular to bedding. The intact coal measure rock itself can vary between being very weak to very strong but with the majority of the strata sequence typically being weak to moderately weak in strength. Due to the characteristics of the cyclothem the weakest strata frequently occurs immediately above and below the coal horizons.
The UK coal industry in the last fifteen years has endured rapid rationalisation and restructuring. The highly competitive world market for coal and the reduced home market associated with the electricity generating industry, has meant that the remaining major coal producing mines within the UK are fewer but must be high production units. To be economically viable these units must have longwalls that allow the rapid production of coal without interruption. This has triggered the need for improved ground control within the roadways and faces of the mine with reduced costs. As a response to this requirement advanced rockbolting practices have been introduced, mainly replacing free standing supports with roof, rib and cable bolts in
gate roads. This new technology has allowed the rapid development of roadways and reduced the considerable cost of the supports and their installation. Although this new technology has brought about savings in money and time it has also brought about the need for detailed design and monitoring of the installed supports.
This fact has been recognised by the Health and Safety Executive (HSE) and new regulations relating to the control of Ground Movement within mines have been constructed to incorporate safe practice associated with the new mining technology. These new regulations were due to come into enforcement towards the end of 1999 and at the time of writing this thesis were provided as guideline recommendations. These regulations will place a duty of the manager of every mine to ensure that such ground control measures are taken as may be necessary for keeping every road, drive and place in a mine secure. The HSE regulations will state that in order to ensure the security of a mine a geotechnical assessment must be initially undertaken. The geotechnical assessment is a type of risk assessment and the new regulations require that a suitable geotechnical assessment is undertaken before commencing any new roadway or place of work. The regulations will specifically state that where rockbolts are to be used in the relatively weak or variable ground found in coal mining the assessment will need to be suitably detailed and technical.
At the present time the geotechnical assessment is normally undertaken by either the mines own geotechnical staff or by independent consultants commissioned by the mine. The assessments are normally based on geotechnical logs of rock cores of the immediate roof taken at regular intervals along the mines roadways. Intact samples from the rock cores are often taken to determine the strength and deformation properties of the intact strata. The geotechnical assessment may also included in-situ stress measurements. However as was found during research for this thesis the assessment lacked structural data such as joint orientation, which have been identified to have a significant effect on the strata behaviour.
The HSE regulations will state that once the geotechnical assessment has been completed then the next step is to consider the design of the ground control measures in the area to be worked and specifically for rock bolting roadways this design should include monitoring of strata deformations.
At the present time this design process is undertaken using both knowledge of the required reinforcement used previously in conditions similar to the expectant prevailing conditions and the utilisation of semi-analytic predictive techniques such as numerical modelling. Numerical modelling techniques however require a wide range of parameters that represent the in-situ stress conditions, shape of excavation, installed supports and the material properties of the rock strata. Quantification of these parameters is often difficult and there is at present a large degree of uncertainty in relation to some of the required parameter values. This is especially true of the strata properties as there are many influencing factors on the strata behaviour such as degree of jointing and strength of bedding. Due to the uncertainty in the accuracy of the input parameters of numerical models the models parameters are usually adjusted to fit measurements taken for the existing excavations they are modelling. These calibrated models are then developed for a region within a mine and also utilized as a basis for parametric studies undertaken as an aid to judging support requirements within that region. However there are several limitations with this method of back analysis. These include the fact that different combinations of input parameters can give very similar deformation results, which may therefore produce incorrect predictions when applied to a different area. Models constructed using this method may only be utilised for the conditions which it has been calibrated which restricts its application of use. A methodology that allows more realistic input parameters to be predicted is more desirable as a universal method of numerical modelling. To characterise the rock strata in terms of its fabric and structure and through a systematic process develop this into the representative predicted strength and stiffness parameters is more desirable, and would allow a true predictive approach to numerical modelling of coal mine roadways.
1.2 OBJECTIVES OF THE THESIS
The main objectives of this thesis is to develop a methodology of classifying the Carboniferous Coal Measure strata typically encountered within UK coal mines such that the output of the classification can be used to determine the strength and stiffness properties of the strata. These parameters can then be used within numerical models to allow the strata behaviour within coal mine roadways to be predicted and to allow a predictive method for the design of support requirements.
The development of such a classification requires a clear understanding of the lithological nature and characteristic structural features of the U.K. Coal Measures. Chapter 2 aims to review the lithological and structural characteristic features of UK Coal Measures and describes their modes of formation and the mechanism of development of the structures typically found within coal measure rock masses. Currently coal mining in the UK takes place at depths of between, approximately, 600m to IOOOm.The in-situ stress fields at these depths has a large affect on the deformation behaviour of the strata. An understanding of the in-situ stress fields is required and has been reviewed in Chapter 2.
Chapter 3 focuses on the typical features of UK coal mining. Stress redistribution around longwall panels is described and roadway and gateroad stabilisation techniques are detailed. Important in determining which parameters have the greatest effect on strata behaviour is an understanding of the characteristic strata deformation mechanisms that occur in UK coal mines. Typical mechanisms of deformation are described in Chapter 3.
Chapter 4 aims to describe the mechanical behaviour of intact and rock masses and reviews methods used to define their mechanical properties. This chapter also reviews existing rock mass classification techniques with a special emphasis on those classifications that have been developed worldwide for the characterisation of rock strata within coal mining environments.
Chapter 5 details the actual development of a rock mass classification for use in UK coal mine design. This chapter describes the determination of the influencing factors on the rock strata and the development of initial weightings for the influencing factors. Practical means of quantification of the parameters are given and the final structure of the classification and the incorporation of anisotropy into the classification are described.
Chapter 6 describes the application of the Coal Mine Classification to sites at three different UK coal mines to allow case studies to be undertaken to evaluate the
efficacy of the Coal Mine Classification in predicting the strength and stiffness parameters of the in-situ rock strata.
Chapter 7 details the numerical modelling of the case study localities described in Chapter 6. Within· this chapter strata modelling techniques are reviewed and modelling methodologies utilised within rock engineering are described. The results of the extensive numerical modelling programme using the FLAC finite difference code of each of the case study localities described within Chapter 6 are presented and compared to actual in-situ monitoring data for validation. This allows initial conclusions to be drawn on the effectiveness of the Coal Mine Classification in determining the in-situ strata properties.
Finally Chapter 8 draws general conclusions on the research work described in this thesis and gives recommendations for future work to progress this field of research.
CHAPTER2
GEOLOGY OF THE UNITED KINGDOM COAL MEASURES
2.1 GENERAL STRATIGRAPHY 2.1.1 Introduction
During the Carboniferous period the British Isles formed part of the southern edge of
a landmass known as the Old Red Sandstone Continent. This continent encompassed
areas of Northwest Europe, Greenland and the Eastern Seaboard of Canada and the
United States of America. A marine transgression during lower Carboniferous times
(Dinantian) flooded the margins of the Old Red Sandstone Continent and a block and
basin system developed with extensive carbonate deposition occurring in the marine
basins. During late Lower Carboniferous times a major phase of uplift occurred which
lead to the development of extensive river systems draining off the land mass areas
into the basins. The river systems drained mainly from sources in the Northern
landmass, but also from an upland area passing through Central England known as St.
George's Land or the Wales-Brabant Landmass (Williamson 1967, Anderton et al
1979) (Figure 2.1).
Figure 2.1. Westphalian paleogeography of the United Kingd m
The river systems spread into the basins depositing a large thickness of coarse angular sandstone to form extensive deltas on the margins of the landmasses. By Upper Carboniferous times (Westphalian) subaerialy exposed deltaic plains covered much of the British Isles.
2.1.2 Depositional Environments Of The UK Coal Measures
The UK Coal Measures have been interpreted as representing the product of delta top environments (Williamson 1967). Enormous low lying fluvio-deltaic plains layover much of the United Kingdom during the Westphalian stage. At this time the United Kingdom was situated at a latitude of approximately 10° south of the Equator and experienced a tropical climate (Fookes 1998). The delta tops for the majority of the Westphalian were sub-aerialy exposed, however marine incursions occurred with some nineteen widespread examples known (Anderton et al 1979). The large lateral extent of these marine incursions indicate a uniformity in the depositional levels on the delta tops. The environments on the delta tops consisted of rivers, peat swamps and lagoons (Anderton et al 1979). It is also conjectured by Williamson (1967) that low sand barriers may have separated lagoonal areas from the open sea. The depositional process that occurred on the delta tops can be inferred from the cyclic nature of sections through coal measure rocks. The clastic facies can be divided into upward coarsening and upward fining units. Typically upward coarsening units are between two to thirty metres in thickness
The complete sequence is as follows: -Coal
Seatearths
Fine and medium grained cross-stratified sandstones Flaggy sandstones
Alternating thin sandstones and siltstones Siltstones
Shales and mudstones
Only very rarely is this complete sequence present. This sequence is known as a cyclothem and represents a phase of subsidence of the delta top leading to the flooding and formation of delta top lakes. Rivers on the delta top drained into the general lake body leading to the deposition of successive argillaceous and arenaceous
beds until the surface was built up above the water level and allowed vegetation to form (Moore 1958, Reading 1982).
Upward fining units are also present within Coal Measure sequences. These units are normally sharped based, lenticular in section and ribbon shaped in plan. They are normally arenaceous, show cross stratification and are between 1 to 20 metres in thickness. They are considered to be of fluvial origin formed by the deposition of sands within a migrating delta distributary channels and with the finer grained argillaceous section representing flood plain deposition (Reading 1982).
2.1.2.1 Sedimentary Province
The presence of two separate landmasses led to the formation of three different sedimentary provinces (Williamson 1967).
Southern Province South Wales, Forest of Dean, Somerset and Kent Midland Province Lancashire, North Wales, Yorkshire, Nottinghamshire,
Derbyshire, Leicestershire, Staffordshire, Shropshire and Warwickshire
Northern Province Cumberland, Durham, Northumberland and Scotland.
Within each province the coal seams form at similar stratigraphic levels and can often be correlated across the province. The degree of subsidence associated with the delta tops is illustrated by the fact that 1060 metres of coal measures are preserved in the Midland Valley of Scotland, 3050 metres in the Lancashire- North Staffordshire area, 2440 metres in South Wales and 60 metres in Kent (Anderton et aI1979).
2.2 DIAGENESIS 2.2.1 Introduction
Diagenesis can be defined as the changes which occur in the character and composition of sediments beginning from the moment of deposition and lasting until the resulting rocks are either moved into the realm of metamorphism or become exposed to the effects of atmospheric weathering (Larsen and Chilingar 1979). Tucker (1981) stated that the diagenetic processes are compaction, recrystallisation, dissolution, replacement, authigenesis (precipitation of new minerals within pore spaces) and cementation. More limited definitions of diagenesis exist for instance
Selley (1982) in his study of sandstone lithification used the definition that diagenesis refers to chemical processes that take place between mineral grains or between mineral grain and the pore fluids. This essentially eliminates physical processes such as compaction, which is the dominant lithification process within certain rock types. Larsen and Chilingar (1979) using diagenesis defined in its broadest sense stated that diagenesis of sediments can be broken down into three general stages. The earliest stage occurs within the layer of recently deposited sediment within an oxidising or reducing environment (Selley 1982). It has been found that in sediments within a normal oxygen regime that this layer is approximately 100-150 mm thick, but in an oxygen deficient depositional environment this layer is only a few cm thick or is completely absent (Larsen and Chilingar 1979). This stage is dominated by oxidation and reduction reactions and bacterial activity. These processes have the effect of reducing pore water pH and the production of early diagenetic material such as iron sulphide and the solution of certain minerals such as silica and carbonates into the pore water. The second stage commenced with the termination of bacterial activity. This stage is characterised by the formation of local cementation and concretions. The third stage of diagenesis involved compaction of sediments by the squeezing out of pore water due to the weight of the overlying sediments and extensive cementation of the sediments by precipitation of minerals out of migrating pore water solutions. This stage unlike the previous two stages can operate down to a great depth (for example 10 km) and over a long period of time (100 million years). Pressure and temperature are the controlling factors, with the pressure of the overlying sediments resulting in compaction and simultaneous expulsion of pore fluids, This in tum leads to a large scale migration of pore fluids through the sequence. These migrating fluids may have reacted chemically .with the sediments and rocks resulting in either dissolution or precipitation of various minerals. With increasing depth and hence pressure the pore volume is reduced to a point where pore connections are closed. The closure of these pore connections effectively ends the diagenetic processes and demarks the boundary between diagenesis and metamorphism.
2.2.2 Diagenesis Of Sandstones
The processes of diagenesis and the resulting characteristics of the lithified sandstones are dependent on the particle size distribution of the original sediment and the percentage of clay mineral present. Two categories of sandstone can be identified which have undergone very different diagenetic processes and produce rock types of
different engineering properties. The types are identified as those, which have a large percentage of clay minerals, and those that have a narrow range of sand sized particles. The first type tend to be matrix supported and are called wackes whilst the latter tend to be grain supported and are called arenites.
Within the wacke framework lithification occurs generally by the binding of sand grains by the clay minerals. Overburden pressure squeezes out water from the pores and from the clay mineral crystal matrix framework. The reduction in water content of clay minerals increases the bond strength leading to lithification of the sediment. Such a rock, however, if immersed in water, some of the water would be adsorbed by osmosis into the clay minerals crystal structure. This process increases the spacing of the clay minerals lattice and reduces the strength. This eventually leads to the breakdown of the clay bond and disintegration of the rock. However other cement bonds exist in wacke sandstones that prevent the complete disintegration of the sandstone into a soil. Hydration structures can develop on the surfaces of quartz grains. This hydrated silica layer approximates to a clay mineral structure thus allowing the hydrated outer surfaces of clay minerals to become orientated on the surface of a quartz grain in the form of a lattice intergrowth. This effectively welds the clay mineral to the surface of the quartz grain. The transition from the simple clay bond to the quartz-clay intergrowth is a progressive change due to diagenetic modification (Larsen and Chilingar 1979).
Different processes are involved in the diagenesis of grain supported arenite sandstones. As for the wacke sandstones the initial stages of compaction, dewatering and local cementation are present. However large pore spaces free of clay minerals allow the precipitation and cystallisation of mineral cement. The most common mineral cements are silica, calcite, dolomite, siderite, iron oxides, anhydrite and gypsum. The type of mineral cement precipitated is dependant on both the initial composition of the sediment and the origin of the pore water as this affects the EH, pH and mineral content of water (Selley 1982).
Cements found in arenite sandstones may be termed compatible or incompatible. Compatible cements are in crystallographic continuity to the crystal lattice of the grains and are usually formed when the cementing agent is of the same mineral composition as the grain, for instance quartz grains and silica cement. These cements
may form strong welded boundaries between adjacent gram cements, however pressure solution between the cement boundaries may lead to weaker interpenetrated or stylotic (sharply undulating) grain boundaries (Tucker 1981). Non compatible cements are usually of a different mineral composition than the grain. A sharp discordant crystallographic boundary exists between the grain and the cement and acts as a cementing agent by surrounding the grains (Larsen and Chilingar 1979).
2.2.3 Diagenesis Of Mudrocks
Diagenesis of the finer grained clay rich argillaceous rocks is dominated by compaction through overburden pressure and associated expulsion of pore water. Upon deposition argillaceous sediments contain between 50 to 90 % water (Tucker 1981, Selley 1982). Compaction soon removes most of the water so that at depths of 1 km or so mudrocks contains 30% water, much of which is contained within the clay minerals crystal lattice as interlayer water. Further compaction through water loss requires temperatures approaching 100°C and these are typically obtained through burial between 2 to 4 km depth. Compaction to give a mudrock with only a few percent water requires a much longer period of overburden pressure and raised temperature (Figure 2.2). 80 o %water in sediment 20 40 60 ..."', ...• ... _ ...--..4 ..._--..__s~trfACesediment stage A: expulsion of excess oorewarer depth:l·-1Y, km stage B: zone of stability. little loss of water stage C: loss of interlayer water depth' 2 ..·4 km
1
staue D. deepburial water loss
J
Figure 2.2. Progressive compaction of mudrocks with depth (after Tucker 1981)
inter-(i; layer .;:: water '::J ..0 (5 .C 0.. ." "0
A manifestation of the deposition and compaction of argillaceous deposits is the
preferred orientation of the clay mineral particles. Clay minerals are plate like
structures. On deposition they may flocculate to form peds of roughly orientated clay
particles or dispersion may occur to form randomly oriented deposits. Compaction
and associated dewatering also produces a parallel alignment of the clay minerals
(Bell 1986). Alteration of the clay mineralogy during diagenesis takes place due to
temperature increases associated with depth of burial. The main change that occurs is
an alteration of montmorillonite to illite via a mixed layer illite-montmorillonite stage.
The temperature where montmorillonite disappears is approximately 70 to 95°C Le. 2
to 3 km depths. At greater depths and higher temperatures kaolinite is replaced by
illite and chlorite (Tucker 1981).
2.3 TECTONIC EVENTS
In the subsequent 300 million years since their deposition, the Carboniferous Coal
Measures have been subjected to phases of both compression and tensional stress of
tectonic origin that have folded and faulted them (Anderton 1979 et a1). The Coal
Measures were deposited during a time of intensive tectonic activity known as the
Hercynian Orogeny. This Orogeny is associated with the closure of an ocean (Rheic
Ocean) that separated the super continents of Eurasia (Europe, North America and
Asia) and Gondwanaland (Africa, Australia and South America). Such orogenic
events tend to generate compressive stresses within the Earth's crust. Three phases of
tectonic activity are associated with this orogeny with the final phase occurring during
the end of the Carboniferous thus affecting the newly deposited Westphalian Coal
Measures. This phase caused extensive folding and thrusting especially in the South
West of England, where the thrust front is conjectured to have existed. Immediately to
the north of the thrust front, basinal Carboniferous successions are now much folded
and deformed into upright folds due to the effect of this orogeny. The large degree of
faulting and folding of the South Wales Coal Measure province is due to the phase of
compression. Further to the north, block and basin successions formed with the
underlying shallow rigid granite basement cushioning and protecting them from the
full effect of the orogeny. The block and basin structure was developed along
pre-existing normal faults and were only gently tilted. Other major structures in the Coal
the South Wales Syncline. Although east-west compression produced the major Pennines structure, the local interplay of blocks and basins further to the north gave rise to many local variations of fold and fault structures within this region.
Early Jurassic times marked the opening of the Central Atlantic. This event was associated with crustal tension in North West Europe. The Paleozoic floor already possessed its own structural grain and movements along these ancient lines were triggered by the tensional stresses. Tensional rifting and associated uplifting of the central North Sea basin also occurred at approximately this time. Stratigraphical, sedimentological and igneous evidence suggest that periodically, since the opening of the North Atlantic, sectors of the European lithosphere have been locally upwarped eg North Sea (Hallam & Sellwood 1976). Tensile stress and the downward propagation of normal faults would have accompanied these movements.
A new cycle of uplifting and rifting west of Britain is postulated to have occurred in the early Cretaceous. Periodic and local upwarping of the lithosphere was accompanied by tension and occasionally volcanism. Active sea floor spreading of the North Atlantic began in the late Cretaceous and continues to the present day. Evidence of the tensional stresses associated can be seen in the Northern Ireland -Hebrides region. Here plateau lava lie in shallow folded basins associated major faults that represent reactivated ancient structures. This lava, and also a wider belt of dykes also of tertiary age with a north west to south east trend, indicate a major tensional phase with stresses operating in a north east to south west direction (i.e. oblique to the Atlantic-Continental margin). Much of the British Isles became land during the earliest Tertiary and Britain began to assume its present tectonic style with uplift in the north west and subsidence in the south east.
As the Atlantic opened the southern European Ocean separating Europe from Africa, known as the Tethys, closed. The compression associated with this tectonic event culminated in the main alpine orogeny. In southern alpine Europe the tensional regime that had typified most of the period subsequent to the Carboniferous was replaced by a phase of compression. The Tethys began to narrow, as its oceanic crust was subducted. The Alps and Carpathian Chains are believed to represent the remains of the peripheral mobile belt that existed on the border of the margin of the European continent. The presence of these compression forces within the British Isles can be
illustrated by the rejuvenation of existing Paleozoic structures. For instance the
Sticklepath-Lustleigh dextral wrench fault, which exists in the Bristol Bay area.
Reactivation of this fault during the Oligocene generated approximately 30 km of
movement within the South West of England (Anderton et aI1979).
2.4 UK COAL MEASURES ROCK TYPES
The UK Coal Measures mainly comprise of terrigenous clastic sedimentary rocks
(rocks comprised of grains or clasts derived from pre-existing rocks). Such rocks are
elassified in terms of their grain size and vary in the Coal Measures from coarse
grained sandstone to finer grained mudrocks. Coal itself is predominantly non-elastic
and is organic in origin. Inter-lamination of one rock type with another and the lack of
distinct lithological boundaries, when one rock type grades imperceptibly with
another can create problems in the lithological identification of strata units in Coal
Measure sequences (Williamson 1967).
2.4.1 Sandstones
Sandstones can be defined very broadly as sedimentary rocks where greater than 50%
of the grains are between 0.06mm and 2mm in diameter (BS5930 Site Investigations
1981). Sandstones can be classified as being fine, medium or coarse grained where
the sand sized grains are predominantly less than 0.2mm, between 0.2mm and 0.6mm
and predominantly greater than 0.6mm respectively. Mineralogically sandstones are
usually comprised of sub-angular quartz grains with small amounts of feldspar and
mica. There are various types of cement; common cements are silica, calcite, iron
compounds or clay minerals. The sandstone structure and the cement type has an
important influence on the sandstone strength, for example silica cements in arenites
can produce very strong rock types as in the case of the Pennant Sandstone of the
South Wales coalfield. Those sandstones with a high percentage of clay mineral
matrix may be weak or very sensitive to moisture content (Hawkins and McConnell
1992). Sandstones vary from being thinly bedded to massive and may display a
variety of internal structures including cross and graded bedding.
2.4.2 Mudrocks
These are the lithic rock types where at least 50 percent of the grains are smaller than
0.06 mm (BS5930 Site Investigations 1981). Mudrocks encompass the siltstones and