Available at https://jtsiskom.undip.ac.id (3 October 2019)
DOI:10.14710/jtsiskom.7.4.2019.121-126 Jurnal Teknologi dan Sistem Komputer, 7(4), 2019, 121-126
Parameter tuning in KNN for software defect prediction: an empirical
analysis
Modinat Abolore Mabayoje1), Abdullateef Oluwagbemiga Balogun*,1), Hajarah Afor Jibril1), Jelili Olaniyi Atoyebi2) , Hammed Adeleye Mojeed1) , Victor Elijah Adeyemo1)
1)Department of Computer Science, University of Ilorin
PMB 1515 Ilorin, Nigeria
2)Department of Computer Science and Engineering, Obafemi Awolowo University
220005 Ile-Ife, State of Osun, Nigeria
How to cite: M. A. Mabayoje, A. O. Balogun, H. A. Jibril, J. O. Atoyebi, H. A. Mojeed, and V. E. Adeyemo, "Parameter tuning in KNN for software defect prediction: an empirical analysis," Jurnal Teknologi dan Sistem Komputer, vol. 7 no. 4, pp. 121-126, 2019. doi: 10.14710/jtsiskom.7.4.2019.121-126, [Online].
Abstract – Software Defect Prediction (SDP) provides insights that can help software teams to allocate their limited resources in developing software systems. It predicts likely defective modules and helps avoid pitfalls that are associated with such modules. However, these insights may be inaccurate and unreliable if parameters of SDP models are not taken into consideration. In this study, the effect of parameter tuning on the k nearest neighbor (k-NN) in SDP was investigated. More specifically, the impact of varying and selecting optimal k value, the influence of distance weighting and the impact of distance functions on k-NN. An experiment was designed to investigate this problem in SDP over 6 software defect datasets. The experimental results revealed that k value should be greater than 1 (default) as the average RMSE values of k-NN when k>1(0.2727) is less than when k=1(default) (0.3296). In addition, the predictive performance of k-NN with distance weighing improved by 8.82% and 1.7% based on AUC and accuracy respectively. In terms of the distance function, kNN models based on Dilca distance function performed better than the Euclidean distance function (default distance function). Hence, we conclude that parameter tuning has a positive effect on the predictive performance of k-NN in SDP.
Keywords – software defect prediction; parameter tuning; k-nearest neighbor; distance function; distance weighting
I. INTRODUCTION
Software Defect Prediction (SDP) entails the identification or prediction of defect-prone software modules which in turn helps software engineers to prioritize the usage of limited resources during testing or maintenance phases in the SDLC [1], [2]. Therefore, the software quality and reliability are guaranteed [3], [4]. Software source code complexity, software metrics,
and software development history are the information that serves as the features used by SDP models for the prediction of defective software modules [5]-[7]. Engineered software metrics such as McCabe and Halstead Metrics, Procedural Metrics, etc. are used to determine the quality and reliability level of a software system [5], [8]. Each software module or component is characterized by a set of metrics and a class label. The class label indicates the state of a module, whether it is defective or non-defective, and the derived metric values are used to build SDP models [9]-[11]. SDP utilizes historical data mined from software repositories to determine the quality and reliability of software modules for software quality assurance [12], [13].
Machine learning methods are the most common and widely used method for SDP [14]. Data-driven SDP generally relies on machine learning techniques, most of which have several parameters that can be adjusted to optimize the algorithm [15], [16]. Most machine learning algorithms have a default set of parameters that are chosen or set by default to reflect the best setting for general performance [17]. However, these default settings may not give the best results in all cases, and the optimal parameter settings are not known in advance [15]. The practice of choosing parameters that leads to increased performance within a particular domain or when applied to a particular type of data is known as parameter tuning.
Jiang et al. [18] and Tosun and Bener [19] in their respective works reported that Random Forest and Naïve Bayes would give a sub-optimal performance with default parameter settings. Koru and Liu [20] and Mende [21] also showed that tuning parameter settings of SDP models affect its performance. Also, Hall et al. [22] showed that the use of default parameters in unstable classification techniques leads to its underperformance. All those mentioned above made it imperative to investigate the impact of parameter tuning in SDP.
It is unknown the effects of parameter tuning on the performance of classifiers in SDP, as many studies seem to make an implicit assumption on the parameter setting *) Correspondence author (A. O. Balogun)
by using default values [15], [23]-[25]. Findings from this study will help researchers in deciding and setting the appropriate parameters for selected predictive models in their research that will give better and consistent predictive results irrespective of the tool used for the analysis.
The attention of researchers has been drawn to parameter settings of prediction models in SDP. For example, Koru and Liu [20] and Mende [21], in their works, posited that using different parameter settings than the default settings has a positive effect on the performance of SDP prediction models. Tosun and Bener [19], in their respective studies, also mentioned that the default parameter usage of machine learning tools such as R, Weka, Scikit-learn, and Matlab are sub-optimal. It has also been reported that SDP models may under-perform when sub-optimal parameters are used.
However, determining the optimal and suboptimal parameter settings is a challenge as most SDP models have many parameters [26]-[28]. It makes many empirical studies of SDP to settle for default parameter settings. For example, Mende [21] implemented random forest using the R package with the default number of decision trees as its parameter setting. Jiang et al. [18] and Bibi et al. [29] also used the default value of the k-nearest neighbors’ classification technique (k = 1). Also, the implementations of classification techniques that are provided by different research toolkits often use different default settings. As a result of different parameter settings across machine learning tools, this may affect the SDP researches [30].
Recent researches have looked into the knowledge transfer mechanism of using parameter settings of prediction models with good performance on a particular dataset to another dataset. As a reference, Tan et al. [31] experimented and explored different parameter settings for Alternating Decision Tree (ADTree). The goal was to identify the optimal parameter setting and apply it to other datasets. Jiang et al. [18] also did the same on Multivariate Adaptive Regression Splines (MARS) with various parameter settings on one dataset. With those mentioned above, the applicability issue of using parameter settings across datasets is still not clear as several other factors, such as data quality problems can set in. However, determining and adapting optimal parameter settings of prediction models across datasets without depletion in predictive performance will be of benefit against automated parameter optimization.
Therefore, this study aims to investigate the parameter tuning of Instance-Based Learning (IBK) algorithm, more specifically k-Nearest Neighbor (k-NN), as it has been widely used in SDP [15], [23], [24], [26]. The parameter tuning is based on determining the optimal number of neighbors, best distance function, and applicability of distance weighting. Disjoint k-NN models were developed using default and optimal k values, different distance weighting methods, and different distance functions. The respective models were used on six software defects dataset from the NASA
repository, and their predictive performances were measured comparatively analyzed. The experimental results showed that parameter tuning with respect to k value, distance function, and distance weighting options in k-NN has a positive effect on its predictive performance.
II. RESEARCHMETHODS
This study is aimed at investigating and evaluating the impact of parameter tuning of k-NN for SDP. A. Experimental framework
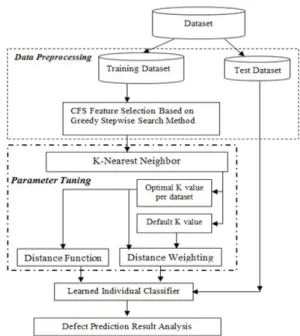
As depicted in Figure 1, the experimental framework of this study makes use of datasets which were divided into training and test sets based on 10-fold cross-validation, a process of dividing a given dataset into 10 subsets, in which 9 subsets are used for training and the remaining one subset is used for testing the developed model, iteratively for ten times until all subsets are used as test set and results are averaged. Moreover, the phase of data pre-processing saw the selection of relevant and useful features among the features of the given dataset through the usage of the Correlation Feature Selection (CFS) technique, which was based on greedy-stepwise search method.
The k-NN algorithm was implemented, and the search for the optimal k value for each dataset was carried out, both with the optimal k value and the default parameter values for k-NN. Disjoint experiments were carried out to reveal the effect of implementing different distance weighting methods. With the optimal k value, different experiments were carried by implementing different distance functions of k-NN, and thus the impact of the distance functions was evaluated. The performances of all developed models, using default and optimal k values, different distance weighting methods, and different distance functions
were all measured, and the impact of parameter tuning was analyzed.
B. Datasets
The datasets used in this study are five public-domain software defect datasets provided by the National Aeronautics Space Administration (NASA) repository. The datasets used in this study are KC1, KC2, KC3, MW1, PC2, and PC4. A brief description of these datasets is provided in Table 1.
C. K nearest neighbor (KNN)
Instance Base Learner (IBL) or k-Nearest Neighbor classifies instances based on similarities. It is a type of lazy learning method where the function is only approximated locally, and all computation is deferred until classification [32]. An object is classified by a majority of its neighbors. The k is always a positive integer. The neighbors are selected from a set of objects for which the correct classification is known. Whenever there is a need for a new point to classify, its k nearest neighbors from the training data are used in determining the class of its replica in the test set [33]. Algorithm 1 presents the algorithm for k-NN.
D. Performance metrics
The metrics used in this study to evaluate the performance of a classifier model are accuracy (Eq. 1), precision (Eq. 2), recall (Eq. 3), area under curve /AUC which shows the tradeoff between TP rate and FP rate, and f-measure (Eq. 4) [35]. The metric values were all computed using the statistical values of True Positive (TP), True Negative (TN), False Positive (FP), and False Negative (FN). Accuracy= TP+TN TP+FP+FN+TN (1) Precision= TP TP+FP (2) Recall= TP TP+FN (3) FMeasure=2×Precision×Recall
Precision+Recall (4) III. RESULTSANDDISCUSSIONS
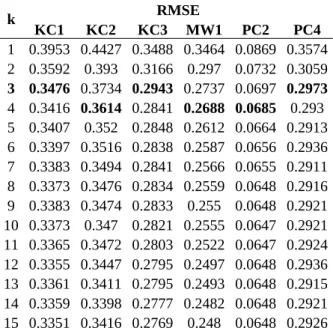
Tables 2 presents the optimal k values for k-NN using the elbow method. From studies, it has been gathered that obtaining the optimal k value for instance of base learners depends on the nature of the dataset [36], [37]. Elbow method was adopted based on Relative Mean Square Error (RMSE) for each k Value (1 to 15) [38]. As the value of k increases, the error rate goes down, then stabilizes, and then rises again. The optimum k value is at the beginning of the stable zone.
It clearly shows that using the default value of k (usually k=1) is not the appropriate or the best value in the context of SDP. Also, this finding further
strengthens the aim of this study of tuning parameters appropriately in the classification task. Respective optimal k values for the selected SDP datasets used in this study, which are k = 3 for KC1, KC3, and PC4, and k = 4 for KC2, MW1, and PC2.
Table 1. Software defect datasets
Dataset Number ofInstances Number ofAttributes Language
KC1 2109 22 C++ KC2 522 22 C++ KC3 458 40 C++ MW1 403 38 C PC2 5589 37 C++ PC4 1458 38 C++ Algorithm 1. k-NN algorithm [34] BEGIN
Build the training data set Di = { (X1, C1),..., (XN, CN)}
X = (X1,..., XN) new instance to be classified
For each labeled instance (Xi, Ci) do
If X has an unknown system call then X is abnormal;
else then
For each process Dj in training data do
calculate Sim(X, Dj);
if Sim(X, Dj) == 1.0 then
X is normal and exit;
Order Sim(X, Di) from Lowest to highest, (i = 1,...,N);
Find K biggest scores of Sim(X, D); Select the K nearest instances to X: DK
X;
Assign to x the most frequent class in DK X;
Calculate Sim_Avg for k-nearest neighbours; If Sim_Avg > threshold then
X is normal; else then X is abnormal; Return X;
END
Table 2. The RMSE values of different k values on KC1, KC2, KC3, MW1, PC2, and PC4 datasets k RMSE KC1 KC2 KC3 MW1 PC2 PC4 1 0.3953 0.4427 0.3488 0.3464 0.0869 0.3574 2 0.3592 0.393 0.3166 0.297 0.0732 0.3059 3 0.3476 0.3734 0.2943 0.2737 0.0697 0.2973 4 0.3416 0.3614 0.2841 0.2688 0.0685 0.293 5 0.3407 0.352 0.2848 0.2612 0.0664 0.2913 6 0.3397 0.3516 0.2838 0.2587 0.0656 0.2936 7 0.3383 0.3494 0.2841 0.2566 0.0655 0.2911 8 0.3373 0.3476 0.2834 0.2559 0.0648 0.2916 9 0.3383 0.3474 0.2833 0.255 0.0648 0.2921 10 0.3373 0.347 0.2821 0.2555 0.0647 0.2921 11 0.3365 0.3472 0.2803 0.2522 0.0647 0.2924 12 0.3355 0.3447 0.2795 0.2497 0.0648 0.2936 13 0.3361 0.3411 0.2795 0.2493 0.0648 0.2915 14 0.3359 0.3398 0.2777 0.2482 0.0648 0.2921 15 0.3351 0.3416 0.2769 0.248 0.0648 0.2926
In revealing the impact of tuning the distance weight parameter, various methods of distance weighting (DW) were carried out, which are no distance weight (No DW) as default, 1/DW , and 1−DW . These methods of distance weighting were also experimented using the default k-value and the optimal k value of the k-NN algorithm. Tables 3 and 4 depict the results for these experiments as measured using the performance metrics. In Table 3, the average performance evaluation of k -NN with default (k = 1) based on different metrics (accuracy, precision, recall, f-measure, and Area Under Curve) is presented. The essence of this analysis is to further evaluate the effect of tuning k-NN’s distance weighting function. With or without tuning the distance weighting parameters, the same results were observed in terms of the average accuracy, average precision, average recall, and average f-measure. In contrast, the value of the AUC varies as k = 1 with 1/DW and 1−DW gave better AUC values of 0.715 and 0.718 respectively againstNoDW of 0.618.
Further analyses were carried out to investigate the effect of distance weighting on respective optimal k values. As shown in Table 6, with optimal k value from Table 4, distance weighting ( 1/DW and 1−DW ) had a good effect on the optimal k values with an average accuracy of 86.06% and 86.65% against 85.13%. There was also a significant increase in the average recall, average f-measure, and average AUC values, as presented in Table 4.
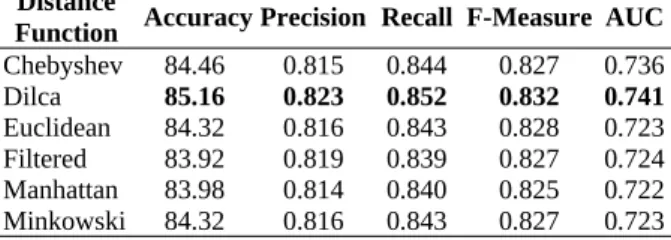
Table 5 shows the results of the average performance evaluation of k-NN distance function techniques. By default, the Euclidean distance is used, but from analysis, it was discovered that there are other distance functions that can do better than Euclidean distance. Dilca distance had the best average accuracy (85.16%), best average precision (0.823), average recall (0.852), average F-measure (0.832), and the be0st AUC value (0.741) when compared with the default Euclidean distance function. Chebyshev distance function also had a good impact more than the Euclidean distance with better accuracy, recall value, and AUC. However, the Euclidean was slightly better than Chebyshev in precision and f-measure values.
It has shown that parameter tuning in k-NN had a positive effect on the performance of the classifier. The k value should not be set to default (k = 1) in the classification task as it has been proved that higher k values performed better than the default (k = 1). However, from our findings, there is no universal k value as the k value varies from dataset to dataset. Distance weighting also should be done as the k-NN classifier got better when the distance weighting options are considered and the other distance functions such as Dilca Distance and Chebyshev also gave good results when compared with default Euclidean distance.
Conclusively, k-NN parameter tuning in SDP is highly encouraged as the predictive performance of k -NN was better than using default parameter values. The findings of this study on tuning parameters of classifiers are consistent with that of Tantithamthavorn et al. [15],
and Song et al. [39] as parameter tuning has a positive impact on classifiers in SDP.
IV. CONCLUSIONS
The experimental results revealed that parameter tuning had a positive effect on the performance of k-NN in SDP. The value for k should be greater than 1 (default), distance weighting option should be used, and other distance functions can also be explored as they gave better predictive performance than k-NN with default parameters.
Even if SDP models are trained on a clean defect dataset, and their respective parameters are not tuned accordingly, SDP models may produce inaccurate performance. To this end, parameter tuning of SDP models is advised. It is also recommended that future works should look into using other classification techniques. It will enable researchers and software engineers to get the best out of classification techniques in SDP. Also, parameter tuning in the presence of data quality issues such as outliers and class imbalance can also be considered.
Table 3. Average performance evaluation of k-NN's distance weighting techniques based on different metrics using default k value (k =1)
Distance Weighting No DW 1/DW 1-DW Average Accuracy 82.05 82.05 82.05 Average Precision 0.82 0.82 0.82 Average Recall 0.82 0.82 0.82 Average F-Measure 0.82 0.82 0.82 Average AUC 0.618 0.715 0.718
Table 4. Average performance evaluation of k-NN's distance weighting techniques based on different metrics using optimal k values
Distance Weighting No DW 1/DW 1-DW Average Accuracy 85.13 86.06 86.65 Average Precision 0.83 0.83 0.83 Average Recall 0.85 0.86 0.86 Average F-Measure 0.84 0.84 0.84 Average AUC 0.68 0.74 0.74
Table 5. Average performance evaluation of k-NN's distance function techniques based on different metrics using the optimal
k
valueDistance
Function Accuracy Precision Recall F-Measure AUC
Chebyshev 84.46 0.815 0.844 0.827 0.736 Dilca 85.16 0.823 0.852 0.832 0.741 Euclidean 84.32 0.816 0.843 0.828 0.723 Filtered 83.92 0.819 0.839 0.827 0.724 Manhattan 83.98 0.814 0.840 0.825 0.722 Minkowski 84.32 0.816 0.843 0.827 0.723
REFERENCES
[1] M. M. Ali, S. Huda, J. Abawajy, S. Alyahya, H. Al-Dossari, and J. Yearwood, "A parallel framework for software defect detection and metric selection on cloud computing," Cluster Computing, vol. 20, no. 3, pp. 2267-2281, 2017. doi: 10.1007/s10586-017-0892-6
[2] H. B. Yadav and D. K. Yadav, "A fuzzy logic based approach for phase-wise software defects prediction using software metrics," Information and Software Technology, vol. 63, pp. 44-57, 2015. doi: 10.1016/ j.infsof.2015.03.001
[3] S. Huda et al., "A framework for software defect prediction and metric selection," IEEE access, vol. 6, pp. 2844-2858, 2018. doi: 10.1109/ACCESS. 2017.2785445
[4] Z. Li, X.-Y. Jing and X. Zhu, "Progress on approaches to software defect prediction," IET Software, vol. 12, no. 3, pp. 161-175, 2018. doi: 10.1049/iet-sen.2017.0148
[5] M. Tan, L. Tan, S. Dara, and C. Mayeux, "Online defect prediction for imbalanced data," in the 37th IEEE International Conference on Software Engineering, Florence, Italy, May 2015, pp. 99-108. doi: 10.1109/ICSE.2015.139
[6] C. Tantithamthavorn, S. McIntosh, A. E. Hassan, and K. Matsumoto, "An empirical comparison of model validation techniques for defect prediction models," IEEE Transactions on Software Engineering, vol. 43, no. 1, pp. 1-18, 2017. doi: 10.1109/TSE.2016.2584050
[7] X.-Y. Jing, F. Wu, X. Dong, and B. Xu, "An improved SDA based defect prediction framework for both within-project and cross-project class-imbalance problems," IEEE Transactions on Software Engineering, vol. 43, no. 4, pp. 321-339, 2017. doi: 10.1109/TSE.2016.2597849
[8] H. Tong, B. Liu, and S. Wang, "Software defect prediction using stacked denoising autoencoders and two-stage ensemble learning," Information and Software Technology, vol. 96, pp. 94-111, 2017. doi: 10.1016/j.infsof.2017.11.008
[9] Ö. F. Arar and K. Ayan, "Software defect prediction using cost-sensitive neural network," Applied Soft Computing, vol. 33, pp. 263-277, 2015. doi: 10.1016/j.asoc.2015.04.045
[10] F. Zhang, Q. Zheng, Y. Zou, and A. E. Hassan, "Cross-project defect prediction using a connectivity-based unsupervised classifier," in the 38th International Conference on Software Engineering, Austin, USA, May 2016, pp. 309-320. doi: 10.1145/2884781.2884839
[11] A. O. Balogun, S. Basri, S. J. Abdulkadir, and A. S. Hashim, "Performance analysis of feature selection methods in software defect prediction: a search method approach," Applied Sciences, vol. 9, no. 13, pp. 1-20, 2019. doi: 10.3390/app9132764 [12] S. Herbold, A. Trautsch, and J. Grabowski, "A
comparative study to benchmark cross-project
defect prediction approaches," IEEE Transactions on Software Engineering, vol. 44, no. 9, pp. 811-833, 2017. doi: 10.1109/TSE.2017.2724538 [13] Y. Kamei, T. Fukushima, S. McIntosh, K.
Yamashita, N. Ubayashi, and A. E. Hassan, "Studying just-in-time defect prediction using cross-project models," Empirical Software Engineering, vol. 21, no. 5, pp. 2072-2106, 2016. doi: 10.1007/s10664-015-9400-x
[14] R. Malhotra, "A systematic review of machine learning techniques for software fault prediction," Applied Soft Computing, vol. 27, pp. 504-518, 2015. doi: 10.1016/j.asoc.2014.11.023
[15] C. Tantithamthavorn, S. McIntosh, A. E. Hassan, and K. Matsumoto, "Automated parameter optimization of classification techniques for defect prediction models," in the IEEE/ACM 38th International Conference on Software Engineering, Austin, USA, May 2016, pp. 321-332. doi: 10.1145/2884781.2884857
[16] A. O. Balogun, S. Basri, S. J. Abdulkadir, and A. S. Hashim, "A hybrid multi-filter wrapper feature selection method for software defect predictors," International Journal of Supply Chain Management, vol. 8, no. 2, pp. 916-922, 2019. [17] W. Fu, T. Menzies, and X. Shen, "Tuning for
software analytics: Is it really necessary?," Information and Software Technology, vol. 76, pp. 135-146, 2016. doi: 10.1016/j.infsof.2016.04.017 [18] Y. Jiang, B. Cukic, and T. Menzies, "Can data
transformation help in the detection of fault-prone modules?," in the 2008 Workshop on Defects in Large Software Systems, Seattle, USA, Jul. 2008, pp. 16-20. doi: 10.1145/1390817.1390822
[19] A. Tosun and A. Bener, "Reducing false alarms in software defect prediction by decision threshold optimization," in the 2009 3rd International Symposium on Empirical Software Engineering and Measurement, Florida, USA, Oct. 2009, pp. 477-480. doi: 10.1109/ESEM.2009.5316006 [20] A. G. Koru and H. Liu, "An investigation of the
effect of module size on defect prediction using static measures," in the 2005 Workshop on Predictor Models in Software Engineering, New York, USA, May 2005, pp. 1-5. doi: 10.1145/1083165.1083172
[21] T. Mende, "Replication of defect prediction studies: problems, pitfalls and recommendations," in the 6th International Conference on Predictive Models in Software Engineering, Timisoara, Romania, Sept. 2010, pp. 1-10. doi: 10.1145/1868328.1868336
[22] T. Hall, S. Beecham, D. Bowes, D. Gray, and S. Counsell, "A systematic literature review on fault prediction performance in software engineering," IEEE Transactions on Software Engineering, vol. 38, no. 6, pp. 1276-1304, 2012. doi: 10.1109/TSE.2011.103
[23] A. G. Akintola, A. O. Balogun, F. Lafenwa-Balogun, and H. A. Mojeed, "Comparative
analysis of selected heterogeneous classifiers f analysis of gray code number system in image security or software defects prediction using filter-based feature selection methods," FUOYE Journal of Engineering and Technology, vol. 3, no. 1, pp. 134-137, 2018.
[24] R. Jimoh, A. Balogun, A. Bajeh, and S. Ajayi, "A PROMETHEE based evaluation of software defect predictors," Journal of Computer Science and Its Application, vol. 25, no. 1, pp. 106-119, 2018. [25] M. A. Mabayoje, A. O. Balogun, S. M. Bello, J. O.
Atoyebi, H. A. Mojeed, and A. H. Ekundayo, "Wrapper feature selection based heterogeneous classifiers for software defect prediction," Adeleke University Journal of Engineering and Technology, vol. 2, no. 1, pp. 1-11, 2019.
[26] A. O. Balogun, R. O. Oladele, H. A. Mojeed, B. Amin-Balogun, V. E. Adeyemo, and T. O. Aro, "Performance analysis of selected clustering techniques for software defects prediction," African Journal of Computing & ICT, vol. 12, no. 2, pp. 30-42, 2019.
[27] T. G. Grbac, G. Mausa, and B. D. Basic, "Stability of software defect prediction in relation to levels of data imbalance," in the 2nd Workshop on Software Quality Analysis, Monitoring, Improvement, and Applications, Novi Sad, Serbia, Sept. 2013, pp. 1-10.
[28] Q. Yu, S. Jiang, and Y. Zhang, "The performance stability of defect prediction models with class imbalance: an empirical study," IEICE Transactions on Information and Systems, vol. 100, no. 2, pp. 265-272, 2017.
[29] S. Bibi, G. Tsoumakas, I. Stamelos, and I. P. Vlahavas, "Software defect prediction using regression via classification," in IEEE International Conference on Computer Systems and Applications, Dubai, UAE, Mar. 2006, pp. 330-336. doi: 10.1109/AICCSA.2006.205110 [30] P. Singh and S. Verma, "Automated tool for
extraction of software fault data," in Advances in Data and Information Sciences: Springer, 2018, pp. 29-37. doi: 10.1007/978-981-10-8360-0_3
[31] M. Tan, L. Tan, S. Dara, and C. Mayeux, "Online defect prediction for imbalanced data," in the 37th Internation Conference on Software Engineering, Florence, Italy, May 2015, pp. 99-108.
[32] G. I. Salama, M. Abdelhalim, and M. A.-e. Zeid, "Breast cancer diagnosis on three different datasets using multi-classifiers," International Journal of Computer and Information Technology, vol. 1, no. 1, pp. 36-43, 2012.
[33] Y. A. Christobel and P. Sivaprakasam, "A new classwise k nearest neighbor (CKNN) method for the classification of diabetes dataset," International Journal of Engineering and Advanced Technology, vol. 2, no. 3, pp. 396-200, 2013.
[34] Y. Liao and V. R. Vemuri, "Use of k-nearest neighbor classifier for intrusion detection," Computers & Security, vol. 21, no. 5, pp. 439-448, 2002. doi: 10.1016/S0167-4048(02)00514-X [35] M. Mabayoje, A. Balogun, A. Bajeh, and B. Musa,
"Software defect prediction: effect of feature selection and ensemble methods," FUW Trends in Science & Technology Journal, vol. 3, no. 2, pp. 518-522, 2018.
[36] P. Hall, B. U. Park, and R. J. Samworth, "Choice of neighbor order in nearest-neighbor classification," The Annals of Statistics, vol. 36, no. 5, pp. 2135-2152, 2008. doi: 10.1214/07-AOS537
[37] R. J. Samworth, "Optimal weighted nearest neighbour classifiers," The Annals of Statistics, vol. 40, no. 5, pp. 2733-2763, 2012. doi: 10.1214/12-AOS1049
[38] T. M. Kodinariya and P. R. Makwana, "Review on determining number of cluster in k-means clustering," International Journal of Advanced Research in Computer Science and Management Studies, vol. 1, no. 6, pp. 90-95, 2013.
[39] L. Song, L. L. Minku, and X. Yao, "The impact of parameter tuning on software effort estimation using learning machines," in the 9th International Conference on Predictive Models in Software Engineering, Maryland, USA, Oct. 2013, pp. 1-10. doi: 10.1145/2499393.2499394