Global Congress on Computing and Media Technologies (GCMT’15)
GCMT-189 An Efficient Time Series Analysis for
Pharmaceutical Sector Stock Prediction by Applying
Hybridization of Data Mining and Neural Network Technique
Debashish Das
a,b, Ali Safa Sadiq
a, Noraziah Binti Ahmad
aaFaculty of Computer Systems & Software Engineering, University Malaysia Pahang
Kuantan, Pahang Darul Makmur, Malaysia.
[email protected], [email protected], [email protected]
bFaculty of Computing, Engineering and Technology, Asia Pacific University of Technology and Innovation
TPM, Bukit Jalil, Kuala Lumpur 57000, Malaysia [email protected]
Abstract
The nonlinearity of the stock market is widely accepted all over the world and to reveal such non-linearity the most effective technique has proved to be constructed through application of either data mining or neural network. Pharmaceutical sector is a rapidly growing sector in Bangladeshi stock market. This paper investigates whether the hybridization of data mining and neural network technique can be applied in predicting the stock price for Pharmaceutical sector of Dhaka Stock Exchange (DSE). This study uses daily trade data for Pharmaceutical sector of DSE. In this paper, we have analysed the behaviour of daily average price for Pharmaceutical sector of DSE. For this study, 6 top listed pharmaceutical companies have been selected to perform the analysis and selected time frame for the research is 15 years (2000-2015). The analysis is performed in two stages where first stage performs the K-means clustering of data mining method to discover the stock with most useful pattern and second stage applies the nonlinear autoregressive with Exogenous Input neural network method to predict the closing price for the selected stock. The prediction performance through the hybridization of data mining and neural network technique is evaluated and positive performance improvement of prediction is observed which is very encouraging for investors. The research also depicts that hybridization of data mining and neural network technique can be applied in determining the stock investment decision for Pharmaceutical sector of DSE though the impact of many different information has greater influence in determining the stock price.
Keywords: Stock prediction; Hybridization; Pharmaceutical Sector; Dhaka Stock Exchange; Data mining; Neural network; K-means clustering; Nonlinear autoregressive neural network.
1.Introduction
Stock market plays a vital role in economy as it is one of the most important sources for companies to raise money. Business can be publicly traded through stock market and extra capital can be also raised through it for
expansion of the businesses by selling the shares of the company in public market. It allows the investors to easily and quickly buy and sell securities. Hence, it is an attractive option for the investors compared to other less liquid investment. Share price is an important factor of the dynamics of economics as it can influence the social mood.
Bangladesh stock market consists of two stock markets namely, Dhaka Stock Exchange (DSE) and Chittagong Stock Exchange (CSE). But, DSE is more matured and bigger market than CSE. DSE was first incorporated as the East Pakistan Stock Exchange Association Limited on April 28, 1954 and it was renamed as Dhaka Stock Exchange (DSE) Limited on May 14, 1964. DSE trading activities was resumed after liberation in 1976 and at that time, only 9 companies were listed. But currently, there are 260 companies enlisted in DSE [Source: www.dsebd.org] at 18 different sectors i.e. Bank, Ceramics, Cement, Engineering, Financial Institutions, Food and Allied, Fuel and Power, Insurance, IT, Jute, Miscellaneous, Paper and Printing, Pharmaceuticals and Chemicals, Services and Real Estates, Tannery Industries, Telecommunication, Textile, Travel and Leisure.
Pharmaceutical industry has developed in Bangladesh over a short period of time and 25 companies are enlisted in DSE from this sector [Source: www.dsebd.org]. Usually, Pharmaceutical companies invests a huge amount of money in research and development and then go for production, but in Bangladesh very few companies have invested for research and most of the companies are small firms as they operate not by innovating drugs rather by copying the drugs from others. Some of the companies of Pharmaceutical sector produce medicine of international standard and export significant amount of medicine worldwide. Hence, in this research instead of considering all the pharmaceutical sector companies we have selected 6 reputed companies namely ACI, BXPHARMA, GLAXOSMITH, RECKITBEN, RENATA, and SQURPHARMA.
Prediction for stock market is a very complicated task as it does not follow any specific process. Many factors are involved for fluctuation of the stock market movement. Economic condition, political situation, traders’ expectation, catastrophes and other unexpected events are some of the major reasons for fluctuation of stock market. Stock market prediction becomes even more complicated due to the various factors involved. Data mining and neural network techniques have been introduced for overcoming the complicacy and these techniques have been applied to ease the prediction [1].
Data Mining is a method that can extract unknown projecting information from large databases and it is a well-known technology that helps organizations to focus on the most important information in data repositories with great potential [2,3,4,5]. Classifying a large data into smaller groups is known as Clustering and it shares the same characteristics. It is also a basic unit of classification of initially unclassified data based on common properties [6].
Artificial neural networks are parallel computing devices and it consists of many interconnected simple processors. Neural network is a significant method for stock predictions as it has the capacity to deal with fuzzy, uncertain and insufficient data which may fluctuate swiftly over very short span [7]. Researchers have attempted numerous researches on applications of neural network and its effectiveness over traditional methods. The most common field of applications of neural network is investigated by Wong and Selvi Bodnovich [8] concludes that 53.5% of its application is in production / operations and 25.4% in finance. Among the different financial applications, stock and performance prediction is the most common applications of neural network.
This paper will analyse the application of k-means clustering data mining and Nonlinear Autoregressive with Exogenous Input (NARX) technique in predicting stock price for the companies of pharmaceutical sector from Dhaka Stock Exchange (DSE). It will also try to address some of the advantages and limitations of the methods and stock prediction after performing the analysis and methodology to those companies with respect to problem domains, the data model and results criteria.
2.Related Work
The dynamic and non-linearity of stock market makes the prediction challenging for researchers. Moreover, influence of variousinternal and external factors towards the movement of stock price make the prediction even more challenging. Investors can avail the recommendation through stock prediction system as choosing the right stock is the most crucial for stock investment. Hence, Stock prediction is an important research dimension which can suggest the investors from choosing the wrong stock and avoid huge loss.The body of literature will discuss the areas relevant to stock market prediction.
Stock market forecasting has received widespread attention of researchers for about two decades. But most researchers have considered macro-economic variables and stock market index return to compute future trend. The
outcome through the research was non-linear data. Our research considers about making prediction of future stock values applying hybridization of data mining and neural network technique. It aims at feeding historical data to the data mining algorithm to categorize the organization and then pass the data to the neural network where data and mathematical formula will train the neural network for better prediction.
Extracting required data from large database is known as Data Mining, which is also called knowledge discovery. Data mining also combines statistics and artificial intelligence (AI) with database management system (DBMS) to process huge collection of data. Neural network processes information through mathematical model, which is very popular among researchers for its accuracy in prediction. Numerous researches have been carried out in these two fields due to the efficiency of those techniques.
Various methods have been applied to predict stock market. S. P. Deshpande et al. have narrated about the various applications of data mining in decision making for diagnosis at medical science, bankruptcy prediction, player selection at sports, product recommendation, prediction for stock holders and investors etc. [9]. Monica Isfan et al. have demonstrated that the nonlinearity of financial data can be revealed by neural network [10]. Adebiyi Ayodele A. et al. have concluded that technical analysis, fundamental analysis and linear regression are not consistent in making prediction with fewer errors [11]. Pratyoosh Rai et al. have found the significance of neural network for stock predictions. It has also the ability to deal with data that may fluctuate rapidly, fuzzy, uncertain and insufficient [4]. Zabir Haider Khan et al. have attempted to predict the stock price for ACI pharmaceutical by applying back propagation method for training the neural network and Multilayer Feed forward network [12]. They have achieved good accuracy in prediction for pharmaceutical sector of Bangladesh stock market using Artificial Neural Network (ANN). However, they have recommended to use more input data to achieve more accurate results.
3.Data Mining with k-means clustering
k-means clustering algorithm is a simple clustering technique used for medical, biometric, financial prediction and other related fields. It clusters observations into groups of related observations without any prior knowledge of those relationships. A large database can be processed quickly and an optimal cluster can be produced faster through k-means clustering. The following function (1) can express the k-means clustering process:
E =
∑
∑
= = n i i i il k lQ
X
d
y
1 1),
,
(
………
(1)In the above Function, n is the number of objects in a dataset X, Ql is the mean of cluster l,
yil is an element of a partition matrix Yn×k,
d is a similarity measure (Squared Euclidean distance)
In k-means algorithm, k is provided as input and the observations are clustered into k groups.The algorithm then assigns each observation to clusters based upon the observation’s proximity to the mean of the cluster.Mean for each cluster is then recomputed and the process is repeated.The steps of the algorithm are as follows:
1. k points are selected arbitrarily as the initial cluster centers (“means”).
2. As per the squared Euclidean distance between each point and each cluster center, each point in the dataset is assigned to the closed cluster.
3. Each cluster center is recomputed as the average of the points in that cluster.
4. Repeat the steps 2 and 3 until the clusters converge, where the convergence will take place if no observations change clusters when steps 2 and 3 are repeated.
4. Nonlinear Auto Regressive with Exogenous Input (NARX) Neural Network
Nonlinear Autoregressive with Exogenous Input (NARX) neural networks can be used to predict a time series from a given past series through appropriate training. It can predict a series called y(t) for a given d past values of
y(t) and another series x(t) [13]. Where, neural network is a collection of interconnected computer units known as neurons that can send and receive signal from each other.
4.1. Training a neural network
Training a neural network is the most important task as the neural network performance heavily depends on training.Data used for training needs to be illustrative to the task to be performed. Lot of research is needed to gain an acceptable result as the training is an unplanned process. The following cases to be considered for designing a neural network solution:
• Identify appropriate network model • Choose a network topology • Decide learning parameters
Data needs to be preprocessed to design a network. Preprocessing can be performed by various complex statistical process or by scaling the data between 0 and 1. In fact, it can be performed in a better way through adequate domain knowledge relevant to the task and good neural network engineering concept.
Data is divided into two subsets namely, training and testing where the actual performance of the network can be determined by testing. Testing can also help to identify the poor performance of the network through training. The network can be generalized through the intellectual management of testing where the good generalization of the network depends on the data that is similar but different from training data [14].
4.2. Prediction through NARX
A dynamic filtering by which future values are predicted by past series is known as prediction. Various dynamic models are produced to design a good predictive model where the dynamic models play the role in analysis, simulation, monitoring and controlling various systems such as financial, manufacturing, chemical, robotics, aerospace etc. NARX can be used for stock prediction through proper training for a given past series.
5. System Architecture
The nonlinearity of a stock market may be revealed by neural network [15]. Literature review has identified and reviewed stock prediction using data mining and neural network technique. Rising stock market like Bangladesh and especially pharmaceutical sector being most important sector of the stock market has not been addressed much by previous research through application of data mining and neural network technique.
We have collected pharmaceutical sector stock data for this research from DSE for about 15 years. Then, k-means clustering algorithm is applied to identify the growth rate prediction for the company’s share based on price, volume and turnover. At first, we divide the data into two clusters namely, highly growing and average growing by applying k-means clustering algorithm based on volume quantity, fluctuation in high and low price of the shares. Later, we have used neural network algorithm through Nonlinear Autoregressive with Exogenous Input (NARX) to predict [16] the closing share prices for the organization selected through clustering. At this stage, the investors can make their decision regarding the investment for the organization. It has been observed that the combination of k-mean and NAR can generate more useful item-set from large market data [17].Figure 1 depicts the proposed architecture of the hybridized prediction system.
Pharmaceutical Stock Data Preprocess Data K-Means Clustering Algorithm to Discover the useful
pattern in the Organization Evaluate the Prediction Nonlinear Autoregressive with Exogenous Input (NARX) Algorithm Predict Stock Price
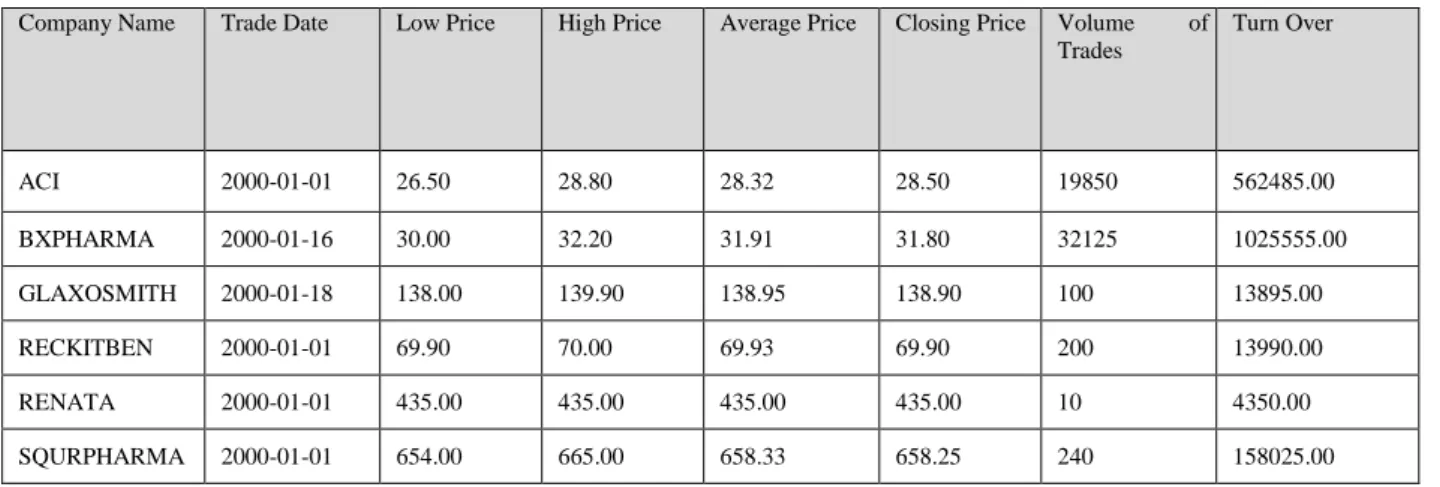
The collected Pharmaceutical data from DSE cannot be used directly after collection and hence data is preprocessed to use it for k-means clustering as per the sample data table 1.
Table 1. Typical data used for k-means clustering
Company Name Trade Date Low Price High Price Average Price Closing Price Volume of Trades Turn Over ACI 2000-01-01 26.50 28.80 28.32 28.50 19850 562485.00 BXPHARMA 2000-01-16 30.00 32.20 31.91 31.80 32125 1025555.00 GLAXOSMITH 2000-01-18 138.00 139.90 138.95 138.90 100 13895.00 RECKITBEN 2000-01-01 69.90 70.00 69.93 69.90 200 13990.00 RENATA 2000-01-01 435.00 435.00 435.00 435.00 10 4350.00 SQURPHARMA 2000-01-01 654.00 665.00 658.33 658.25 240 158025.00
6. Results and Analysis
The research is performed in two stages where the stock with useful pattern is selected through k-means clustering in first stage and closing price of the stock is predicted with Nonlinear Autoregressive with Exogenous Input (NARX) in second stage.The result of each stage is analyzed as below:
6.1.Result through k-means clustering
The stock with very useful pattern is placed in one cluster and the stock with average useful pattern is placed in another cluster through k-means clustering algorithm. The stocks are clustered through the daily trading features i.e. high price, low price, average price, closing price, trade volume and turnover of the company. Table 2 demonstrates the clustering process.
Table 2. k-means Clustering Process
Attribute Full Data
(17092)
Cluster # 0 (12091)
Cluster # 1 (5001)
Company Name ACI ACI SQURPHARMA
LOWPRC 1309.27 280.95 3795.47 HIPRC 1348.31 293.25 3899.15 AVGPRC 1330.63 288.11 3851.13 CLSPRC 1330.63 287.91 3851.63 TRDNO 560.91 472.54 774.57 TRDVOL 110681.94 147207.60 22373.25 TURNOVER 23620984.55 20299243.66 31652012.15
It has been observed that ACI has useful similar pattern overall and hence it has been selected for stock prediction through NARX as the investor has the higher possibility of gain through this stock.
6.2. Result through NARX Neural Network model
Intraday Closing price of ACI for 15 years has been selected and then NARX is applied to predict the Closing Price. As Time Series method for cash forecasting is a better option, we have selected this method for stock prediction. Table 3 demonstrates the classification of data that has been selected for prediction through NARX.
Table 3. Classification of Data Sets
Training Set 70% of the target timesteps
Validation 15% of the target timesteps
Testing 15% of the target timesteps
6.2.1. Architecture of the Neural Network Model
The architecture of the model is demonstrated through Fig. 2. Number of Hidden Neurons in this architecture is 10 and Number of Delays (d) is 2. The following Equation 2 defines the NARX problem for stock prediction.
y(t) = f(x(t-1), …..,x(t-d),y(t-1), …..,y(t-d)) ……… (2) The architecture has the following steps:
a) Number of Hidden Neurons b) Number of Delays
.
Fig. 2. Architecture of the neural network Model
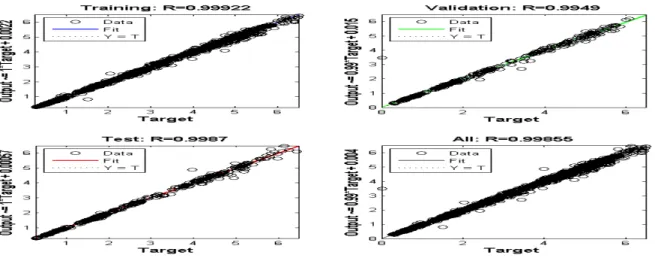
6.2.2. Regression
The regression that helps describe nonlinear relationships in the experimental data is expressed by the Fig. 3 that plots four regressions and it demonstrates the network output with respect to actual data (target) for training, validation, test and all data sets. For a perfect fit, the data should fall along a 45 degree line, where the network outputs are equal to the targets. Here, most data fall along 45 degree line and all the R values produced by each plot is more than 0.99 and much closer to 1. Hence, it indicates that the fit by Regression is reasonably good for all data sets.
6.2.3. Forecasting Results
The final predicted closing price of ACI generated through NARX neural network algorithm is listed in the Table 4 which demonstrates Actual Price Vs Predicted Price.
Table 4. Actual Value Vs Predicted Value of ACI
Company Name Date Actual Predicted Forecasting Error (%)
ACI 2015-10-01 583.30 583.74 0.1 ACI 2015-10-04 573.10 575.77 0.5 ACI 2015-10-05 577.40 575.91 0.3 ACI 2015-10-06 575.20 574.01 0.2 ACI 2015-10-07 570.80 571.10 0.1 ACI 2015-10-08 568.50 570.02 0.3 ACI 2015-10-11 560.40 562.39 0.4 ACI 2015-10-12 562.50 564.48 0.4 ACI 2015-10-13 556.70 559.11 0.4 ACI 2015-10-14 554.50 556.42 0.3 ACI 2015-10-15 553.70 557.81 0.7
6.3.Performance Evaluation of the Predicted Result
The performance of our proposed model is measured through Mean Absolute Percentage Error (MAPE), Mean Absolute Deviation (MAD) and Root Mean Squared Error (RMSE). MAPE, MAD and RMSE are calculated through the equation (3), (4) and (5). Where, (a1,a2,a3,…….,an) are actual values and (p1,p2,p3,…….,pn) are the predicted values. The performance evaluation is listed in Table 5.
... (3)
... (4)
... ………(5)
Table 5. Performance Evaluation of hybridization technique
Input Parameters (Previous 10
Closing Prices) Neural Netwok Architecture Forecasting Performance ACI
Pt-1 NARX MAPE 0.28
…… NARX MAD 1.18
We have attempted to forecast ACI Company’s intraday closing price for Dhaka Stock Exchange through this research. We have used 15 years data for prediction through the neural network. The performance evaluation indicates positive performance improvement through the created network, which is very encouraging for this research work and it will guide the investor for investment into a particular stock.
7. Conclusion
The prime goal of stock research is to facilitate the investors in having good return through stock investment. The hybridization of data mining and neural network technique has proved to be potential in making stock predictions for pharmaceutical sector. However, prediction for a stock market like DSE is a very complicated task as it does not always follow the rule in moving the stock trend but many different external factors i.e. bank interest rate, foreign direct investment (FDI), gold rate, dollar rate, political turbulence, gambling play their role as well.
Pharmaceutical sector is a very important sector in DSE with lot of well reputed companies listed. We plan to investigate the possibilities of creating a generalized prediction system not only applicable for pharmaceutical sector but also for other important sectors and as well as applicable for major global stock market. We also plan to apply the same technique for predicting not only for stock prices but also for various stock indices so that individual and institutional investors can avail a very helpful guideline for stock investment.
In future, our goal is to apply the data mining and optimized neural network in predicting stock market. We plan to work with the parameter and learning of the neural network to achieve better result. We also plan to investigate the effect of various factors viz. dollar price, gold price, FDI, bank interest rate etc. on stock price and index movement.
References
1. Dingxian Wang, Xiao Liu And Mengdi Wang, A DT-SVM Strategy for Stock Futures Prediction with Big Data, IEEE 16th International Conference on Computational Science and Engineering, Sydney, NSW, (2013), pp. 1005 – 1012.
2. Chapman, P., Clinton, J., Kerber, R., Khabaza, T.,Reinartz, T., Shearer, C. And Wirth, R., CRISP-DM 1.0 : Step-by-step data mining guide, NCR Systems Engineering Copenhagen (USA and Denmark), DaimlerChrysler AG (Germany), SPSS Inc. (USA) and OHRA Verzekeringenen Bank Group B.V (The Netherlands) (2000).
3. Sang C. Suh, Ed. Practical Applications of Data Mining, Jones & Bartlett Learning, LLC, (2012).
4. Pratyoosh Rai And Kajal Rai, Comparison of Stock Prediction Using Different Neural Network Types, International Journal of Advanced Engineering & Application, (2011), pp. 157-160, Issue. Jan.
5. Contreras, J. Espinola, R. Nogales, F.J. And Conejo, A.J. , ARIMA models to predict Next Day Electricity Prices, IEEE Transactions on power system, (2003), Vol. 18, No. 3, pp. 1014-1020.
6. Armano G. Marchesi M. And Murru A., A hybrid genetic-neural architecture for stock indexes forecasting, International journal of Information Science, (2005),Vol. 170, pp, 3-33.
7. Dase R.K. & Pawar D.D., Application of Artificial Neural Network for stock market predictions: A review of literature, International Journal of Machine Intelligence, (2010), ISSN: 0975–2927, Volume 2, Issue 2, pp. 14-17.
8. Wong, Bodnovich & Selvi, Neural Network application, Neural Network business, (1997), vol.19, pp. 301-320.
9. S. P. Deshpande and V. M. Thakare, DATA MINING SYSTEM AND APPLICATIONS: A REVIEW, International Journal of Distributed and Parallel systems (IJDPS), Vol.1, No.1 (2010).
10. Monica Isfan, Rui Menezes And Diana A.Mendes, Forecasting the portuguese stock market time series by using artificial neural networks, Journal of physics, 7th International Conference on Applications of Physics in Financial Analysis, (2010), vol. 221, pp. 1-14. 11. Adebiyi Ayodele A., Ayo Charles K., Adebiyi Marion O., And Otokiti Sunday O., Stock Market Prediction using Neural Network with
Hybridized Market Indicators, Journal of Emerging Trends in Computing and Information Sciences, (2011), Vol. 3, No. 1.
12. Zabir Haider Khan, Tasnim Sharmin Alin and Md. Akter Hussain, Price Prediction of Share Market using Artificial Neural Network (ANN), International Journal of Computer Applications (0975–8887), Volume 22–No. 2, (2011).
13. MathWorks. [Online] Available from: http://www.mathworks.com/help/nnet/ref/narnet.html. [ Accessed: 1st September, 2015]. 14. Robert Callan. Ed. The Essence of Neural Networks, Prentice Hall Europe (1999).
15. Monica Isfan, Rui Menezes and Diana A.Mendes, Journal of physics. 7th International Conference on Applications of Physics in Financial Analysis. Vol. 221, pp. 1-14 (2010).
16. T. Santhanam, E. P. Ephzibah. Heart Disease Prediction Using Hybrid Genetic Fuzzy Model. Indian Journal of Science and Technology. 8(9), (2015).