i
Three Essays on Capital Structure Determinants
Hosein Maleki
A Thesis in
The John Molson School of Business The Department of Finance
Submitted in Partial Fulfillment of the Requirements for the Degree of Doctor of Philosophy at
Concordia University Montreal, Quebec, Canada
April 2016 © Hosein Maleki, 2016
ii
CONCORDIA UNIVERSITY SCHOOL OF GRADUATE STUDIES
This is to certify that the thesis prepared
By: Hosein Maleki
Entitled: Three essays on capital structure determinants
and submitted in partial fulfillment of the requirements for the degree of Doctor of Philosophy (Business Administration)
complies with the regulations of the University and meets the accepted standards with respect to originality and quality.
Signed by the final examining committee:
Chair Dr. C. Okoli External Examiner Dr. L. Booth External to Program Dr. B. Campbell Examiner Dr. D. Newton Examiner Dr. J. Ericsson Approved by:
Dr. T. Walker, Graduate Program Director
July 6, 2016
iii ABSTRACT
Three essays on capital structure determinants
Hosein Maleki, Ph.D. Concordia University, 2016
The first essay studies the influence of credit ratings on the time-series evolution of corporate capital structures. We show that better rated firms have significantly more stable leverage ratios over time. By comparing firms across the investment-grade cut-off, we conclude using treatment effects estimation, that assignment to more stable rating classes leads to more stable capital structures over time. Extending this study across the whole range of ratings, we show that a one standard deviation improvement in credit-rating quality can reduce the leverage hazard ratio by more than 70%. In alternative investigations, rated firms tend to have largely more stable leverage ratios compared to not-rated firms. Matching firms based on their propensity to have credit ratings, rated firms take between 1.5 and 9 years longer to change their leverage ratios to the same levels as their not-rated counterparts. Our results are robust to the choice of different time frames and variety of controls. They extend the literature of the effects of credit ratings on capital structures by highlighting the importance of credit ratings on the long-run financing behaviors of firms.
The second essay studies the stability of various debt-structure dimensions. Survival and long-run clustering analyses are used to assess the stability of debt-rank orderings, debt heterogeneity and main debt type(s). Firms only maintain stability in their main debt type, while frequently changing the weights and priorities of other debt types, heterogeneity indexes and rank orderings. While all debt structure metrics are less stable with the assignment of a credit rating, the effect on the stability of the main debt type is minor. Firms with higher tax rates, market leverages and cash flow volatilities exhibit higher stability in their debt structures.
The final essay investigates how the optimal corporate debt maturity is influenced by the strength of creditor rights and the efficiencies of contract enforcement mechanisms. Using a correlated random effects specification, we find that across 42 countries stronger creditor rights are associated with shorter corporate debt maturities while greater contract enforcement leads to longer maturities. These empirical results are consistent with the differing effects of creditor rights and contract enforcement on the choice of corporate maturity predicted by our model. Our results are robust to using different measures of debt maturity, individual components of creditor rights and different measures of contract enforcement. Our results are mostly driven by developed country debt and hold with the inclusion of various controls.
iv
ACKNOWLEDGEMENTS
I would like to thank my PhD advisor, Professor Lawrence Kryzanowski for his invaluable support during my studies. Your patience, depth of knowledge and advice has guided me in every step of the way.
I would also like to thank my dissertation committee members. I am grateful to Jan Ericsson for his intelligent opinions and comments. Your way of thought and argument was an important motivation for me to pursue this line of research. I also thank David Newton for his insightful thoughts and remarks, and for asking questions that made me think and improve my work. I thank my wife, Mahsa, for her love, encouragement and support and for all the intellectual discussions we had during the writing of this thesis. Without her, many things would have been impossible for me. This thesis is not an exception.
I thank my mother and father for their unconditional love, and for being such inspirations throughout my life. Thank you for teaching me to pursue knowledge and seek meaning in science. And thank you for giving me strength to pursue my dreams. Finally, I whole-heartedly thank my amazing brother Hesam, my dearest aunt Maryam and my kindest cousin Pegah for always being there for me, and for being such incredible supports during the last few years. I am so lucky to have them in my life.
v
vi
TABLE OF CONTENTS
1
Table of Contents
Three Essays on Capital Structure Determinants ... i
Introduction ... 1
2 Credit Ratings and Capital Structure Persistence ... 7
2.1 Introduction ... 7
2.2 SAMPLE AND DATA ... 14
2.3 THE STABILITY OF CREDIT-RATING CLASSES ... 14
2.4 DOES CREDIT-RATING STABILITY RESULT IN LEVERAGE-RATIO STABILITY? ... 17
2.4.1 Empirical Methodology ... 17
2.4.2 Results for the Treatment Effects for Survival Data ... 22
2.4.3 Evidence from a Parametric Hazard Model ... 23
2.5 LEVERAGE STABILITY ACROSS RATED AND NOT-RATED FIRMS ... 24
2.5.1 Evolution of Leverage Ratios across Rated and Not-rated Firms ... 25
2.5.2 Propensity Score Matching ... 27
2.5.3 Effect of Being Rated on Leverage-stability Duration ... 31
2.5.4 Leverage-ratio Stability of Firms with Ratings Starts or Stops ... 32
2.5.5 Fluctuations in Leverage Ratios over Time ... 32
2.5.6 Active Leverage Management and Leverage Stability ... 34
2.5.7 Role of Initial Leverage Across Rated and Not-Rated Firms ... 35
2.5.8 Analysis of Variance ... 38
2.6 CONCLUSION ... 40
3 Stability of Corporate Debt Structures ... 42
3.1 INTRODUCTION ... 42
3.2 SAMPLE, DATA AND SUMMARY STATISTICS ... 47
3.3 DEBT STRUCTURE METRICS ... 49
3.4 EMPIRICAL RESULTS ON THE STABILITY OF DEBT-TYPE STRUCTURES ... 51
3.4.1 Results from a survival analysis ... 51
3.4.2 What determines the stability of debt-type structures? ... 54
vii
3.4.4 Credit ratings and the stability of debt-type structures ... 59
3.5 ROBUSTNESS TESTS ... 61
3.6 CONCLUSION ... 62
4 Corporate Debt Maturity around the World: Role of Creditor Rights and Contract Enforcement ... 64
4.1 INTRODUCTION ... 64
4.2 THE MODEL ... 67
4.2.1 Probability of Liquidation ... 69
4.2.2 The Manager’s Problem ... 71
4.2.3 Creditors’ payoffs ... 72
4.2.4 Enforcement ... 73
4.2.5 Testable Hypotheses ... 73
4.3 DATA ... 74
4.3.1 Main Country-level Variables ... 74
4.3.2 Firm-level Variables ... 76
4.3.3 Maturity Indexes ... 77
4.3.4 Summary Statistics... 77
4.4 EMPIRICAL RESULTS ... 80
4.4.1 Estimation Method and Econometric Issues ... 80
4.4.2 Does Level of Creditor Rights and Enforcement Influence Debt Maturity? ... 82
4.4.3 Alternative Measure of Maturity as a Test of Robustness ... 84
4.5 ROBUSTNESS TESTS ... 85
4.5.1 Alternative Measures of Contract Enforcement ... 85
4.5.2 Tobit Estimations ... 88
4.5.3 Alternative Subsamples ... 88
4.5.4 Effect of Additional Country-level Variables ... 89
4.5.5 Controlling for Cross-listed Firms ... 89
4.6 CONCLUSION ... 90
5 Conclusion ... 92
References ... 93
Appendixes ... 100
Appendix 1. Description of variables and their computation for Chapter 2 ... 100
viii
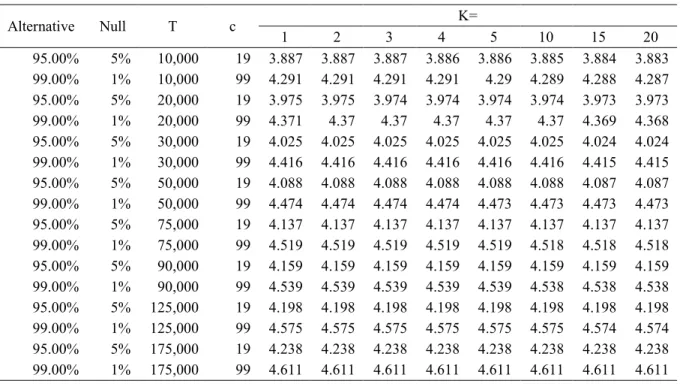
Table A2. Size-adjusted critical t-values ... 102
Appendix 2: Variable Construction for Chapter 3 ... 103
Appendix 3. Variable construction and data sources for Chapter 4 ... 104
Tables ... 106
ix
List of Tables
Table 2.1. Descriptive statistics for the various variables ... 106
Table 2.2. Rating differences after formation of the quartiles based on credit ratings ... 107
Table 2.3. Average treatment effect for firms just above the investment-grade cut-off ... 108
Table 2.4. Stability of rating classes and leverages ... 109
Table 2.5. Market leverage differences after formation of the quartiles based on market leverage ... 110
Table 2.6. Rating effects on leverage stability ... 111
Table 2.7. Leverage-ratio stability of firms with ratings starts or stops ... 112
Table 2.8. Fluctuations in leverage-ratios over time ... 113
Table 2.9. Pooled regression results for leverage ratio determinants ... 114
Table 2.10. Fixed effects regression results for leverage ratio determinants ... 117
Table 2.11. Variance decomposition ... 118
Table 3.1. Summary statistics ... 121
Table 3.2. Determinants of the stability of debt structures ... 122
Table 3.3. Clustering results ... 124
Table 3.4. Determinants of the main debt type ... 125
Table 3.5. Percent of firms with debt structures with more than x% in one debt type ... 127
Table 3.6. Treatment effects estimates ... 128
Table 3.7. Summary Statistics ... 129
Table 3.8. Number of firms and firm-years by country ... 130
Table 3.9. Correlation matrix ... 131
Table 3.10. Maturity index, creditor rights and contract enforcement ... 132
Table 3.11. Alternative- maturity index, creditor rights and contract enforcement ... 133
Table 3.12. Alternative measures of contract enforcement ... 134
Table 3.13. Tobit and CRE sub-sample regression results ... 135
Table 3.14. Additional country-level controls ... 136
Table 3.15. Main maturity results for a sample without cross-listed firms ... 138
x
List of Figures
Figure 2.1. Evolution of the average credit ratings of firm quartiles over event time ... 140
Figure 2.2. Rating transition matrix ... 141
Figure 2.3. Cumulative hazard and survival functions for firms above/ below the Investment grade cut-off ... 142
Figure 2.4. Evolution of market leverage ratios in event time ... 144
Figure 2.5. Cumulative hazard and hurvival functions across rated and not-rated firms ... 146
Figure 2.6. Effect of net debt issuance on subsequent market leverage ratios ... 148
Figure 3.1. Survival analysis with two variation thresholds ... 149
Figure 3.2. Survival analysis of the largest debt type ... 150
Figure 3.3. Survival analysis of debt type ranks ... 151
Figure 3.4. Survival analysis of debt type ranks ... 152
Figure 3.5. Survival analysis of debt type ranks, Spearman’s rho ... 153
Figure 3.6. The clustering results for the heterogeneity indexes ... 154
Figure 3.7. The survival analysis results for various debt heterogeneity metrics ... 156
Figure 3.8. Robustness: Clustering using alternative debt categorizations ... 159
Figure 3.9. Robustness using an alternative number of clusters ... 160
Figure 4.1. Model ... 161
Figure 4.2. Summary statistics ... 162
Figure 4.3. Summary statistics for the weighted-average maturity index ... 162
Figure 4.4. Creditor rights index across different countries ... 163
1
CHAPTER 1:
Introduction
How firms set their financing decisions and optimal capital structures long been of interest in corporate finance. Such decisions are influenced by a variety of determinants including firm-specific, macroeconomic, legal and institutional factors. Capital structures have three essential components: first, choice of the amount of debt and thus the resulting leverage ratio; second, the combination of different debt types and their relative weights in capital structures that we refer to as debt-type structure; and finally, the choice of debt maturity. This thesis addresses the above three aspects of capital structure in three separate studies presented in Chapters 2, 3 and 4, respectively.
In this thesis we investigate (1) the stability of corporate capital structures and specifically, how such stability is influenced by the stability of credit ratings, (2) the stability of corporate debt-type structures, and (3) the determinants of debt maturity.
In Chapter 2 (Essay 1), we explore corporate debt stabilities and investigate how the stability of credit rating classes can lead to the choice of more stable capital structures over time. The importance of capital structure stability is well documented in the related literature and particularly in the seminal work of Robert, Lemmon and Zender (2008). This study suggests that corporate leverages are so stable over time that the importance of a firm’s leverage history on today’s leverage decision is much higher than that of conventional determinants of capital structure combined. The first essay contributes to this discussion by documenting that such stable leverage patterns are largely influenced by firms’ tendency to maintain stable credit ratings.
In doing so, we argue that the influence of credit ratings on corporate leverages can be explored using two complementary hypotheses. In the first hypothesis, we suggest that if credit rating stability leads to leverage stability, more stable credit rating classes should have more stable capital structures over time. In the second hypothesis, we suggest that if firms’ stable leverages are the results of their tendency to maintain stable credit ratings, rated firms should exhibit more stable leverage ratios over time than unrated firms.
To deal with the inherent endogeneity between credit ratings and leverage ratios, we follow the literature on treatment estimation by focusing on firms just above and just below the narrow band of investment grade cut-off (BBB- and BB+). The related literature documents that there is considerable randomness for the assignment of firms across this cut-off particularly due to three
2
reasons: (a) the muddled origins of the cut-off, (b) noise and (c) inertia in the assignment of credit ratings. We find that an assignment to just above the cut-off significantly lengthens the life of a stable leverage policy.
Methodologically, this study adds to the related literature by introducing a new methodology for estimating treatment effects on survival data. This method enables us to directly measure leverage stability. Our method follows matching firms based on their propensity score to be located just above the cut-off, followed by estimation of the treatment effect while accounting for censoring as well as the possibility of missing counterfactuals in the control sample. To address any shortcomings of survival analysis, we introduce an alternative home-made test that computes the probability of leverage fluctuations across the matched samples without excluding firms from the sample as soon as they experience the event. Finally, we document that such stable leverage ratios in response to stable credit ratings are actively managed.
This paper makes four important contributions. First, we extend the literature on credit rating targets (Hovakimian, Kayhan and Titman, 2009 a, b; Graham and Harvey, 2001; Kisgen, 2009; Altman and Rijken, 2004, Nickell, Perraudin and Varotto, 2000) and the literature concerning the inter-relationship between credit ratings and capital structures by showing that the stability of credit ratings induces firms to maintain more stable leverage paths over time. Next, our proposed methodology effectively addresses the critique of DeAngelo and Roll (2015) that the conventional methods used to capture leverage stability, e.g. in Lemmon, Roberts and Zender (2008), are deficient and possibly misleading. Incorporating survival analysis, we are able to directly measure how stable corporate leverages are with no reliance on mean-taking or over-interpretation of fixed effect regression results. Third, to the extent of our knowledge, this paper is the first to introduce the method for the estimation of treatment effect on survival data to the related literature. Finally, we contribute to the policy debate about the regulatory role of credit ratings in financial markets by showing that credit rating considerations have long-term effects on corporate capital structure behavior.
In Chapter 3 (Essay 2), we study debt-type structures, as an integral part of capital structure decisions. The importance of debt structure has been theoretically known for many decades, which include the seminal works of Diamond (1991), Park (2000), and Bolton and Freixas (2000). However, empirical studies of debt structure have only been made possible recently as the debt
3
structured data has become available only over the past few years. Therefore, this paper is one of the first to explore the determinants of debt structure.
A large body of the related literature deals with debt structure as a uniform variable. However, the emerging literature on corporate debt structures has documented considerable variability in debt structures. In this paper, we shed light on an unexplored aspect of debt structures, namely the stability of debt structures over time. This study is motivated by the first essay as well as the findings of Lemmon, Roberts, and Zender (2008) both documenting long-run stabilities in corporate capital structures over time. Particularly, we investigate whether such stable behavior in capital structure decisions can also influence debt structures.
This study enables us, to shed light on two opposing views in the literature regarding the possibility of debt structure stability. The first viewpoint, implied by Lemmon, Roberts and Zender (2008), asserts that similar to capital structures, debt types can also demonstrate stable time-series behaviors. In other words, firms may tend to maintain a stable combination of different debt types in their capital structures over time. The opposing viewpoint is provided by Rauh and Sufi (2010). They argue that large variations in corporate debt structures are in fact a mechanism employed by firms to compensate for the lack of variability in capital structures. We find supportive evidence for both of these predictions, and provide a more thorough understanding of debt structure decisions over time that incorporates both of these seemingly opposing views.
This study has two goals. First, using the newly available Capital IQ database on debt types, we empirically study the stability of debt structures from different perspectives. Using the debt categories introduced in the Capital IQ database, we categorize the debt types into the following seven distinct categories: (1) Capital Leases, (2) Commercial Papers, (3) Lines of Credit, (4) Term Loans, (5) Bonds and Notes, (6) Trusts, and (7) Other Debt.
Second, we empirically study the influence of credit ratings on the stability of debt structures. This examination is particularly motivated by the findings of Rauh and Sufi (2010) that credit ratings influence debt structures. This paper suggests that large and rated firms tend to use multiple debt types in their debt structures whereas unrated, smaller firms incorporate fewer debt types. Using propensity score matching of Dehejia and Wahba (2003) we are able to study the effect of treatment (being rated) on the stability of corporate debt structures.
We introduce a wide range of debt type constructs, including the relative weights and the number of different debt types (debt heterogeneity), ranks of different debt types in the debt
4
structure based on their relative weights, the choice of main debt type and the choice of second largest debt type. To the extent of our knowledge, this is the first study in the literature to provide such alternative constructs.
Our findings can be summarized as follows. First, we find large time-series variations across all different measures of debt structure including debt heterogeneity and debt rank indexes. In sharp contrast with other debt-structure metrics, the main debt type stays largely stable over time. Over a 12 year period, close to 50% of the firms never change their main debt types. Second, we find that rated firms tend to have less stable debt-type structures compared to not-rated firms. This finding, compared to the findings in the first essay, provides evidence consistent with the idea that higher variations in debt structures can compensate for more stability in capital structures.
This chapter makes four contributions. First, we contribute to the emerging literature of corporate debt structures by introducing a comprehensive set of alternative measures of debt structures. We also contribute to this literature by investigating the time-series stabilities of these measures. Second, we contribute to the literature on the stability of capital structures by documenting that firms maintain their single main debt types largely stable over time while changing all other debt types, their weights and ranks frequently. Third, we complement the findings of Colla et al. (2013) by showing that when extended over multiple years, firms’ specialization in a few debt types is almost solely the domain of a single main debt type and does not extend to even the second most important debt type. Finally, we contribute to the literature on the effects of credit ratings on capital structure decisions by showing that having a credit rating largely results in less stability of debt structures.
In chapter four (third essay), we study corporate debt maturities. Particularly, we investigate internationally how the strength of creditor rights and efficiency of contract enforcements influence firms’ choices of optimal debt maturities. This study is mainly necessitated by a plethora of opposing views about the influence of creditor rights on optimal debt maturity. In this paper, we tackle this long standing debate by arguing that this problem is caused by bundling creditor rights and contract enforcements together while they have independent and opposing effects on optimal debt maturities.
Across 42 countries, our empirical results show that the strength of creditor rights and efficiencies of contract enforcement are largely independent of each other, and have merely a correlation of 5%. Using a stylized theoretical model, we are able to disentangle the effect of these
5
two institutional determinants on optimal corporate debt maturity. This is possible since stronger creditor rights give upper legal hand at liquidation to the creditors, while better enforcement efficiencies shrink the time and costs needed to enforce contracts, i.e. to liquidate a firm’s assets. Our model is constructed in the context of asset substation of Jensen and Meckling (1976) and Park (2000). We assume there are two projects: safe and risky, where the payoff of the risky projects is higher for the manger. Shorter term debt is cheaper for the manager since it relaxes the monitoring incentives of creditors. However it restricts the options of the manager particularly in terms of being able to choose riskier projects and to engage in risk-shifting activities. Thus when creditor rights are strong, the ex-ante costs of bankruptcy for the manager increase and in turn, act as a disincentive for taking risky projects. In this regard, it is optimal for the manager to choose the safe project and finance the project with short term debt. With no risk-shifting incentives, the manager finds long-term debt unnecessarily expensive.
Longer term debt, on the other hand, is more expensive as creditors need to monitor and thus charge additional premiums for the supposedly increased risk associated with longer-term contracts. With weak creditor rights the costs of bankruptcy for a manager declines ex-ante, and therefore the less restrictive long-term debt with monitoring becomes beneficial.
On the other hand, contract enforcement reduces the costs of liquidation and simultaneously provides legal guarantees that the contract will be implemented in the future according to the terms agreed to at the time of contracting. We show that these features of better contract enforcement induce both managers and creditors to agree on longer term maturities. In short, our model predicts that stronger creditor rights leads to shorter debt maturity while better enforcement lengthens it.
We address cross-country unobservable heterogeneities using a correlated random effect specification (CRE). This method enables us to estimate the time-varying determinants of maturity with fixed-effects and its time-invariant determinants with random effects specifications. Our results confirm the above hypotheses and document that stronger creditor rights shorten corporate debt maturities while better enforcements lengthens them. These effects are robust to firm and industry specific controls as well as to the inclusion of countries’ institutional, political and macroeconomic determinants. Our results are also robust to the alternative measures of debt maturity as introduced by Fan, Titman and Twite (2012) and Saretto et al. (2013), and to alternative estimation methods and different subsamples.
6
and largely independent impacts of creditor rights and contract enforcement efficiencies on capital structure decisions, our study contributes to the literature on the effects of the institutional environment on a firms’ capital structure decisions (Demirguc-Kunt and Maksimovic, 1999; Giannetti, 2003; Qian and Strahan, 2007; Bae and Goyal, 2009; Cho et al., 2014; Fan et al., 2012). Second, we contribute to the literature on the disentanglement of the effects of institutions on economic activities and corporate decisions (North, 1981; and Acemoglu et al., 2005) by unbundling the impacts of creditor rights and contract enforcement efficiencies on optimal debt maturities. Third, we contribute to the literature concerning the optimal levels of creditor rights in an economy by documenting inefficiencies associated with strong creditor protection laws (Aghion, Hart, and Moore, 1992; Hart et al., 1997; Acharya et al., 2011; Vig, 2013; and Cho et al., 2014).
7 CHAPTER 2:
2
Credit Ratings and Capital Structure Persistence
2.1
I
NTRODUCTIONThe inter-relationship between credit ratings and capital structure decisions is well-documented in the corporate finance literature (Kisgen, 2006, 2009; Kisgen and Strahan, 2010; Ellul, Jotikasthira, and Lundblad, 2011). Leverage changes can lead to changes in credit ratings and
credit-rating changes can motivate changes in financing decisions (Kisgen, 2006; Kisgen, 2009).1
Interestingly, both leverage ratios and credit ratings exhibit persistence over time. Various studies document the long-run targets of credit-ratings over time (e.g., Hovakimian, Kayhan and Titman,
2009; Altman and Rijken, 2004; Nickell Perraudin and Varotto, 2000). Lemmon, Roberts and
Zender (2008) document that leverage ratios are stable over long time periods and question the validity of conventional theories of capital structure including the trade-off and pecking order theories (Graham and Leary, 2011). The magnitude of leverage stability documented by Lemmon, Roberts and Zender (2008) is so large that they conclude that a firm’s history of capital structure is a more important determinant of its current capital structure than the combined effect of all classic capital structure determinants.
In this paper, we introduce a new and unexplored dimension of capital structure persistence and study whether credit-rating stability leads to leverage-ratio stability. To do so, we test two complementary hypotheses. Our main hypothesis is that firms with more stable rating classes have more stable capital structures over time. In order to study this question, we use the rating-based market segmentation between investment and speculative grade firms in the capital markets (Chernenko and Sunderam, 2012). Specifically, we set up novel treatment effects specifications, and use duration and survival analyses to infer causality between these two stable patterns. Our second hypothesis is that the stability of capital structure is different across rated and not-rated firms. Confirming this hypothesis enables us to extend our results to a broader set of firms.
Several a priori reasons underpin the expectation that firms with more stable rating classes maintain more stable leverage paths, and that rated firms have more stable leverages than their not-rated counterparts. First, there is the literature on credit-rating targets and the influence of
1 Moreover, Graham and Harvey (2001) use survey data to document that maintaining a good credit rating
8
credit ratings on corporate capital structure decisions. Hovakimian, Kayhan and Titman (2009), Altman and Rijken (2004), and Nickell, Perraudin and Varotto (2000) find that firms have credit-rating targets. The link between capital structure decisions and target credit-ratings is corroborated by Kisgen (2009) who reports that firms adjust their leverage ratios in response to departures from their target ratings. Studies find that the commencements of bond or syndicated loan ratings influence the capital structure decisions of firms (Kisgen, 2006; Sufi, 2009a) and that credit ratings can influence the cross-sectional variations in leverage ratios by enhancing access to external capital. For example, rated firms have higher leverage ratios mostly due to greater access to capital markets (Faulkender and Petersen, 2006) or loanable funds (Leary, 2009). Moreover investment grade firms have access to more sources of external capital than speculative grade firms (Chernenko and Sunderam, 2012). Refinements in rating-agency criteria significantly affect leverage ratios (Tang, 2009) and ratings reflect target leverage ratios (Elkahmi, Pungaliya and Vijh, 2010). Rated firms also tend to have debt with longer average maturities (Faulkender and Petersen, 2006), which contributes to lower rollover risk. In turn, this is expected to lead to more stable leverage ratios.
Second, there is a large body of literature on how leverage variations may result in changes in rating qualities. All else equal, higher leverage decreases the distance to default in a structural credit approach (Leland and Toft, 1996; Duffie, Saita, Wang, 2007). Conditional on different determinants of credit quality (Duffie and Singleton, 2003), leverage directly affects a firm’s default probability. Not surprisingly, the level of a firm’s leverage is one of the main determinants
of credit-rating decisions by rating agencies such as S&P and Moody’s,2 where an increase in
leverage is commonly associated with a decline in rating quality all else held equal, and vice versa. Reductions in leverage are also generally associated with improvements in credit ratings, and therefore can cause a firm to deviate from its target credit rating (Hovakimian, Kayhan and Titman, 2009; Kisgen, 2009). Thus, firms can be unwilling to put their credit rating status in jeopardy by allowing large fluctuations in their leverage ratios, and particularly when they have a high rating. Therefore, we expect that better-rated firms have more stable leverage patterns over time since increased leverage signals higher risk to the market and may adversely affect a firm’s credit rating, value and operations.
2 For example, refer to Moody’s Credit Rating Prediction Model document found at:
9
In this study, it is necessary to account for the inherent endogeneity between credit ratings and capital structures. Specifically, credit ratings or their qualities are not exogenously assigned to firms and thus a third determinant (unobserved characteristic) may be driving the cross-sectional heterogeneity of both credit-rating assignments and leverage ratios. Moreover, the self-selection into different rating categories makes the use of appropriate econometric methods even more necessary. We address these identification challenges using a set of identification strategies introduced below.
We first formally document the long-run stability of rating classes. We do so using the portfolio formation method of Lemmon, Roberts and Zender (2008). Forming quartile portfolios of firms based on their initial credit rating, we show that the average credit rating for these quartiles stays highly stable after a period of 27 years but becomes less stable with a lower credit rating. More intuitively, an examination of a typical credit rating matrix validates the idea of rating stability since there are consistently higher probabilities that a firm preserves its rating unchanged over the next period.
We cannot simply compare investment and speculative grade firms to test our main hypothesis, because such a comparison can be confounded by differences in the characteristics between firms in these two credit-rating categories. To address this issue, we follow the literature on treatment effects estimation and focus predominantly on firms located just above and just below the investment grade cut-off (i.e. on firms with BBB- and BB+ ratings with S&P). Economic theory suggests that across this threshold firms have similar fundamentals and therefore exhibit similar credit risk as well as capital structure determinants. Therefore, a focus on this cut-off provides an
identification opportunity for estimating the treatment effect of being located just above the
cut-off on the outcome variable, which is the number of years that a firm waits before changing its leverage beyond some arbitrary threshold. This strategy to large extent mitigates the problem of endogeneity between credit ratings and choice of leverage, when coupled with propensity score matching for receiving treatment and appropriate assignment of counterfactuals. To the best of our knowledge, we are the first to introduce the estimation of treatment effects for survival data to deal
with an issue in finance.3
3Discussions of the estimation of treatment effects for survival data are found in Rotnitzky and Robins,
10
Our treatment effect estimation methodology is different in three main aspects from that of Chernenko and Sunderam (2012) where they use the treatment effect to show the existence of market segmentation across investment and speculative grade firms. First, we match firms across the investment-grade cut-off not based on similarity in firm-level characteristics, but rather based on every firm’s propensity to receive the treatment (Cameron and Trivedi, 2005; Dehejia and Wahba, 2002). Based on the related literature of program evaluation (Rosenbaum and Rubin, 1893; Hirano, Imbens and Ridder, 2003; Guo and Fraser, 2015), this should provide more reliable results for causality inference than simple characteristic matching. Second, we not only use a matched sample to increase the soundness of the comparison, but we also account for possible discontinuities in treatment and control samples by generating comparable counterfactuals using Weighted Regression-Adjusted (WRA) estimators. Third, since our outcome of interest is survival, we account for possible censoring and missing data using classic survival data censoring adjustments.
Despite the mostly arbitrary nature of the investment-grade cut-off and our use of the propensity score matching strategy, concerns may still remain about the effect of unobserved variables on our results. There may be some unobserved determinants that are only known to the rating agencies and may affect the assignment of firms across the investment-grade cut-off. Although we cannot perfectly rule out the impact of possible unobservables, we provide two additional examinations to address this concern. First, we argue that if the relationship between rating stability and capital structure stability exists, it should not be confined to the narrow band just above and below the investment grade cut-off. Thus, we use hazard regressions to examine the effect on capital-structure stability from any improvement in credit-rating quality over the whole spectrum of ratings.
Second, we argue that our results should hold with observable-based model-generated counterfactuals. The idea here is that a test that compares treatment firms with model-generated observable-based counterfactuals should fail to produce our primary results if the assignment of firms across the cut-off is influenced by CRA-specific unobservables. We show that our results are robust to this consideration using different estimation methods that include the Regression Adjustment (RA), Weighted Regression Adjustment (WRA), Inverse-Probability Weighting (IPW), and Inverse-Probability-Weighted Regression Adjustment (IPWRA).
11
We find that while firms in higher rating classes have more persistent transition probabilities and thus more stable credit ratings over time, they also have largely more stable leverage ratios. Matched firms just above the investment grade threshold maintain their leverage stability 3.67 years longer compared to their speculative grade counterparts, considering a threshold of a 50% change in leverage. Extending our study across all credit-rating classes using hazard regressions conditional on a set of covariates from the capital structure and credit risk literatures, we show that each standard deviation improvement in rating quality (i.e. four notches) results in more than a 70% reduction in the hazard rates of leverage-ratio changes. Furthermore, the effect of credit-rating quality on increased leverage stability is much higher than the effect of any other determinant.
We use a number of strategies to test our second hypothesis. First, we test if rated firms have more stable leverage ratios over time compared to not-rated firms. Second, we investigate whether individual firms with periods of rated and not-rated regimes have significantly more stable leverage ratios during their rated periods. Finally, we examine whether the probability of leverage ratio changes above any given threshold for rated firms is lower than that of the matched not-rated firms.
To conduct these examinations, we first replicate the portfolio formation method of Lemmon, Roberts and Zender (2008) and show that a stable leverage pattern is more dominant for the rated sample. We then introduce an alternative strategy to study whether rated firms have more stable leverage ratios than not-rated firms. For that we borrow from the literature of program evaluation where no basis for a natural experiment is available. Since in this setting there is no clear-cut cut-off between the treatment and control samples, we match rated and not-rated firms based on their propensity to have credit ratings using the sophisticated method of Dehejia and Wahba (2002) and report how the application of a treatment (i.e. having credit ratings) to one group of firms stabilizes their leverage ratios over time. While causal inference in this sample is not as strong as for the tests of the main hypothesis due to the effect of unobserved determinants, a propensity score matching makes the two samples largely comparable. Using a formal survival analysis on the matched samples, we find that rated firms change their leverage ratios less than not-rated firms and that this difference becomes larger at higher leverage variation thresholds. Controlling for firm, macroeconomic and industry effects, we show that rated firms minimize leverage fluctuations as having a credit rating reduces hazard rates by almost 20%. We further study how
12
the treatment effect of being rated increases the number of years in which the firm maintains a stable leverage policy. Using different matching methods and therefore different numbers of control and treatment firms in each setting, our results show robustly that credit ratings have a significant impact on leverage stability. For example, we document that rated firms delay leverage changes of more than 50% by almost 9 years more compared to their not-rated counterparts in cluster-matched samples.
In a set of identification strategies designed to rule out the endogeneity effect, we document that starting (or stopping) of credit ratings reports has a significant influence on the future evolution of leverage ratios. Firms that begin to have credit ratings tend to maintain more stable leverage ratios in the rated periods, while firms whose credit ratings are discontinued tend to exhibit less stable leverage ratios in the not-rated periods. Our results are robust to the inclusion or exclusion of zero-leverage firms (as suggested by Lemmon, Roberts and Zender, 2008; DeAngelo and Roll, 2015).
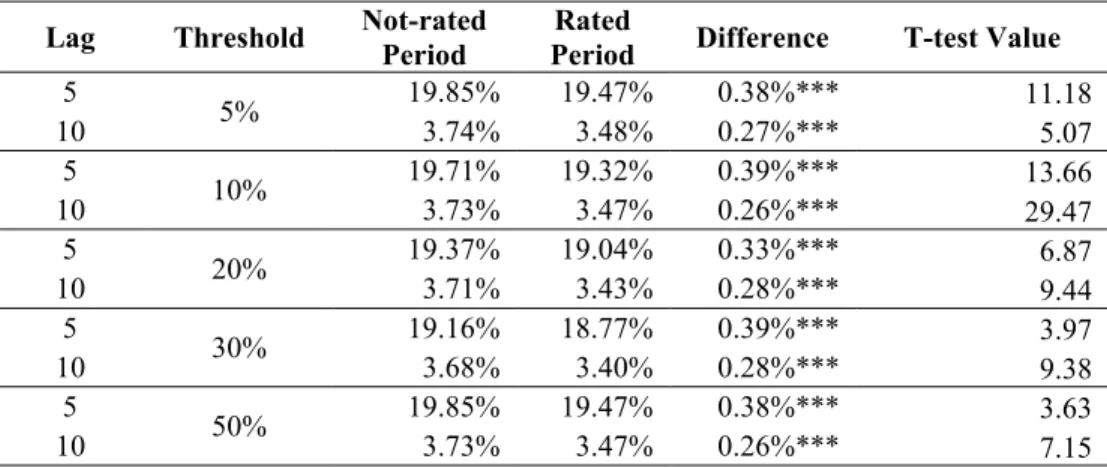
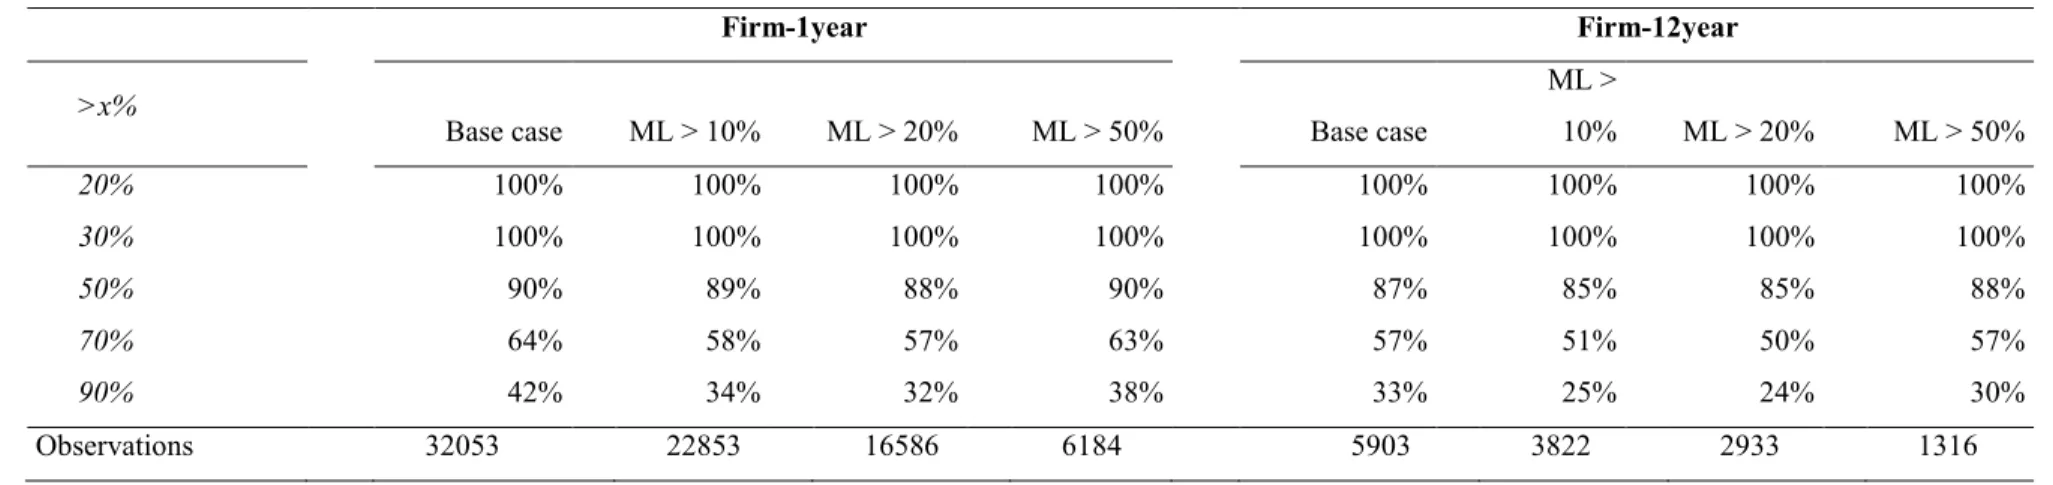
We also introduce an alternative to survival tests by measuring the fluctuations of leverage ratios over time across different thresholds. This new test is motivated by a possible shortcoming of survival analyses. As a firm crosses a leverage threshold for the first time, its future leverage fluctuations are no longer under study using a survival analysis setting. In our alternative test, we retain firms in the sample over the whole study period regardless of how many times a firm crosses different leverage thresholds. We then calculate the probability of fluctuations across different thresholds for the whole sample at any given point in time. We show that rated firms tend to have fewer fluctuations in their leverage ratios over short and long horizons and across different thresholds than not-rated firms. This implies that the leverage-ratio stability in rated firms is not merely a long-run effect but is a pervasive behavior that extends over both short and long horizons.
Finally, we address whether the additional leverage stability for rated firms is due to active management. Based on active net debt and equity issuance portfolios, we document that rated firms have a greater tendency to maintain stable leverages and that active leverage management is influenced by the existence or absence of credit ratings. This result leads to the inference that the stability and convergence patterns in the rated and not-rated firm samples are in fact due to differences in active management.
This paper makes a number of important contributions to the existing literature. First, we extend the credit-rating targets literature (Hovakimian, Kayhan and Titman, 2009 a, b; Graham and
13
Harvey, 2001; Kisgen, 2009; Altman and Rijken, 2004, Nickell, Perraudin and Varotto, 2000), and the literature on the relationship between credit ratings and capital structures by documenting that credit-rating stability induces leverage stability. Our results suggest that the interdependence of leverage ratios and credit ratings not only influences the amount of debt in every period, but also the evolution of and variations in leverage ratios over long periods of time.
Our second contribution addresses a recent critique dealing with the stability phenomenon by DeAngelo and Roll (2015) that the reliance on firm fixed effects and formation of quartile portfolios as indicators of leverage stability by Lemon, Roberts and Zender (2008) are problematic since these methodologies cannot account for short-term leverage variations. We demonstrate that a survival analysis setting with its high sensitivity to short-term leverage fluctuations can be an appropriate alternative for exploring such stability. Furthermore, our home-made test for the measurement of the probability of leverage fluctuations is another alternative for such measurements.
Third, our empirical methodology which provides a setting for the estimation of treatment effects with survival data using matching and assignment of counterfactuals adds to the literature on the use of treatment effect evaluations in finance (Villalonga 2000; Malmendier and Tate, 2009; Campello, Graham, and Harvey 2010; Chernenko and Sunderam, 2012).
Fourth, by studying the relationships between different rating categories and having a credit rating on the financing and capital structure behaviors of firms over time, we contribute to the literature on the regulating role that ratings play in capital markets. In this regard, we also extend the literature on market segmentation by showing that segmentation across investment and speculative grade categories leads to differential capital-structure behaviors over time.
The remainder of this paper is organized as follows: Section 2.2 describes the sample and data. Section 2.3 provides evidence on the stability of rating classes. Section 2.4 studies the relationship between the stability of rating classes and leverage stability using samples of firms with ratings just above and just below investment grade. Section 2.5 studies the second hypothesis, and compares the stability of capital structures across rated and not-rated firms. Section 2.6 concludes the paper.
14
2.2
SAMPLE
AND
DATA
The initial sample consists of all COMPUSTAT firms drawn from the period of 1985 to 2012
from which we remove all financial firms (SIC codes 6000 to 6999).4 The beginning year
corresponds with the year that credit-rating reports commenced for a considerable number of firms. Our choice of an annual frequency is to maintain consistency with the use of annual datasets in the debate about leverage stability (specifically, Lemmon, Roberts and Zender, 2008; DeAngelo and Roll, 2015). Outliers are also eliminated by removing the top and bottom 0.1% of this initial sample based on their market and book leverage observations.
The full sample is divided into not-rated and rated firms where not-rated firms are those with no credit ratings reported by S&P at any point of time or non-temporary length of time during our sample period. COMPUSTAT is our source for S&P credit ratings for the long-term bonds and other financial and accounting information for our sample firms. Since the S&P ratings are reported mostly on a monthly basis and our data frequency is annual, the assigned credit rating for
each firm for each fiscal year is based on that firm’s last S&P rating report for that fiscal year.5
For measuring credit-rating changes, we convert the ratings into a numeric format between 1 and 24, with AAA as 1, AA+ as 2,…, and ending with D as 24 (as in Hotchkiss, Strömberg and Smith, 2014).
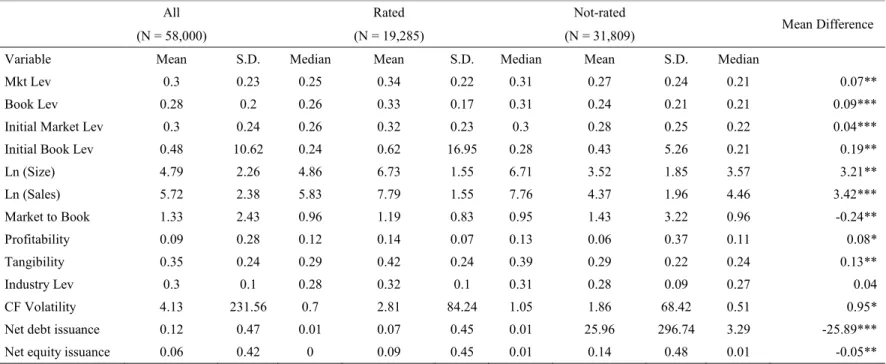
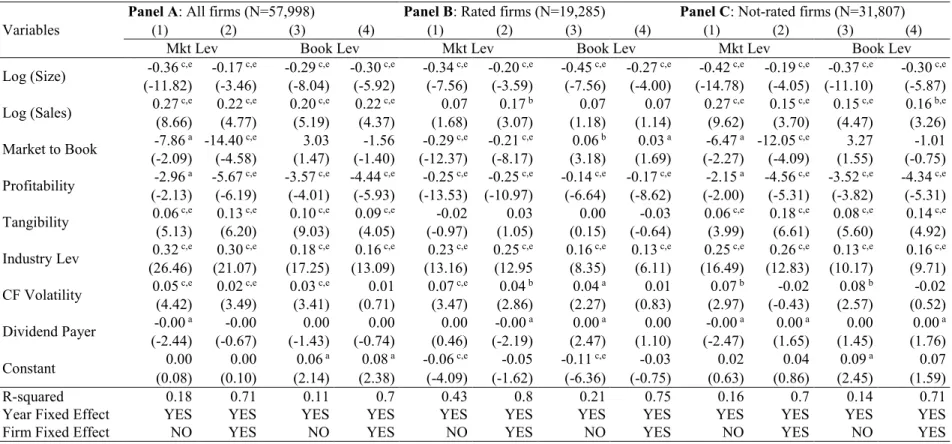
Before proceeding to the empirical results, we examine the summary statistics for the variables for each of the three samples (rated, not-rated and combined). Table 2.1 shows that rated firms are, on average, larger and more volatile in terms of cash flows. They also have higher average sales, profitability, tangible assets and book and market leverage ratios.
[Please insert Table 2.1 about here]
2.3
THE
STABILITY
OF
CREDIT-RATING
CLASSES
To test the main hypothesis of the paper that rating stability results in leverage stability, we first need to investigate whether credit-rating classes are stable over time, and whether credit-rating stability declines with lower credit-rating quality. To examine the stability of rating classes, we
4 Based on untabulated results, we obtain similar results when the sample is confined to those firms with
data for at least ten years on book assets during our sample period. All untabulated results are reported in an internet appendix that is available from the authors of this paper.
5 We obtain similar untabulated results when we assign an annual rating measure by using fiscal year
averages of monthly numerical rating equivalents for each firm. This is primarily due to our study conditioning largely on the existence of a rating, and not the specific rating itself.
15
apply the portfolio formation method of Lemmon, Roberts and Zender (2008) to the S&P credit ratings for firms. Specifically, we construct quartiles of sample firms based on their relative credit ratings in each base year x until the base year is 2012, and then measure the average credit ratings of the firms in each quartile over the next 2013-x years from each base year. We then take the calendar-year averages of these average credit ratings for each quartile. The upper panel of Figure 2.1 shows that the rating quartiles are highly stable over a 20-year period. The average rating improves over time for the lowest rated quartile (line with triangles) and deteriorates for the highest and second to highest rated quartiles (curves with squares and dots). The average ratings hardly change for the second to lowest rated quartiles (curve with asterisks). The convergence is largely a result of this differential deterioration and improvement in credit ratings over time, especially when the highest rated (curve with squares) deteriorates the most and the lowest rated quartile (curve with triangles) improves the most.
Based on the numerical credit-rating equivalents (Hotchkiss, Strömberg and Smith, 2014), the deterioration in the highest rated quartile is about 2 notches. This moves the average rating of 5 (A+) to 7 (A-) for this quartile over 27 years. Deterioration in the credit-rating of the second-highest rated quartile is similar, with the equivalent average rating declining from 8 (BBB+) to 10 (BBB-) over 27 years. The credit-rating improvement for the lowest rated quartile is almost one notch from an average of 13 (BB-) to 14 (B+). Since convergence generally is slight, there is little change in a firm’s rating class over a 20 year period. This finding is consistent with the findings of Alp (2013) that investment grade ratings tightened and speculative grade ratings loosened over the period of 1985 to 2002, and that this drop was followed by another drop of 1.5 notches between 2002 and 2007.
To account for possible attrition effects, we construct an alternative sample of firms with at least 20 years of observations. Based on the plots of the average ratings for each quartile over each of the 27 years reported in the lower panel of Figure 2.1, we observe almost a non-existent transitory (converging) component. A deterioration of about 2 notches occurs over 27 years for each of the categories in a similar fashion, while each rating class remains persistent over time. Considering both panels together suggests that average ratings are highly stable over long periods of time. This finding is also consistent with the findings of Baghai, Servaes, and Tamayo (2014) that average ratings declined by three notches from 1985 to 2009 after controlling for firm characteristics due to the increasing conservatism of rating agencies.
16
[Please insert Figure 2.1 about here]
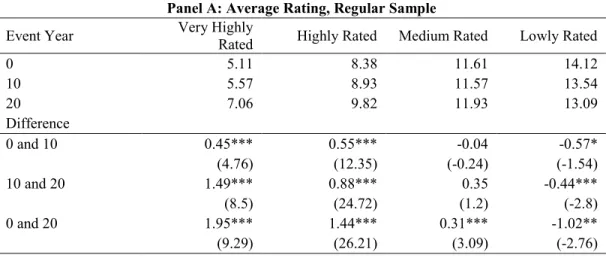
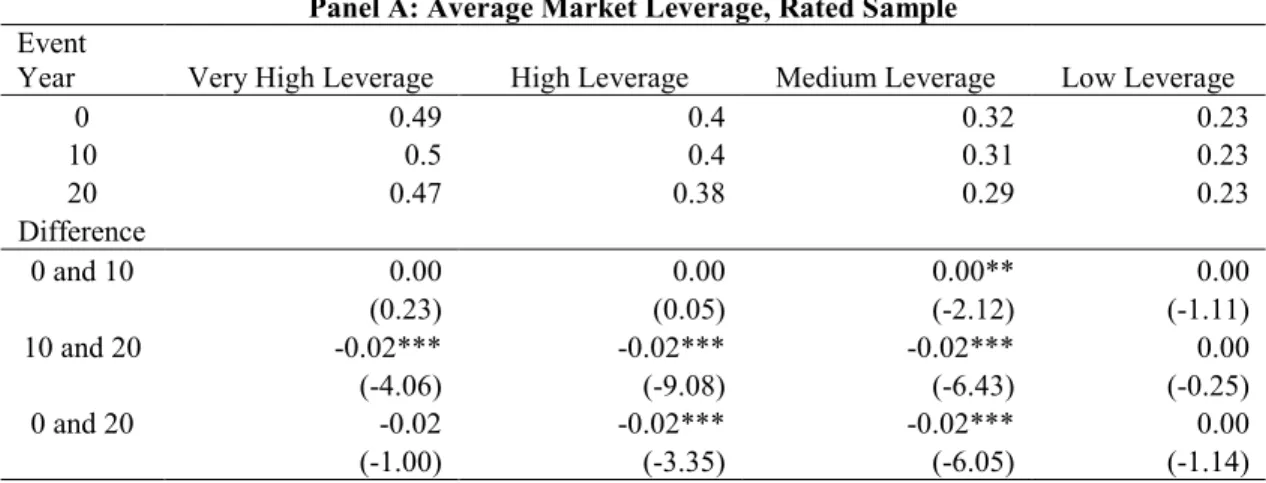
To further explore how ratings evolve over time, we measure the magnitude and test the significance of the differences in mean ratings between event years 0 and 10, 10 and 20, and 0 and 20. The results for the total sample and the sample of firms with at least 20 annual observations are reported in Panels A and B, respectively, of Table 2.2. The improvements in the credit ratings of low and medium rated firms (negative sign) and the deteriorations in the ratings of high and very highly rated firms (positive sign) is evident in Panel A. However, the rating deteriorations are generally more significant than the improvements, consistent with the findings of Alp (2013). As reported in Panel B, the general deterioration in ratings across all four quartiles is significant. This shows that although the relative position of different rating groups is largely stable, there is a significant difference in the base year 0 rating classes going forward. Therefore, stability is chiefly a result of a similar magnitude of deterioration (or improvement) across the different rating quartiles.
[Please insert Table 2.2 about here]
The notion of credit-rating stability is further supported by investigating a typical rating
transition matrix. For example, a Moody’s Rating Transition Matrix (2007)6 is reported in Figure
2.2 for probabilities over 1-year intervals in 2007. The diagonal of this matrix reports the much higher probabilities that a firm preserves its credit rating unchanged in the next period (i.e. next year). Furthermore, the probabilities located on the diagonal decline almost monotonically with a decrease in the credit-rating class. For example, an Aaa-rated firm has a 89% likelihood that it will preserve its credit rating in the next period, while this likelihood for a Baa1, Ba1, Caa1, and Ca-C firm is 75%, 65%, 59% and 35%, respectively. We discuss the possible reasons for this observation later in the paper.
[Please insert Figure 2.2 about here]
6 From Moody’s website:
17
2.4
DOES
CREDIT-RATING
STABILITY
RESULT
IN
LEVERAGE-RATIO
STABILITY?
2.4.1 Empirical Methodology
Building on the result of the previous section that credit-rating stability exists in the long run, we now formally test our main hypothesis of whether a firm’s tendency to maintain stable credit ratings results in higher leverage stability. In preparation for that examination, we first explain our empirical strategy, possible limitations to causal interpretations, proposed solutions, econometric model set up and specification methods.
An important econometric problem that needs to be addressed when investigating the effects of credit-rating stability on leverage stability is that a simple comparison of leverage stability across different rating classes (e.g. investment grade versus speculative grade) can be methodologically problematic. Such a comparison can be confounded by considerable endogeneity between the credit ratings and corporate capital structures. The endogeneity between credit ratings and leverage ratios stems from two main sources: (1) Self-selection of firms into the different rating classes arising from the possibility that higher-rated firms may have entirely different fundamentals from lower-rated firms; and (2) the omitted variable problem since unobserved determinants may affect both leverage and credit-rating decisions concurrently.
To address these concerns, we employ an econometric approach to measure the treatment effect by matching firms just above and just below the investment-grade cut-off (i.e., firms with S&P credit ratings in the narrow band of BBB- and BB+). In our setup, firms that are assigned to the
lowest (just) investment-grade class are in the treatment sample, and those just below the cut-off
(just speculative-grade) are in the control sample. As an outcome, we expect to detect more stable
leverage ratios for the matched firms located just above the investment-grade cut-off.
The first concern about the characteristics of firms assigned across the investment grade cut-off is that a matching method based on observables may fail to capture important unobserved determinants. While the selection of different observables as well as a robust matching method is effective, the origin of the cut-offs themselves can mitigate further concerns. Fons (2004) and Chernenko and Sunderam (2012) report no significant differences in firm fundamentals above and
below the investment-grade cut-off. What firms are in fact “speculative-grade” has long been a
source of debate and confusion. Chernenko and Sunderam (2011) refer to this situation as the “muddled origins” of the investment grade cut-off. In the 1930’s when regulatory bodies began
18
applying restrictions on the holdings of “speculative-grade” bonds by financial institutions, a serious policy limitation was the definition of such assets and what delineated speculative from investment grade bonds. By 1938, Moody’s was able to convince regulators that BBB-rated bonds are not “distinctly” speculative. This suggests that at the threshold that divides investment from speculative grade there are no material fundamental differences in firm observables across the cut-off. We argue that this historic concept still applies, and is corroborated by arguments and findings of noise and inertia in credit-rating assignments by the rating agencies.
The noise and inertia arguments in credit-rating assignments suggest that although credit ratings should contain information about a firm’s credit quality and arguably capital structure preferences, they are subject to errors, delays and mis-assignments. That being the case, one should be able to match firms across rating thresholds so that the matched firms are sufficiently similar in every fundamental respect. We now expand on these two arguments.
Convincing evidence for the inertia argument is provided by Altman and Rijken (2004) and Cantor and Mann (2006). Altman and Rijken (2004) discuss that credit-rating agencies (CRA’s) are slow in adjusting their credit-rating assignments primarily due to the fact that they consider ratings as reflecting long-term default probabilities. These deviations between what ratings indicate and what the actual credit quality of the firms are implies that the investment-grade cut-off used by the rating agencies can be a very imprecise delineator of the credit quality of firms above and below this cut-off. Cantor and Mann (2006) corroborate this argument by showing that CRAs have to trade-off the accuracy of ratings they assign versus the stability of these ratings. Altman and Kao (1992) show that CRA adjustments in credit ratings are mostly done partially. There are additional reasons to believe that rating assignments are noisy. As argued by Chernenko and Sunderam (2012), the organizational structure of CRAs can lead to credit-rating noise. For example, Moody’s has separate departments for evaluating investment grade and speculative grade credits. The limits of information flow and conflicts of interests in such an organizational structure can affect the relative quality of rating assignments. The accuracy of credit-rating outlooks as precursors for possible changes in credit ratings further supports the noise argument. Cantor and Hamilton (2005) show that firms with positive outlooks default at the same frequency as firms with a one-notch better rating over the 1995-2005 period. Moody’s adjusts the ratings of issuers one notch higher (lower) for positive (negative) outlooks in order to assess its quality of rating assignments versus historical default rates. In this regard, firms just below the
19
investment grade cut-off (BB+) with positive outlooks should have at least the same rating quality as firms above the cut-off (BBB-). Finally, conflicts of interest in CRAs and imprecision in the models that they use to determine credit quality also add to the noise in credit ratings (e.g., Bolton, Freixax and Shapiro, 2012),
2.4.1.1
Estimation Method for the Treatment Effects for the Survival Data
The above argument about the similarity in firm fundamentals across the investment grade cut-off provides an interesting opportunity for studying the causal effects of better credit-rating status on capital-structure stability, since assignment of firms just above the cut-off can be arguably considered as being exogenous. In this setting, the outcome variable of interest is the number of years it takes for a firm to change its leverage ratio more than some arbitrary threshold, e.g. 10%,
20% or 50%, compared to its initial leverage. More formally, we study the “survival outcomes” as
a result of the treatment, which is being located just above the investment grade cut-off as opposed
to being located just below it. This answers the question of: “How many years longer does it take for a “treatment” firm to change its leverage ratio above some arbitrary threshold compared to a “control” firm?”
There are still remaining concerns about the matching of firms across the cut-off. The first problem is that we need to have close-enough counterfactuals to each treatment observation. Suppose, for example, that assignment to the just-investment-grade category is still influenced by
a set of covariates 𝑋, whose effects are not yet perfectly exhausted by noise or inertia. For
simplicity, let us assume that the matrix 𝑋 contains only one single covariate, the firm-level
volatility. In this regard, firms with higher volatility are more likely to fall below the cut-off and vice versa. As long as firms above and below the cut-off have comparable volatilities, we can safely estimate the treatment effects. Since there may be situations when no firms with comparable volatilities below the cut-off can be found, the minimum volatility in the control sample may correspond only to the medium volatilities in the treatment sample. Thus, we need to appropriately account for limitations in inference due to missing data, or as it is called in the literature, the censoring problem. We use a set of observables from the literature of capital structure (Parsons
and Titman, 2008) and credit risk (Leland and Toft, 1996; Duffie and Singleton, 2003) to match
the firms just above and just below the cut-off. This matching is done using propensity scores estimated using a multivariate Logit specification (Cameron and Trivedi, 2005). The matching is based on the initial observations of each firm in our sample. For every sample firm, we determine
20
the first observation in the sample and then keep only those with the initial rating of BBB- and BB+ and then find matches for the two samples based on the aforementioned set of observables. Another aspect of the censoring problem is that firms in either sample may have missing observations or have no events during the study period. To address this concern we use weight-adjusted censoring estimators. An assumption behind this method is that the time to censoring is subject to the following three assumptions: (a) censoring is random, (b) the time to censoring comes from a known distribution, and (c) the treatment level does not affect the censoring time. Since the censoring in our sample comes mostly from the coverage by the database (Compustat/ Capital IQ), we can appropriately proceed as if the above three assumptions hold.
Now we discuss how the time to event (survival time) is estimated using the random censoring
determinant, 𝑡𝐶, and a treatment indicator dummy 𝜏 that equals 1 if the observation comes from
the treatment sample and zero otherwise. Let us denote the time to event (i.e., the change of leverage above some arbitrary threshold) for an investment grade firm (treatment) and a
speculative-grade firm (control) with 𝑡0 and 𝑡1. These potential outcomes can be censored or not.
More formally:
𝑡̃ = 𝑡0 𝑐(𝑡0 ≥ 𝑡𝑐) + 𝑡0{1 − (𝑡0 ≥ 𝑡𝑐)} 𝑡̃ = 𝑡1 𝑐(𝑡1 ≥ 𝑡𝑐) + 𝑡1{1 − (𝑡1 ≥ 𝑡𝑐)}
(2.1)
The potential outcome conditional on knowing 𝜏 can be expressed as:
𝑡 = (1 − 𝜏) 𝑡̃ + 𝜏 𝑡0 ̃1 (2.2)
Our main estimator in this paper is the Weighted Regression Adjustment (WRA). To test the robustness of our results to the influence of possible counterfactuals, we also replicate our studies
using alternative estimators including Regression Adjustment (RA), Inverse-Probability
Weighting (IPW) and Inverse-Probability-Weighted Regression Adjustment (IPWRA). The WRA estimators are obtained through a four-step procedure described below. In the first step, we
estimate 𝜸̂where 𝒘, 𝜸are covariates and related parameters, respectively, assuming that the
time-to-censoring distribution is 𝐹𝑐(𝑡𝑐|𝒘, 𝜸). In the second step, we estimate the parameters of a
parametric survival-time model, denoted by 𝛽̂𝜏 for each of the treatment levels 𝜏 ∈ {0,1} where
21
(i.e., the factors that lead to longer or shorter waiting times until the threshold change in the
leverage ratios). 𝛽̂𝜏captures the contribution of each of these covariates to the waiting time while
𝜏 indicates whether the sample is derived from investment grade or speculative grade firms. 𝛽̂𝜏 are
estimated using the Weighted Maximum Likelihood (WML) method, where weights are the inverse of the estimated probabilities of no censoring, or:
𝜔̂ = 1
1 − 𝐹𝑐(𝑡𝑐|𝒘, 𝜸̂) (2.3)
Next, we need to estimate the expected survival time, Ê(ti|Xi, τ, β̂τ), using β̂τand the
distribution F(t|X, τ, βτ), that shows the possible outcome means (POM) for the treatment effect.
Finally, we can estimate the average treatment effects (ATE) by comparing the estimated POMs. Specifically, ATE can be estimated using a set of simultaneous equations as in Newey (1984) and Wooldridge (2010): 1 𝑁∑ 𝜔̂𝑖{𝐸̂(𝑡𝑖|𝑥𝑖, 𝜏 = 1 , 𝛽̂𝜏=1) − 𝑃𝑂𝑀̂ − 𝐴𝑇𝐸0 ̂} 𝑁 𝑖=1 = 0 (2.4)
The ATET is estimated by:
1
𝑁1∑ 𝜔̂𝑖(𝟏{𝜏𝑖=1}){𝐸̂(𝑡𝑖|𝑥𝑖, 𝜏 = 1 , 𝛽̂𝜏=1) − 𝑃𝑂𝑀̂ − 𝐴𝑇𝐸0 ̂} 𝑁
𝑖=1
= 0 (2.5)
We also create alternative counterfactual samples with different models of the IRW, RA, IPW, and IPWRA methods. These methods create model-generated counterfactual observations based on a select set of observables in the treatment and control samples. We argue that if our primary results are influenced by the effects of any unobserved determinants, then similar tests that compare the treatment sample with counterfactual observations created using only observables should not confirm our main findings. Using all these alternative methods, we find that our results which are only tabulated using the IRW method, are almost identically replicated using the model-generated counterfactuals. Based on these findings, we contend that our econometric approach minimizes any concerns regarding the influence of unobservable variables.
22
2.4.2 Results for the Treatment Effects for Survival Data
In table 2.3, we report the average treatment effect (ATE) and average treatment effect for the treated (ATT) across the investment grade cut-off, where the treated and control samples are the ones just above and just below the cut-off point (BBB- and BB+), respectively. The ATE and ATT are reported in the first and second rows, respectively, of every panel (50, 20 and 10 percent thresholds). The potential-outcome means (POM) are reported in the fifth column. As expected for the main hypothesis, there is a large and significant difference across firms above and below the investment grade cut-off in terms of their leverage stability. In the first panel, the average time to change leverage by more than the 50% threshold for a firm just above the investment grade cut-off is 3.55 years longer than the 9.15 years for a firm just below the investment grade. The importance of this effect can be understood by examining the ratio of the average treatment effect to the potential outcome means. In this case, when all firms are located just above the 50% threshold, the time to the first cross above the 50% threshold falls by almost 39% relative to the case when all firms are located just below the 50% threshold.
The second row confirms this finding when the average treatment on treated (ATT) is considered (i.e. only the treatment on the just investment-grade firms is taken into account). For firms that are located just above the threshold, it takes 3.67 years longer to cross the 50% threshold at least once, compared to firms that are located below the 50% threshold. A similar leverage stabilizing effect in response to rating quality above the threshold is prevalent for the 20% and 10% thresholds. Focusing on the ATT estimates, it takes 2.12 (1.88) years longer for firms just above the investment-grade cut-off to cross the 20% (10%) leverage threshold, compared to firms just below it. In contrast, it takes 7.13 (3.21) years for a firm located below the threshold to cross these thresholds. In other words, being rated just above the investment grade cut-off leads to a 30% (59%) increase in leverage stability based on the 20% (10%) leverage thresholds.
These results strongly confirm our main hypothesis by identifying a causal relation between credit rating stability and the stability of leverage ratios over time, where the former influences the latter. The large and significant magnitude of this effect implies that long-term credit rating targets (Hovakimian, Kayhan and Titman, 2009) can largely influence how firms set their capital structure decisions. Compared to the findings of Lemmon, Roberts and Zender (2008), this finding shows that a sizeable portion of the leverage stability is induced by the tendency of firms to keep ratings stable. Considering that a firm’s capital structure history largely affects today’s leverage decisions