PERCEPTIONS ON HURRICANE INFORMATION AND TRACKING MAPS
A Dissertation by HAOCHE WU
Submitted to the Office of Graduate and Professional Studies of Texas A&M University
in partial fulfillment of the requirements for the degree of DOCTOR OF PHILOSOPHY
Chair of Committee, Michael K. Lindell Committee Members, Carla S. Prater
Douglas Wunneburger Jane Sell
Head of Department, Forster Ndubisi
December2013
Major Subject: Urban and Regional Sciences
ii ABSTRACT
Tropical storms and hurricanes have caused extensive casualties and damage in past decades. Recent data indicate that the annual losses from hurricanes are increasing, partly because the U.S. coastal population has increased significantly in the past 20 years. Moreover, the housing values in these areas have increased as well. Thus, population and economic growth in the vulnerable coastal areas have made hurricanes a serious problem and created the potential for a catastrophic loss of life. The existing research literature lacks a sufficient scientific understanding of hurricane information searching and dynamic protective action decision making during events in which additional information becomes available over time. The hurricane evacuation decision context is well understood; the National Hurricane Center (NHC) issues hurricane forecast advisories every 6 hours until a hurricane turns into a tropical depression. Emergency managers and residents in the risk area are most likely to make decisions on their protective actions based on these hurricane forecast advisories. Therefore, this study uses the DynaSearch program to conduct a
computer-based experiment that examines hurricane information search pattern by students playing the roles of county emergency managers, their understanding of hurricane strike probabilities and their choices of protective action recommendations during four different hurricane scenarios. This study simulates the approach of a hurricane by providing experiment participants a sequence of hurricane forecast advisories and examining how they search for information, change their threat perceptions and implement protective actions over time. The results show that (1) People prefer graphic information
iii
about hurricanes; (2) hurricane intensity was the parameter that was most commonly
viewed and hurricane wind radius was the parameter that was least commonly viewed;
(3)forecast track had a large number of clicks and long click durations, whereas
uncertainty cone had fewer clicks but longer click durations; (4) participants’ judgments of the extent to which they used each of the parameters were not entirely consistent with their search patterns; (5) participants found a hurricane’s current location and day-5 forecast were the most informative time periods; (6) there was no evidence that
participants’ personal concern (whether a hurricane will head toward to their county or not) affected their information search pattern in this study; (7) participants failed to evacuate appropriate risk areas in timely manner; and (8) participants had difficulty interpreting strike probabilities. These results suggest the problem of misinterpretation of the uncertainty cone is less severe than some might have concluded from the evidence provided by Broad et al. (2007). Moreover, the results suggest that participants were able to utilize the available information in the tables and tracking maps to make reasonable judgments about each city’s relative strike probability. However, their failure to take appropriate actions suggests a need for more comprehensive training on what actions to take in response to the hurricane information displays.
iv DEDICATION
v
ACKNOWLEDGEMENTS
I am grateful to my committee chair, Professor Michael Lindell, and my committee members, Professor Carla Prater, Professor Douglas Wunneburger and Professor Jane Sell, for their guidance and support throughout the course of this research. A special thanks to Professor Jack Hung who inspired me in the first place.
Appreciation also goes to my friends and Texas A&M Hazard Reduction and Recovery Center colleagues and the department faculty and staff for making my time at Texas A&M University a productive and enjoyable experience. I also want to extend my gratitude to the Texas A&M students who were willing to participate in the study. Additionally, this work was supported by the National Science Foundation under grants SES-0838654 and IIS-1212790. None of the conclusions expressed here necessarily reflects views other than those of the author.
I thank my parents, my brother, my grandparents and the Lin family members for their encouragement. I could not have finished my Ph.D. degree without their support in every way. I wish I made them proud.
Finally, my deepest gratitude goes to my wife who always stood by me no matter what I have been through.
vi
NOMENCLATURE
ETE Evacuation Time Estimation
EOC Emergency Operation Center
HKT Hurricane Knowledge Test
NHC National Hurricane Center
NWS National Weather Service
PADM Protective Action Decision Model PARs Protective Action Recommendations
Ps Strike Probability Judgment
RQ Research Question
vii
TABLE OF CONTENTS
Page
CHAPTER I INTRODUCTION ... 1
CHAPTER II LITERATURE ... 3
2.1 Hurricane risk communication ... 3
2.2 Hurricane information source and users ... 6
2.3 NHC Forecast Advisory Information ... ... 11
2.4 Hurricane information communication studies ... 12
2.5 Processing uncertainty information ... 16
2.6 Research hypotheses and research questions ... 20
CHAPTER III METHODS ... 24
3.1 Procedure ... 24
3.2 Experiment design ... 29
3.3 Analytic method and sample size ... 31
CHAPTER IV RESULTS ... 35
4.1 Experiment results on information search ... 35
4.2 Experiment results on ps and PARs ... 38
CHAPTER V DISCUSSIONS ... 45
CHAPTER VI CONCLUSION ... 50
REFERENCES ... 54
APPENDIX A: FIGURES ... 63
viii
LIST OF FIGURES
Page
Figure A1 Information flow in the PADM ... 63
Figure A2 Hurricane information communication network model ... 64
Figure A3 Evacuation decision tree ... 64
Figure A4 Jefferson County risk area map ... 65
Figure A5 Cameron County risk area map ... 66
Figure A6 Gulf Coast counties map ... 67
Figure A7 DynaSearch display—hurricane forecast advisory 1 ... 68
Figure A8 Experiment conceptual model ... 69
Figure A9 Average click counts and click durations for the first and fourth hurricane scenarios ... 70
Figure A10 The variance in participants’ ps judgment for each city in Hurricane A condition ... 71
Figure A11 The variance in participants’ ps judgment for each city in Hurricane B condition ... 71
Figure A12 The variance in participants’ ps judgment for each city in Hurricane C condition ... 72
Figure A13 The variance in participants’ ps judgment for each city in Hurricane D condition ... 72
ix
LIST OF TABLES
Page
Table B1 Cameron County evacuation time estimates ... 74
Table B2 Jefferson County evacuation time estimates ... 74
Table B3 Descriptive statistics for click counts for each type of hurricane forecast advisory element ... 75
Table B4 Descriptive statistics for click duration (second) for each type of hurricane forecast advisory element ... 75
Table B5 Descriptive statistics of hurricane forecast advisory elements self-report variables ... 75
Table B6 Over all frequency of clicks for hurricane tracking map display element and its time horizon ... 76
Table B7 Over all frequency of clicks for hurricane parameter table and its time horizon ... 77
Table B8 Respondents’ search pattern on hurricane parameter table for each hurricane scenario by hurricane scenario sequence ... 78
Table B9 Cities’ mean ps for each forecast advisory (Hurricane A) ... 79
Table B10 Mean ps for Hurricane A ... 80
Table B11 Mean ps for Hurricane B ... 81
Table B12 Mean ps for Hurricane C ... 82
Table B13 Mean ps for Hurricane D ... 83
Table B14 Participants’ mean number of PARs over six forecast advisories for each of the four hurricane scenarios ... 84
Table B15 Correlations between ps and the number of PARs for Brownsville (Cameron County) ... 84
x
Table B16 Correlations between ps and the number of PARs for Beaumont /Port
Arthur (Jefferson County) ... 85 Table B17 Respondents’ PARs after viewing Forecast Advisory 6 for each
hurricane scenario by county ... 85 Table B18 The sum of ps for each advisory ... 86
Table B19 Differences in ps judgments and PARs by citizenship ... 87 Table B20 Difference in ps judgment and PARs by hurricane evacuation experience . 88
Table B21 The percentage of participants who recommend evacuation on each risk area after viewing Forecast Advisory 5 (Hurricane A, Cameron County condition only, n=40) ... 89 Table B22 The percentage of participants recommend evacuation on each risk area
after viewing Forecast Advisory 5 (Hurricane B, Jefferson County
1 CHAPTER I INTRODUCTION
It is important to study the process by which people track hurricanes because these storms can cause extensive casualties and damage. Category 5 hurricanes with wind speeds over 155 mph are extremely dangerous but even a less intense hurricane can inflict major impacts because of its high winds, tornadoes, inland flooding, and storm surge. For example, Hurricane Katrina was only a Category 3 hurricane but caused about 1,500 fatalities and $81.2 billion damage to Louisiana, Mississippi, Florida and Georgia (NHC, 2005). A few weeks later, Hurricane Rita struck the Texas coast as another Category 3 hurricane. Hurricane Rita caused the evacuation of more than two million people from the coastal area but, fortunately, only 55 fatalities and $12 billion damages (NHC, 2006). Hurricane Ike, a less intense hurricane yet the costliest hurricane in Texas history ($29.5 billion damage), was a Category 2 hurricane when it made landfall on Galveston Island in 2008 (NHC, 2008). Recent data indicate that the annual losses from hurricanes are increasing, partly because the U.S. coastal population has increased significantly in the past 20 years. Moreover, the housing values in these areas have increased as well. Thus, population and economic growth in the vulnerable coastal areas have made hurricanes a serious problem and created the potential for a catastrophic loss of life (Pielke & Landsea, 1998; Green et al., 2007). Existing hurricane emergency management research has mainly focused on hurricane risk assessment and protective action assessment. Fewer studies address information seeking behaviors during a hurricane emergency. This study will start by introducing the Protective Action Decision Model (Lindell et al, 2007) as its theoretical
2
framework. The next section in the literature review will discuss the psychological process of evacuation decision making n terms of information processing, which includes the association system and the analytic system. This section explains how people process information during a hurricane emergency. Next, this study will discuss information sources and users and then how people process hurricane information within the context of the PADM. The last part of the literature review will examine existing hurricane information seeking studies. The literature review section as a whole notes the lack of a scientific understanding of dynamic decision making—especially information seeking behavior—during events in which additional information is available over time. Emergency managers and residents in the risk area are most likely to make decisions on their protective actions based on hurricane forecast advisories. This study uses the
DynaSearch program to conduct a computer-based experiment that examines hurricane
information seeking patterns of students playing the roles of county emergency managers, their understanding of hurricane strike probabilities and their choices of protective action recommendations during four different hurricane scenarios. This experiment will address five research hypotheses and eleven research questions that seek to answer how people process hurricane information and how they use this information to assess their risks and choose the proper protective actions. This study simulates the approach of a hurricane by providing experimental participants a sequence of hurricane forecast advisories and examining how they search for information, change their threat perceptions and implement protective actions over time.
3 CHAPTER II LITERATURE REVIEW 2.1 Hurricane Risk Communication
The likelihood that individuals or properties could result in an adverse outcome at a particular location within a time period is risk (Lindell et al., 2007). Hurricanes have fairly effective forecast technologies compare to other type of natural hazards. Meteorologists are effective in predicting hurricanes’ track and providing information about characteristics such as its intensity, size, and forward movement speed. Based upon this information, meteorologists can formulate hurricane forecast advisories and warning messages. This forecast advisories and warning message serve as one of the information resources to coastal residents and help them make protective action decisions before hurricane winds arrive. Studies have shown that evacuation and sheltering in-place are perhaps the most common protective actions for tropical storm threat (Drabek, 1986; Mileti et al., 1975). Risk areas residents must decide whether the hurricane conditions described in a forecast advisory warrant taking these or any other hurricane protective actions. Lindell et al. (2007) proposed a Protective Action Decision Model (PADM see Figure A1) that explains how people decide whether to respond in an emergency. The information flow in the PADM begins with observing environmental cues, observing the behavior of other people or receiving information through difference channels such as peers, authorities, or news media (Fiske & Taylor, 1991; Lin et al., 2013).Information from social and environmental cues and warming messages trigger three pre-decisional processes: reception, attention, and interpretation. These pre-decisional processes are
4
critical, because they trigger information seeking and protective action decision making. People cannot act upon information if they do not receive it or pay attention to it (Lindell & Perry, 2004). Even if they receive and heed the available risk information, they might misinterpret the environmental or social cues or fail to comprehend warning messages (Turner et al., 1986; Wu et al., 2012). Once the pre-decision processes have been completed, the protective action decision stages and information seeking activities become the next steps. Risk identification, risk assessment, protective action search, protective action assessment, and protective action implementation are the five decision stages. The outcome of risk identification is “warning belief” (Drabek, 1999; Mileti, 1974; Lindell & Perry, 2004) and warning belief is positively correlated with hurricane response (Baker, 1991). The next step, risk assessment, is people’s expectation of personal consequences (lives and property) during an emergency. The existing literature shows that the risk assessment variables (people’s expectations) are also important variables that explain people’s disaster responses (Danzing, Thayer, & Galanter, 1958; Diggory, 1956; Fritz & Marks, 1954; Perry 1983; Tyhurst, 1957; Mileti & Sorensen, 1987; Drabek, 1999; Lindell & Perry, 2004). After the risk is identified and personal consequences are expected, people start to seek protective actions. In this stage, people are likely to seek their available protective action choices based on their past experience or by observing other’s behavior (Lindell & Perry, 2004). Next, the protective action assessment stage, people start to make decisions among available protective actions by weighting the choices. In this process, people in a risk area have to consider their knowledge, skill, equipment, social cooperation, evacuation vehicle availability or financial status to decide the best protective
5
action for them (Lindell & Prater, 2002; Lindell & Perry, 2004). Once the best possible protective action has been selected, the only question left is when to implement the protective action. In the case of a hurricane, evacuees sometimes make their evacuation decisions in the last minutes and fail to recognize the possibility of high volumes of traffic and hazardous weather conditions (Lindell & Perry, 2004).
During the above decision making stages, an individual might need to obtain information to complete some of the stages and this behavior refers to information seeking activity. People are particularly likely to rely on information seeking activities to complete their assessment of the risks and protective actions when environmental and social cues and warning messages are ambiguous or inconsistent. These information seeking activities support the decision making stages and help individuals to select their protective actions. The first task of information seeking activity is the information needs assessment. This is the stage where people realize that there is a need to seek some information to help them make protective action decisions against a certain type of disaster. Next, in the communication action assessment stage, people tend to seek information for risk identification from officials or news media, and obtain information for protective action search, protective action assessment, and protective action implementation from their peers (Lindell & Perry, 1992, 2004; Drabek, 1969). The last stage of information seeking activity is communication action implementation. People try to obtain their answers for the questions that were generated in the decision making stages. In this stage, people either find out the answers and return to the decision making stages or find out the information source is unavailable. If the source is unavailable, the best outcome is to turn to another
6
source or channel to seek the information needed to implement their protective actions (Lindell & Perry, 2004).
Consistent with the PADM, Baker (1991) reported a positive correlation between the levels of threat belief—the degree to which individuals believe that the evidence indicates the normal environment has changed (Lindell et al., 2007; Drabek, 1986)—and response to hurricane threat. In such situations, the tasks in the decision stages and the information seeking activities could affect each other reciprocally. As the NHC issues hurricane advisories every six hours for an approaching hurricane, people’s risk identification, risk assessment, protective action search, protective action assessment, and protective action implementation can change over time. Previous research guided by the PADM has been focused on post-impact surveys of people in the hurricane risk areas. However, this type of retrospective data collection cannot examine the reciprocal relationship between information search and protective action decisions. Consequently, experiments are needed to address this aspect of the PADM. In addition, by using an experimental approach, researchers are able to identify cause-and-effect relationships. Specifically, an experiment design can assess causality by assigning the causes of variation in the independent variable before the dependent variable is measured.
2.2 Hurricane Information Source and Users
Although hurricane warning technology progresses every year, people still lose their lives and property during hurricane season. One of the problems has been that some people do not know whether or when to evacuate because they misinterpret hurricane
7
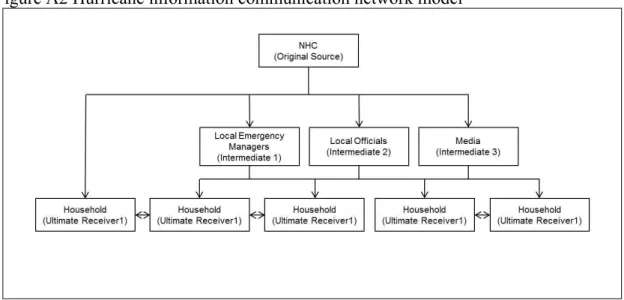
uncertainty information and thus make poor evacuation decisions (Weber, 1994; Weber & Hilton, 1994). For example, Wu et al. (2012) found that people assign higher strike probabilities for hurricanes with higher intensities (i.e. judgments of strike probability are higher for a Category 4 hurricane than for a Category 1 hurricane), even though hurricane category does not affect strike probabilities. Moreover users of hurricane information can differ significantly in their knowledge of hurricane information. Generally, the NHC provides hurricane forecast information to the public, as well as to local emergency managers, local elected officials, and news media. Figure A2 shows a hurricane information communication network model. Original hurricane information from NHC is transmitted to some intermediate sources (emergency managers, local officials, and news media) and then to the ultimate receivers—households. However, some households might obtain information directly from the NHC website.
Hurricane information is used by variety of individuals and organizations that play different roles in society. As a hurricane approaches, local emergency managers’ and local elected officials’ major task is to protect the public from death, injury, damage and disruption. Local emergency managers and other officials provide warnings, evacuation transportation support, evacuation traffic management, and shelter accommodations on the basis of their understanding of the information received from the NHC—usually via HURREVAC and HURRTRAK, as well as the forecast advisories on the NHC website (Demuth et al., 2012). Frequently, emergency managers are responsible for interpreting hurricane information to their local elected officials, because the emergency managers have the expertise that elected officials lack even though the latter have the legal authority
8
to order evacuations. Evacuation is one of the most effective protective actions against hurricanes, but local officials have to balance the disruption of an evacuation against the uncertainty about whether a hurricane will strike. Local officials must decide whether to evacuate based on hurricane strike probabilities and the costs of the four possible outcomes of an evacuation decision (Figure A3). Outcome A is a correct decision; an evacuation preceded a hurricane strike so lives were saved. Outcome B is a “false positive” decision error that could cost millions of dollars (Lindell, Kang & Prater, 2011; Whitehead, 2003; Wu, Lindell & Prater, 2012), whereas an Outcome C is a “false negative” error that could cause hundreds or thousands of avoidable deaths (Jonkman, Maskant, Boyd &Levitan, 2009). Ideally Outcome D is also a correct decision; an evacuation was not ordered and it ultimately proved to be unnecessary. Thus, the challenge is to weight the probability and consequences of the two decision errors. Accordingly, local officials often try to avoid Outcome B (unnecessary evacuation) by delaying evacuations until the strike probability becomes sufficiently high. Unfortunately, evacuation takes time. Indeed, some jurisdictions with large coastal populations need at least 36 hours to evacuate (Lindell, 2008). Thus, local officials need to decide whether or not to issue an evacuation order 36 hours or more before the arrival of the tropical storm force wind (39 mph). But the reality is that NHC has advised that the hurricane strike probability is only 25% or less at that time (Lindell & Prater, 2007).
The news media is another type of hurricane information user, usually the primary intermediate source for hurricane forecast information transmitted from the NHC to the risk area population (Piotrowski & Armstrong, 1998; Lindell, Lu & Prater, 2005; Zhang
9
et al., 2007; Morss & Hayden, 2010). In addition, local emergency managers rely on the news media to deliver their warnings and protective action recommendations to citizens as well (Perry & Lindell, 2007). Risk area residents are most likely to acquire hurricane information from TV, radio, or newspapers even though the NHC’s forecast advisories are available on the internet from the NHC website (Lee et al., 2009; Sherman-Morris, 2005, Demuth et al., 2009). Therefore the news media obtain information from the NHC and interpret it in terms of their own meteorological knowledge. Finally, the news media also have to digest the information, summarize it in a few bullet points, and present it to their audiences (Churchill, 1997; Demuth, 2012). News media meteorologists’ understanding of hurricane risk information is especially important. They have to interpret the forecast advisories in a way that makes it easy for their audiences to understand. On the other hand, unlike the NHC and local emergency managers, the news media are private sector organizations whose goals are to gain public attention and make profits for their companies. Thus, the news media have an incentive to dramatize the NHC’s original message so they can gain market share; however, during an emergency, many news media outlets provide messages with low distortion and high specificity (Perry & Lindell, 2007). In fact, Demuth’s (2012) interviews showed that media personnel feel responsible to deliver understandable and precise hurricane information to the general public without creating chaos.
The most important hurricane risk information users are those people in the risk areas. The ultimate goal of making hurricane forecast advisories is to increase awareness of an imminent threat. People receive hurricane information from either local emergency
10
managers or the news media, but most of the time it is from the news media. Therefore, channel access becomes one of the major issues disseminating hurricane information. Indeed, channel access and channel preference differ by location, ethnic groups and technology. Perry and Nelson (1991) conducted a survey on hazard information dissemination among different ethnic groups during a flood in Abilene, Texas and a hazardous material train derailment with in Mt. Vernon, Washington. They found that Whites preferred articles and brochures; African-Americans preferred radio, newspapers, and brochures; and Mexican-Americans were more likely to obtain information through social network contacts. On the other hand, a more recent study found that, although the traditional information channels (TV, radio, newspapers) are still the major information sources, there is a growing desire to obtain hurricane risk information from Internet sources such as Facebook, Twitter, etc. The young and middle age population segments, in particular, use the Internet on a daily basis and try to obtain risk information from the World Wide Web (Liu et al., 2011). In addition, people who live in different areas might have different access to different information channels as well. Thus, technological changes and different study locations are likely to affect information channel preferences among different ethnic groups. Therefore, it is important to examine the hurricane information search processes of households, since they are also able to receive information from the NHC directly through internet.
11 2.3 NHC Forecast Advisory Information
The NHC provides information to users by means of hurricane forecast advisories. Generally, a forecast advisory includes information such as hurricane location, wind speed, storm size, Saffir-Simpson category, and forward movement speed. Hurricane tracking maps are widely used by the news media, households, and local jurisdictions’ emergency operation centers. However, hurricanes are somewhat unpredictable so their track direction, size, intensity, and forward movement speed change over time (Wu et al., 2012). For example, the forecast advisory that the NHC issued on August 12, 2004 predicted that Hurricane Charley (2004) would strike Tampa, Florida (NHC, 2004); however, the hurricane changed its track and instead struck Punta Gorda, Florida, which is 40 miles away from Tampa (NHC, 2006). This incident and others make it clear that hurricane forecast advisories need to include information about uncertainties in hurricane parameters in order for people to avoid being surprised by changes in hurricane behavior (Pielke, 1999). The hurricane uncertainty cone was developed to provide people with information about potential errors in the NHC’s forecast track, so they can make timely and responsible decisions (Broad et al., 2007). Unlike the forecast track lines, the uncertainty cones help hurricane tracking map users realize that locations on the hurricane forecast track line are not the only risk areas (National Research Council, 2006). As the NHC explains,
“…the cone of uncertainty represents the probable track of the center of a tropical cyclone, and is formed by enclosing the area swept out by a set of circles along the forecast track (at 12, 24, 36 hours, etc.). The size of each
12
circle is set so that two-thirds of historical official forecast errors over a 5-year sample fall within the circle” (NHC, 2012).
2.4 Hurricane Information Communication Studies
There are only few researches that have examined the hurricane information communication. These studies used experimental design to address these issues; however, none of them examined the way in which people search for information about approaching hurricanes. Christensen and Ruch (1980) did a study with 24 participants who lived on Galveston Island. They provided their participants hurricane information such as storm location, forward movement speed, storm track, and wind speed. In this study, the participants had to decide their protective actions (wait for further information (=1) to evacuate immediately (=10)) after receiving the hurricane information. The results of this study suggested that participant’s protective action decisions escalated as the storm approached to the coast. In addition, hurricane experience and emergency manager’s recommendations are positively correlated to each other.
Baker (1995) conducted a study on hurricane protective action decisions with 400 residents in Pinellas County, Florida. This was an experimental study with a four between-subjects manipulation. The residents were randomly assigned to four different conditions. In each condition, the hurricane strike probability information for Pinellas County is different (50%, 30%, 10% or none). Also, there were 16 different hurricane threat scenarios in each condition. The authors provided four threat cues (storm location, wind speed, hurricane watch/warning, and local officials’ evacuation action) to the experiment participants. The author concluded that participants’ evacuation expectations are highly
13 effected by local officials’ evacuation orders.
The Baker (1995) and Christensen and Ruch (1980) studies provided useful information on people’s responses to different type of hurricane information; however, these studies did not address hurricane information searching patterns during a hurricane event. On the other hand, the Broad, Leiserowitz, Weinkle and Steketee (2007) study touched the issue of hurricane information interpretation. The authors believed that the cone of uncertainty display is a very useful piece of information which shows the natural of hurricane threat (strike probabilities); however, unfortunately, it is not well understood by general public. In addition, this study pointed out that people prefer using a hurricane forecast map with both dashed track line and uncertainty cone according to a NWS survey study, but the authors stated that some news media outlets tend to show the uncertainty cone without forecast track line to prevent people attach greater certainty to the forecast track line then it should be. Although the NHC/NHS have putted a lot of efforts explaining the use of hurricane uncertainly cone for many years, this study showed anecdotal evidence that the uncertainty cone is misinterpreted by people.
Wu et al. (2012) conducted an experimental study on hurricane strike probability judgment. There were 162 participants from an Introductory Psychology subject pool. This study had different levels of within and between subject manipulations. All of the participants received eight different hurricane track display maps (4 hurricane directions X 2 intensity) plus one hurricane map showing hurricane locations only. As for the between subject manipulation, each group received different type of hurricane maps, that is one group received hurricane map with forecast track only; one group received hurricane
14
map with uncertainty cone only; and one group receive hurricane map with both forecast track and uncertainty cone. The experiment participants had to assign strike probabilities (ps) for the eight different directions from the hurricane center (north, northwest, west,
southwest, south, southeast, east, and northeast) for each hurricane scenario1. This study concluded that (1) people realized that hurricanes could make turns, hurricane does not always follow forecast tracks or uncertainty cone. The results from strike probability assignment suggested that people assign non-zero strike probabilities to the sectors that are not in the hurricane direction. Even in the extreme case, the participants did not assign zero strike probabilities to the direction that is completely opposite to the direction that a hurricane forecast track was heading. Never the less, the judgments of strike probabilities distributions were unimodaled and were centered on the direction that the hurricane forecast track was heading. This research also suggested that people had difficulty utilizing probability. The results indicated that the sum of the judged strike probabilities for the eight sectors were higher than one.
To sum up, these previous studies showed that people are capable of using different forms of hurricane information such as verbal information (Baker, 1995), numeric information (Baker, 1995), and graphic information (Wu et al., 2012). In addition participants’ protective actions decision increased as storm approaches to coastal areas (Christensen & Ruch, 1980). Thus, hurricane response is a dynamic decision task because
1Originally the authors divided the experiment participants to three groups—the strike probability group,
miss probability group and miss odds group. However they converted miss probability and miss odds to the implied strike probability for the statistical analyses.
15
its threat level changes over time, so local officials’ and residents’ situational assessments should also change as the threat level changes. That is, as mentioned earlier, hurricanes can be characterized in terms of their current position, proximity to coastal jurisdictions, their past track, forecast track, intensity, size (radius of hurricane or tropical storm wind) and forecast movement speed. The NHC can forecast these hurricane parameters over time horizons from 1-5 days. However, research to date has failed to examine the extent to which people rely on these parameters and time horizons to make decisions about how to respond to an approaching hurricane. Although Christensen and Ruch (1980) showed that people take different protective actions as a hurricane approaches, there is a need to study how people’s information search patterns and ps change as well as their protective
action decisions over time.
The limitations of previous hurricane experiments can be addressed by using a hurricane tracking task in which experiment participants can view one or more table of numerical hurricane parameters such as the storm’s distance from possible points of landfall, storm intensity, and forward movement speed. These parameters would be the table’s rows and different points in time from the current time to five days in the future would be the columns. In addition, the hurricane information displays could include tracking maps that present graphical information such as current location, as well as forecast tracks and uncertainty cones over periods carrying from one to five days. Moreover, this display could include a text containing any NHC watches and warnings. After searching the display page, participants could be asked to report their strike probability judgments for different cities and to report any protective actions they would
16
take in respects to that forecast advisory. This process would be repeated for multiple forecast advisories.
2.5 Processing Uncertainty Information
As noted earlier, survey research based on the PADM can only examine the search for hurricane information retrospectively and, thus, is quite limited in the conclusions that can be drawn about the information search process. Experiments are better suited to addressing this question, but the hurricane decision making experiments conducted to date have focused on other issues. Thus, it is appropriate to consider some of the findings from some basic studies of decision making and the role of information search processes in these decisions. Decision making is one of the main tasks that people face every day. In many situations, people make decisions based on information they have received recently together with the lessons they have learned from their previous experiences in these types of situation. Researchers have concluded that the psychological decision process has two systems (National Research Council, 2006). The first, the associative system, helps an individual to make decisions automatically. This system does not require an individual to go through complex cognitive operations, so people can make decisions very fast (Epstein, 1994; Chaiken & Trope, 1999; Sloman, 1996). Our reflex actions are based on this associative system. For example, when an individual sees a baseball coming toward to her face, she will try to dodge the baseball immediately without explicitly considering the consequence of being hit by a ball in the face. It is also used for repetitive decisions such as which brand of toothpaste to buy. On the other hand, the second system— the analytic system—helps individuals to consider any information they have received and make
17
decisions logically and rationally (Epstein, 1994; Chaiken& Trope, 1999; Sloman, 1996). The analytic system does not function like the associative system. Instead of functioning automatically, it requires effortful conscious awareness to make a decision (National Research Council, 2006). One of the major tasks for the analytic system is searching for information and choosing the best option from multiple alternatives. Information search and decision making are well studied areas for psychologists and consumer researchers. Choice between bets is the most widely studied type of decision making studies (Kahneman&Tversky, 1979; Tversky&Kahneman, 1992; Bradstatter et al., 2006, Payne, Bettman, & Johnson 1993). These studies infer people’s decision processes by presenting experiment participants a series of alternative choices that differ in their probabilities and payoffs. However, Willemsenand Johnson (2011) believes that process tracing data can better explain participants’ decision behavior than simply observing their choices. That is, requiring experiment participants to search for information that describes the attribute of each alternative before making a choice is more informative than simply presenting them with the information needed to make a choice. Further, process tracing can help researchers to assess the heterogeneity among participants in their information search processes (Willemsen & Johnson, 2011). Researchers have used several different techniques to examine people’s information search processes—having participants talk aloud while they are thinking (Ericsson & Simon, 1980); recording the physical retrieval of information board elements (Payne, 1976; Jacoby et al., 1985); recording participants’ eye movements (Russo &Rosenm 1974; Duchowski, 2007; Wang, 2011), or simply asking people what information they would use (Willemesen& Johnson, 2011). For most process
18
tracing studies, information boards have been used to display decision alternatives in the rows and the attributes of those alternatives in the columns. When participants first see an information board, the content of a cell is covered so they are not able to view the information until they remove the cover. Requiring participants to obtain information by means of observable behaviors allows experimenter to record the sequence in which each cell is accessed and how long/how many times it was viewed during an experiment (Ford et al., 1989).
Although the associative and analytic decision making systems function in different ways, they generally work with each other. Specifically the analytic system must guide the associative system to process the information and make a decision (Damasio, 1994). It does this by activating a mental model of a situation and directing attention to different aspects of that situation, retrieving relevant information from long-term memory, and transferring that information to working memory to make assumptions about that situation—commonly identified as situational comprehension.
Mental models are important for understanding decision making because experts and non-experts can have different mental models for the same knowledge domain (Bostrom et al, 1994). It is important to recognize that people’s interpretation of environmental cues and comprehension of warnings depends upon their schemas or mental models of the situation. Therefore, it is important for emergency managers to understand people’s mental models of hurricanes because these mental models determine what information people seek, heed, and use in making protective action decisions. For example, emergency managers and coastal residents might have significantly different
19
mental models of hurricane evacuation. Attention also plays an important role in understanding hurricane information users’ cognitive processes because of the limits it imposes on mental load. In general, individuals can pay attention to only four to six independent variables when making decisions or judgments (Strayer & Drews, 2007). Therefore, people tend to pay the greatest attention to the information elements that they think are most relevant to the situation, the elements that are different from other elements, or the elements that most obviously change over time (Sarter, 2006; Durlach, 2004). For example, people are likely to pay more attention to any elements of hurricane tracking maps that are large, bright, colorful, flashing or moving. Moreover, researchers have found that reading habits can also affect people’s attention; a top-bottom and left–right reading habit could make observer focus on the top-left quadrant display and miss an important element if it is displayed in the bottom-right quadrant (Sarter, 2006; Strayer & Drews, 2007)2. Working memory affects mental models as well. Working memory allows an individual to maintain relevant information for ready access but there is also a limitation on working memory (Boduroglu, et al., 2007; Ericsson & Kintsch, 1995). People cannot remember all the information that is relevant to a task but, if they can develop a schema and “chunk” task relevant information, it is possible to improve their working memory and perform better on the task (Ericsson et al., 1980). Because situational comprehension is influenced by each person’s mental model, one can expect significant differences in people’s situational comprehension, even when they are given the same information. For
20
example, Lowe (2000) conducted a series of weather map related experiments on meteorology experts and non-experts. He found that meteorologists generally have a better understanding of weather maps and pay more attention to the most important weather information because they can link situational information with their mental models of weather system to form a better situational assessment.
2.6 Research Hypotheses and Research Questions
Based on the findings and limitations of previous research, this study will use an experiment to address some unanswered questions such as people’s preference for the form of information, and the change of ps and PARs when facing an escalating hurricane threat. This experiment manipulates several factors: within-subjects (multiple forecast advisories and multiple hurricanes) and between-subjects (multiple hurricane sequences and different decision maker locations) manipulations. The reasons for these manipulations are listed below. (1)Multiple forecast advisories(within): The NHC provides new information about a hurricane in forecast advisories that are released every six hours, so examining participants’ reactions to an approaching hurricane will provide a more complete understanding of hurricane information searching and decision making overtime. (2) Multiple hurricanes scenarios (within): This manipulation will allow us to examine the differences in the processing of information about hits, near misses, and “far misses” (i.e. a manipulation of the perceived personal relevance of each scenario). (3) Multiple sequences (between): This manipulation will allow us to assess the input of serial position effects. Research on judgment and decision making has shown that people’s judgments are influenced by their context (e.g., Kahneman & Tversky’s, 1974 “anchoring
21
and adjustment heuristic”), which suggests that a person’s response to a near miss that was preceded by a hit would differ from their response to a near miss preceded by a “far miss”. (4) Different location (between): Assigning participants to two different locations provides an opportunity to replicate some of the results. Specifically, participants should respond in much the same way, regardless of the county to which they are assigned, (1) to a hurricane traveling directly toward their county, (2) to a hurricane traveling toward a county hundreds of miles away, and (3) toward a county midway between these two counties. The research questions and research hypothesis for this study are as follows. 1. Research questions related to information search.
RQ1: When an experiment participant receives a graphic hurricane map, a numeric hurricane parameter table, and a verbal warning/watch message, which is the type of information that they prefer to use?
RQ2: Will hurricane track direction and county location make a difference in participants’ search for graphic, numeric, and verbal information about an approaching hurricane?
RQ3: What is the overall frequency and duration of search for each graphic display element (current location, past track, forecast track, uncertainty cone)in the hurricane tracking map?
RQ4: What is the overall frequency and duration of search for each time horizon ranging from current status to five days in the hurricane tracking map?
22
RQ5: What is the frequency and duration of search for each hurricane parameter (distance to Port Isabel, distance to Sabine Pass, forward movement speed, intensity and hurricane wind radius) in the hurricane parameter table?
RQ6: What is the frequency and duration of search for each time horizon ranging from current status to five daysin the hurricane parameter table?
RQ7: Are there scenario order effects (in which a given hurricane scenario gets a different response, depending on whether it is first or last)?
2. Research hypotheses and questions related to judgment of strike probabilities (ps) and protective action recommendations (PARs)
RH1: The variance among participants in their strike probability (ps) judgments for each target city will decrease over forecast advisories (from 1-6), as each hurricane approaches the point of landfall (i.e., there will be increasing agreement about landfall location).
RH2: Participants will assign non-zero strike probabilities to cities that are not located in the direction that a hurricane is heading.
RH3: The number of protective action recommendations (PARs) will increase over forecast advisories (from 1-6) as each hurricane approaches the point of landfall, but the slopes of the curve will be higher for scenarios in which the hurricane strikes the participant’s location than for scenarios in which the hurricane strikes a distant location.
23
RH4: The number of PARs will be positively correlated with the respondents’ judgments of ps for their own jurisdictions.
RH5: All participants will activate the emergency operation center (EOC) on the first forecast advisory.
RQ8: Will participants make different protective action decisionsfor different hurricane scenarios?
RQ9: Will Σps ≤ 1, since the target locations are not an exhaustive list of all possible points of landfall even though they are mutually exclusive?
RQ10: Will participants’ demographic characteristics (age, gender, permanent residence, hurricane experience, or evacuation experience) account for differences in their judgments of ps and PARs?
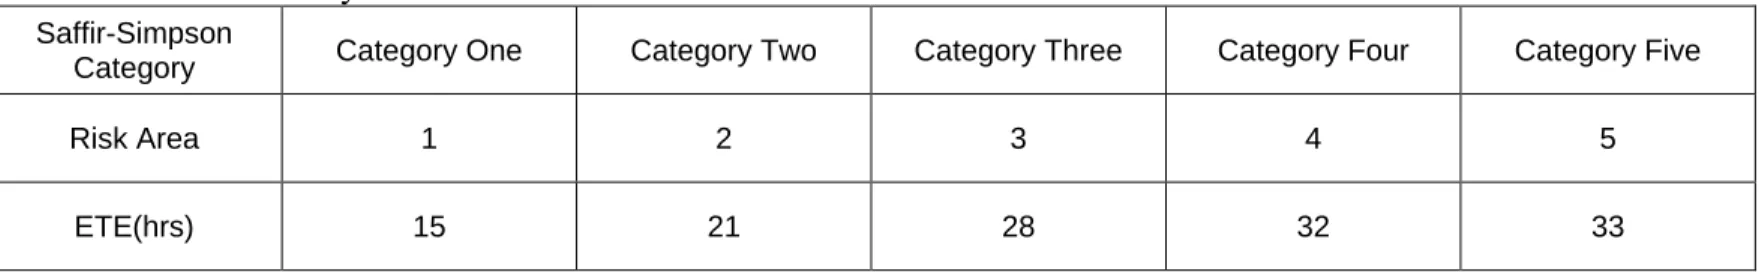
RQ11: What is the percentage of participants that evacuate the appropriate number of risk areas (e.g., Risk Areas 1-4 for a CAT 4 hurricane) before that evacuation time estimate deadline (i.e., at least 32 hours before storm arrival for both counties)?
24 CHAPTER III
METHODS 3.1 Procedure
This research was performed in a laboratory setting using a non-probability (convenience) sample of 80 experiment participants recruited from the population of Texas A&M University students, each of whom was paid $20 for participating in the experiment3. There are two reasons for using a non-probability sampling technique for this study. First, the principal objective of this study is to test people’s cognitive processes in a dynamic hurricane tracking task. We believe that university students, like the general public, are able to provide reasonable data on this topic. Second, this is a pilot study that will allow researchers to obtain basic data and identify trends in hurricane tracking without the complications of using a random probability sample. Thus, the experimenter posted recruiting flyers on bulletin boards around the Texas A&M campus and personally distributed these recruiting flyers on campus. The recruiting process continued until 80 participants successfully completed the experiment4.
Each participant was assigned to one of the eight conditions by using a systematic
3 This experiment was complete voluntary. The incentives for this experiment were not only limited to the
20 dollars payment. The experimenter also explained in the debriefing statement and the informed consent declaration to the participants in the very beginning of the experiment that there is a need for hurricane information search studies and indicated that the data would be confidential. These might have increased participants’ motivation to contribute to this study.
4 After each participant finished the experiment, the experimenter exported the data from the DynaSearch
program into Excel spreadsheets and checked if each participant had finished all the tasks properly. If not, the data were marked as invalid data and excluded from the data analyses. The experimenter then
reassigns the same experimental condition to the next available participant. In total, there were 98 participants in the experiment, with 80 of them finishing the experiment successfully.
25
random assignment method. The experimenter assigned random identification (ID) number in the range from 0.00 to 100.00 to each participant. Then, the experimenter assigned the first participants to conditions based on their ID numbers. Since there are eight conditions, participants with ID number from 0.00 to 12.50 were assigned to condition 1, IDs from 12.51 to 25.00 were assigned to condition 2 and so on so forth. The experimenter assigned participants to conditions beginning with the one who signed up for the experiment first. When one of the conditions reached 10 participants, the experimenter reallocated the ranges for the random numbers from eight ranges to seven ranges and assigned participants to the remaining seven conditions. This process continued until each condition had10 participants. This random assignment process allowed the researcher to probabilistically rule out any plausible rival hypotheses that result from participants’ personal characteristics such as gender, race, or age. In other words, random assignment makes the participants’ attributes in each condition statistically equivalent. Therefore, any differences observed on the dependent variables are most likely due to the treatment effects from the between and with-in subject manipulations.
Before the participants began, the experimenter displayed four documents in each participant’s workstation. These were (1) a sign identifying which county EOC the participant represented; (2) a hurricane evacuation time estimate (ETE) table (Table B1 or Table B2) from Lindell et al. (2002), (3) a hurricane risk area map (Figure A4 or Figure A5), and a Gulf of Mexico counties map (Figure A6). Half of the experiment participants saw the display documents for Jefferson County; the other half of the participants saw the display documents for Cameron County. All participants saw the same Gulf of Mexico
26
counties map that shows all the U.S. counties that around the Gulf of Mexico. These documents were posted on the walls of each participant’s workstation throughout the experiment. The participants were able to examine the maps and the ETE table during the experiment. The participants also read The Local Official’s Guide to Making Hurricane Evacuation Decisions and took the Hurricane Knowledge Test (HKT) before the
experiment (Lindell et al, 2008)5. These materials allowed participants to acquire basic knowledge about hurricanes and appropriate protective actions for coastal counties. After participants had read the Official’s Guide and taken the HKT, the experimenter gave them a city classification sheet. The participants could use the hurricane risk area map to identify the cities within their jurisdictions. This task was designed to enhance each participant’s ability to recognize the location of their county on the maps. After completing these preliminary tasks, the participants began the hurricane tracking experiment using a computer program called DynaSearch. This program has been developed by the Texas
A&M University Hazard Reduction and Recovery Center in conjunction with Clemson University Savage Visualization Laboratory6. For this experiment, DynaSearch was set up to present the participants with four different hurricane scenarios. Each of the four hurricane scenarios had six forecast advisories and each advisory represented a single day rather than the six-hour period that the NHC forecast advisories represent. The one-day
5 The Local Official’s Guide to Making Hurricane Evacuation Decisions is a document that developed by
Lindell, and Prater (2012). This Official’s Guide is based on a document developed for the Texas Governor’s Division of Emergency Management. Along with the Local Official’s Guide, they also developed the Hurricane Knowledge Test to evaluate readers’ understanding of the material in the official’s guide.
27
time interval was used instead of the six-hour time interval to move the hurricanes scenario at a pace that seemed most likely to maintain participants’ interest. Thus, the first forecast advisory was seven days before the hurricane made landfall and the sixth forecast advisory was one day before the hurricane made landfall. Each hurricane forecast advisory provided the hurricane’s current information and the forecast information for the following five days. DynaSearch can display a hurricane parameter table, a Gulf of Mexico hurricane
tracking map and an NHC watch/warning message box on a single forecast advisory screen (Figure A7). For each forecast advisory screen, the participants had five minutes to view the information. The hurricane parameter tables displayed each cell’s content as numbers or verbal labels. In this application, the participants viewed a grid whose rows represented different hurricane parameters and the columns represented different forecast time horizons. DynaSearch provides a function that allows the cells in the grid are blank
until the user moves the mouse cursor over the cell and clicks it. The information disappears when the user releases the mouse button. It is important to recognize that the contents of each cell changed over time as the participant progresses through the hurricane forecast advisory pages because Patrick and James (2004) have noted that process tracing has not previously been used in studies of dynamic decision making and a more recent literature search supports this conclusion. Moreover, DynaSearch’s hurricane tracking
map display provides information in graphic form—a feature that does not appear to have been used in previous process tracing studies (see Schulte-Mecklenbeck et al., 2011). Similar to the process for viewing cells in the information board, the tracking map displays no visible information about a hurricane until the participant moves the mouse cursor over
28
the desired element in the map legend table below the tracking map. Checking an element allows the participant to view a hurricane’s current location, its forecast track, and uncertainty cone for each of the next five days and the past track for previous 5 days.
DynaSearch records the order and the amount of time a participant spends viewing each
cell in the hurricane parameter, each feature in the map legend and the watch/warning text box. After each forecast advisory page, DynaSearch displayed two sets of questions to
obtain the participants’ judgments about hurricane strike probability for six locations around the Gulf of Mexico and 11 protective actions for the county to which he/she was assigned.
After the information search task and making decisions about ps and PARs,
participants then proceeded to a final questionnaire page that asked them to report the extent to which they used each feature that was available on the hurricane forecast advisory pages (Not at all =1 to Very great extent =5). Participants also completed 11
perceived workload questions on this questionnaire page. These questions asked them to rate the amount of information displayed, the way the information was displayed, task difficulty, task time pressure, mental activity required by the task, physical activity required by the task, their overall workload, frustration level, stress level, and their overall performance.
This experiment was concluded by obtaining four demographic variables—years of education, sex, hometown (high school location), citizenship, and three questions on
29
hurricane experiences7. After the experiment was complete, the experimenter was able to extract the dependent variables (hurricane parameter table search data, hurricane tracking map search data, watch/warning text box search data, ps data, and PARs data) from each
participant’s .txt data file and use SPSS to analyze the data. 3.2 Experiment Design
This study is a four-factor experimental design—2 (location) x 4(hurricane scenario) x 4 (scenario sequence) x 6 (forecast advisories). This experiment is a mixed design; hurricane scenario and forecast advisory are within-subject factors whereas location and hurricane sequence are between-subject factors. For the within-subject design, all participants will receive four different hurricane scenarios during the experiment. Hurricane A tracks directly toward Cameron County; Hurricane B tracks directly toward Jefferson County; Hurricane C tracks to a point roughly 140 miles between these counties. Hurricane D tracks toward New Orleans, Louisiana. The four different hurricane scenarios are counterbalanced to control order effects (Order 1=CADB; Order 2= ABCD; Order 3=DCBA; and Order4=DBAC)8. Finally, for the location factor, participants were randomly assigned to play the role of an Emergency Management Coordinator in either the Cameron County TX or Jefferson County TX Emergency
7These included the experiences on personal loss, property loss and evacuation due to hurricane.
8 These hurricane scenarios will be recoded into hurricane alpha to delta for the purpose of testing some of
the research questions and research hypotheses. Hurricane Alpha is a hurricane that tracks directly toward the county to which a participant is assigned; Hurricane Beta is a hurricane that tracks roughly 140 miles away from the county to which a participant is assigned; Hurricane Gamma is a hurricane that tracks toward the other county (i.e., a point that is 280 miles away from the county that a participant is assigned); and Hurricane Delta is Hurricane D.
30
Operation Center (EOC).All hurricanes originated at points that are approximately 750 miles (144 hours of travel time) from the U.S. Gulf coast and have approximately the same average forward movement speed, radius of hurricane wind and tropical storm wind. There were slight variations from one forecast advisory to the next in order to more closely simulate the changing behavior of actual hurricanes. However, all hurricane scenarios had the same pattern of change in hurricane category over forecast advisories.
The first set of dependent variables comprised five hurricane parameters from the hurricane parameter table: (1) Distance to Port Isabel (Cameron County), (2) Distance to Sabine Pass (Jefferson County), (3) Forward Movement Speed, (4) Hurricane Category, and (5) Hurricane wind Size. The second set of dependent variables came from the hurricane tracking map: (1) Current Location, (2) Past Track, (3) Forecast Track, and (4) Uncertainty Cone. The third set of the dependent variables were the watch/warning text messages. By calculating the click count and click duration for the cells in the hurricane parameter table, the map legend and watch/warning text box, the researcher could assess the importance that each participant attached to each hurricane parameter, map element, and text message. The fourth set of dependent variables comprised the hurricane strike probability judgments for six cities around the Gulf of Mexico: Tampa, Apalachicola, New Orleans, Beaumont/Port Arthur, Brownsville and Tampico (Figure 3.3.3). The fifth set of the dependent variables consisted of the eleven protective action recommendations (PARs). These are (1) activate the EOC, (2) activate the emergency alert system, (3) advise beach motel/hotel businesses of the potential storm, emergency evacuation may be required, (4) recommend schools to close tomorrow, (5) recommend immediate activation
31
of public shelter, (6) recommend immediate evacuation of the following residents: people with special needs, people without transportation, tourists, mobile homes, and recreational vehicles, (7) recommend immediate evacuation of the general population in Risk Area 1, (8) recommend immediate evacuation of the general population in Risk Area 2, (9) recommend immediate evacuation of the general population in Risk Area 3, (10) recommend immediate evacuation of the general population in Risk Area 4, (11) recommend immediate evacuation of the general population in Risk Area 5. Thus, this experiment provided information about the participants’ search patterns for numeric and graphic information, strike probability judgments, and protective action decisions during a simulated hurricane scenario. Figure A8 shows the relationship among independent variables and the dependent variables.
3.3 Analytic Method and Sample Size
Student t-test was used for RH2 and RQ9; bivariate correlation was used for RH4; ANOVA (Analysis of Variance) was used for RH1, RH3, RQ1, RQ3, RQ4, RQ5, RQ6, RQ8, and RQ11; and MANOVA (Multivariate Analysis of Variance) was used for RQ2, RQ7 and RQ10. There are several reasons for using MANOVA over multiple ANOVA for these three research questions. First, using multiple ANOVAs can inflate the overall type I error rate (α)9. Second, MANOVA can be used to test interaction effects on multiple DVs. Thus for a given sample size, MANOVA has greater statistical power then ANOVA
9 Type I error rate (α): the probability of falsely rejecting the null hypothesis when the null hypothesis is
32
because MANOVA accounts for the covariance of DVs (Baguley, 2004; Chartier & Allaire, 2007). Researchers should also determine an appropriate sample size before collecting data. This requires setting the type I error (α) rate and type II error (β) rate10 before the sampling process. The α rate and β rate are usually arbitrarily set as .05 and .20. β is important because it determines the statistical power (π) for the analysis, which is 1- β. The statistical power is the probability that an analysis will reject the null hypothesis when it is false. Generally a larger sample size has a smaller variance and can therefore improve the chance of detecting an effect of a given size (Tabachnick & Fidell, 2001). In practice, however, time and budget constraints limit a study’s sample size, so researchers use statistical power analysis to determine the minimum sample size needed for conducting a statistical analysis. In this experiment, MANOVA will be used to detect mean differences, so four multivariate inferential statistics will be used. These statistics are as follows (Srivastava, 1983; Marcoulides& Hershberger, 1997; Young, 2006).
1) Wilks’ Lambda :ᴧ = │W│
│B+W│ ,
2) Pillai’s Trace: V = trace (B (B + W)-1),
3) Hotelling-Lawley Trace: T = trace (W -1 B),
4) Roy’s largest root: θ= W -1 B
W is the within-groups sums of squares and crossproducts (SSCP) matrix and B is the between-groups SSCP matrix (Srivastava, 1983; Marcoulides & Hershberger, 1997;
10 Type II error rate (β): the probability of failing to reject the null hypothesis when the null is actually
33
Young, 2006). The Wilks’ ᴧ test shows the dependent variables’ variance by the independent variables; the Pillai’s trace shows the dependent variables’ variance by the largest separation of the independent variables; the Hotelling-Lawley trace is usually used when an independent variable has two groups; and the Roy’s largest root shows the dependent variable’s variance by the largest eigenvalue (Anderson, 2003).
When estimating the sample size for a statistical analysis, a researcher must select a statistic that will later be used to assess statistical significance. Among the four statistics listed above, Wilks’ ᴧ is the most widely used statistic for MANOVA (Olson, 1974; Stevens, 2002). Young (2006) used Monte Carlo simulation to conduct a series of factorial MANOVA statistical power analyses by calculating the ranges of minimum sample size per independent variable based on α level, statistical power (1-β), effect size and number of dependent variables for Wilks' ᴧ. Since the design of the present study makes an effect very easy to be visualized and noticed, the effect size will be set to be a very large ES11. In addition, this research will follow the conventional levels of the critical values for α (.05) and 1-β (.80). By using the sample size range tables that Hair et al. (2009) provided, the sample size range for this experiment is from 14 to 23 per group. Therefore, the total
11 The effect size (ES) is the degree to which H
0 is false is indexed by the discrepancy between H0 and Ha
(Cohen, 1992). Cohen (1992) provided a table for social science researchers to choose an ES based on the statistical test to be used and the levels of the visibility of an effect. The author identified three levels of the effect size—small, medium and large—stating “a medium ES represents an effect likely to be visible to the naked eye of a careful observer….the small ES to be noticeably smaller than medium but not so small as to be trivial, and the large ES to be the same distance above medium as small was below it. “ Hair et. al., (2009) includes four levels of the effect size for MANOVA analysis which are very large, large, medium and small.
34
sample size for this experiment will be 8012.The Ford et al. (1989) review of a series of 35 process tracing studies revealed that there were only nine studies with a sample size greater than 80. Therefore the sample size is above the average for most of the Ford et al. (1989) process tracing studies. In addition, the within-subject manipulation requires all participants to make their judgments on four different hurricane scenarios. This within-subject manipulation provides increased power to detect a given effect size.
12 Power analyses were conducted for each student t-test and ANOVA test as well by using an online tool
developed by the Institute for Social Research, York University, Canada
(http://www.math.yorku.ca/SCS/Online/power/). The statistical power for each analysis is different depending on the analysis for each RH and RQ; however, all of them are above .80.
35 CHAPTER IV
RESULTS 4.1 Experiment Results on Information Search
In response to RQ 1, the statistical analyses results indicates that there was a significant difference on the information search for the hurricane advisories (click count: F2,158 = 159.50, p< .01; click duration: F2,158 = 35.32, p< .01). Table B3 shows the average
click count for each hurricane forecast advisory element. DynaSearch recorded more
clicks on the hurricane parameter table cells (M= 1