3D CHARACTERIZATION OF WOOD BASED FIBROUS MATERIALS:
AN APPLICATION
J
ÉRÔMEL
UX1,C
HRISTINED
ELISÉE2 ANDX
AVIERT
HIBAULT31TREFLE UMR 8508, Esplanade des Arts et Métiers 33405 Talence Cedex, France,2LRBB UMR 5103,
Domaine de l’Hermitage, 69 route d’Arcachon 33610 Cestas Gazinet, France,3ESRF ID 19, BP20, 38043
Grenoble Cedex, France
e-mail: [email protected] (Accepted December 12, 2005)
ABSTRACT
Morphological characterization of wood based fibrous materials is carried out using X-ray tomography. This technique allows the non destructive observation at the scales of a fibre (microscopic scale) and of a network of fibres (mesoscopic scale). The 3D images are processed using classical tools of mathematical morphology. Measures of porosities and estimations of the size distributions of fibres and pores are carried out and compared to other results. An alternative method for the calculation of the local orientation of the fibres is also described to quantify the anisotropy of the fibres network. Finally, the individualization of the fibres is obtained from the representation of the fibrous network as a 3D skeleton, making possible further measurements on the isolated fibres.
Keywords: local orientation, mathematical morphology, segmentation, wood fibres, X-ray tomography.
INTRODUCTION
Natural fibres, and in particular wood fibres, occupy a considerable place in the sector of composites (1700 million tons of wood fibres produced every year in the world). Wood based fibrous materials cover a wide range of usual products such as papers, insulators or furniture elements. Some important factors affecting their physical and mechanical properties are the effective density, the geometry of the fibres, the nature of the contacts between the fibres and the architecture of the fibres network (Deliséeet al., 2001; Faesselet al., 2005).
Conventional industrial processes allow manufacturing thin boards with fibres oriented in planes parallel to the faces. If we consider the short term market requirements for such materials, this type of architecture is restrictive in particular from the point of view of thickness and density: indeed, thick insulating fibre boards may not be obtained without pasting and reducted density results in a decrease of the material cohesion. Prior to improve the performance of these materials and to design new ones, presenting a real 3D architecture, the interactions between process, structure and properties must be first understood.
An essential step is the observation and the quantification of the microstructure of individual fibres and of the fibres network. To this end, this paper capitalizes on classical tools which can be used for describing the 3D structure of fibrous materials. Information about fibres, pores and the fibres network
is extracted from 3D images obtained by X-ray tomography. It must be stressed that the structure of this fibrous material is rather complex and ‘confusing’. This is due to the random and very connected structure of the fibres network, and to the nature of the individual fibres. Indeed, wood fibres cover a wide range of sizes, shapes and internal porosities, which can be furthermore modified by the defibration process or during consolidation.
In the first part of the paper, 3D measurements are realised on binary images obtained from the original grey level images after cleaning and simple tresholding of the phases (i.e., void and fibres). Tools coming from classical mathematical morphology are used to provide 3D information on fibres and on the pores: granulometries, porosities, global and local orientations. Such measurements may be related to the manufacturing processes of the materials. Moreover, they allow computing of the macroscopic properties of the materials directly from 3D images or using 3D network models and estimating the size of a representative elementary volume (REV) with respect to the measured properties. See for example Lux et al.(2006) for the prediction of the effective thermal conductivity of wood insulators.
very difficult task. It is here realised from a 3D skeleton, viewed as a simpler representation of the actual structure. Measurements on isolated fibres are both complementary to those previously realised on the network and essential for the quantification of the microstructure. Indeed, experimental distributions of fibres length, number of contacts, tortuosity or orientation may constrain theoretical models of structures (Jeulin, 1998; Faessel et al., 2005) that can serve as support for the numerical calculation of effective properties.
MATERIALS AND METHODS
Wood-based fibrous composites used for thermal insulation are obtained through very different manufacturing processes governing their final density and the architecture of the microstructure. In this study, we concentrate on ultra light density fibre boards,1elaborated industrially through a wet process,
similar to the process used in papers production. The boards are constituted of maritime pine fibres (without glue), oriented in planes parallel to the faces. The fibres are composed of both isolated fibres and sticks (aggregation of several fibres) and they show a variable internal porosity referred to as the lumen. The effective density of the fibre boards is about 170 kg m−3.
This study benefits from X-ray synchrotron computed microtomography to characterize the microstructure of the fibrous media. Data acquisition is performed at the European Synchrotron Radiation Facility (ESRF) on the ID19 beam line. A description of this experimental technique may be found in Coles (1999). A monochromatic coherent beam is used to get sample radiographies for 1500 angular sample position equally spaced from 0 to 180 degree. An X-ray of 12 keV (wavelength 1.03 Angstrom) was chosen to ensure high enough signal to noise ratio. The energy selection is realized by a classical double mono-crystal (Si 111) device. The exposure time is 2 sec by projection. A typical acquisition is 60 min long. A thin scintillation layer deposit on a glass converts X-ray to visible light. Light optics magnify the image of the scintillation screen and project it onto the CCD. This CCD is the key of the fast readout low noise charge couples device (FReLoN CCD). Camera developed by the ESRF detector group (2048x2048 elements, 14 bits dynamic). With such a setup the resolution is 4.91 microns by pixel. A filtered back-projection algorithm (Herman, 1980; Natterer, 1986) is used to compute the three dimensional mapping of linear absorption coefficient in the sample.
To fit the microtomograph setup, cylindrical samples of diameter and height up to 10 mm are carefully cut in the raw media with a rotary punch, so that the microstructure of the materials is preserved. After reconstruction, the size of the 3D grey level images obtained is 20483 voxels, giving files of
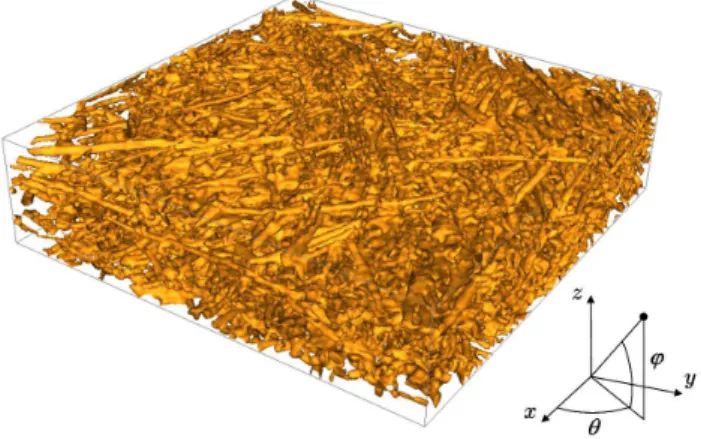
size 8 Go. Smaller volumes are then extracted in the core of the sample, both to reduce the size of the file for its exploitation and to avoid the surface modifications induced by the material cutting. The fibres are composed of a ‘succession’ of lumens and wood-cell walls, which are as small as noise. Alternate sequential or median filters are then not suitable to suppress the noise and one may use a filter by reconstruction (Serra and Vincent, 1992) in order to preserve the fibres contours. Fig. 1 shows the 3D rendering of a thin sample of wood insulator.
Classical image analysis tools derived from mathematical morphology (Matheron, 1967; Serra, 1982) are then used to process 3D images obtained and to recover information on the pores and the fibres.
Fig. 1.3D visualization of a sample of size2.5×2.5×
0.2mm3.
MORPHOLOGICAL ANALYSIS
In this part, morphological operations are used to characterize the fibrous materials in different ways. Particularly, we propose a new algorithm for the detection of local orientations and the quantification of anisotropy. It is also shown that there exist representative elementary volumes (REV) for every measured property. Furthermore the obtained information can be useful for simulating of fibre materials (Jeulin, 1998; Wang and Shaler, 1998; Faesselet al., 2005), or for identifying local physical properties of wood fibres.
POROSITIES
Two porosities must be considered that correspond to different spatial scale. The first, referred to as the fibre porosity, is related to the volume fraction of the lumens. It is expressed for convenience in percentage of the volume of filled fibre (volume of the fibre walls added to the volume of the lumens). The second is the volume fraction of air lying outside of the fibres; it is referred simply as the porosity. This distinction is useful as it is easier and sometimes necessary to consider homogenized fibre, especially at low resolutions where lumens may not be distinguished anymore. Furthermore, from an image analysis standpoint, the distribution of fibre diameters or the skeleton have a sense only when computed on filled fibres.
The process to segment the lumen from the background is straightforward; first a dilation of small size disconnects the lumen from the outer porosity. Then a closing by reconstruction fills the lumen without modifying the fibres contours. Finally, an erosion is performed to end the closing process. Fig. 2 illustrates the filling process on a longitudinal section of the material. An estimate of the fibre porosity is computed by a simple measure of the image volume before and after lumens filling.
(a) (b)
Fig. 2.Longitudinal section (2.5×2.5mm2) before (a)
and after (b) the filling of lumens.
Fig. 3 shows the evolution of the porosity and fibre porosity versus the size of the treated volume. The stabilization of these two parameters occurs from a volume over 0.5 mm3 (1.26×1.26×0.31). The
porosity of the tested sample is around 76% and the mean value of the fibre porosity, around 28%, is in agreement with values given in Castéraet al.(2000).
GRANULOMETRY
In this section, information about the size of fibres and pores is obtained from binary images relying on classical tools from mathematical morphology.
The size distribution of the grains of a setX can be assessed through successive openings (Serra, 1982) by a structuring element (i.e., an arbitrary set of voxel) of growing size. This is referred to as granulometry by openings and it consists in measuring the volume fraction of the setX which is smaller than the chosen structuring element. The cumulated size distribution G(X,λ) of a set X is defined as (Matheron, 1967;
Serra, 1982):
G(X,λ) =1−V
¡ γBλ(X)
¢
V(X) , (1)
whereBλ is the structuring element of sizeλ,V(X)is
the volume of the setX andγBλ(X) the opening ofX
byBλ.
If X is the set of fibres and Bλ the Euclidean
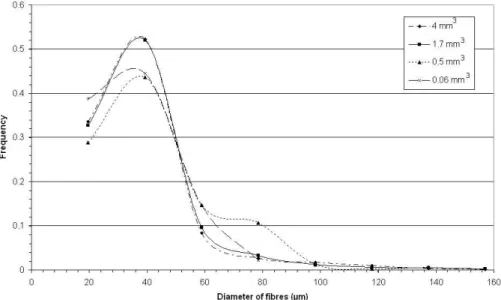
ball of radiusλ, the granulometry carries information about the distribution of the diameter of the fibres. The results in Fig. 4 show granulometries computed on different volume sizes. The stabilization of the distribution occurs at volumes of 1.68 mm3 (1.89×1.89×0.47). The mean diameter of the
stabilized distribution is 37.6 µm and the standard deviation is 8.2µm. Wang and Shaler (1998) fitted the distributionin number(i.e., the count of the number of objects with a givenmeanradius) with a normal law, but this is not the case of the distribution in measure obtained here, according to theχ2test. In other words,
some refinements (for exemple the segmentation of the fibres) are obviously required in order to further approach the concept of fibre diameter. However, the measured mean value of fibres diameter is in
agreement with a previous characterization realised on the same population of fibres2in wood based insulators
(see also Deliséeet al., 2001), where a mean diameter of 31.7µm was observed (not accounting for sticks).
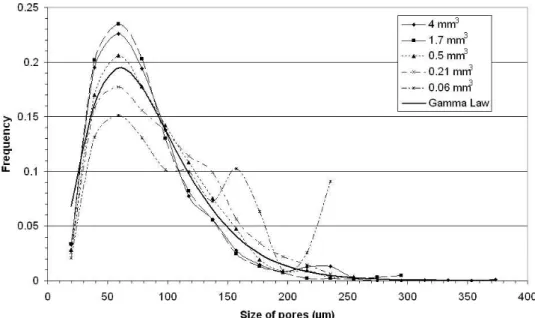
Granulometric curves are computed similarly on the pore space. However, due to the high connectivity of the pores and to their highly variable shape, the granulometry is not representative of an actual pore size distribution. It shall rather be related to the minimal distance between the fibres. The results in Fig. 5 show the stabilization of the distribution at a volume of 1.68 mm3 (1.89×1.89×0.47). The mean
size of the pores is 41.5µm and the standard deviation is 22.8µm. The distribution can be fitted by a gamma law widely used to model pore size distribution in papers (Dodson and Sampson, 1996). There is a close relation between the manufacturing process and the inter fibre distance distribution. Indeed, for a process other than papers process, a gaussian distribution has been observed in an other insulating fibre board (Lux et al., 2006).
Although granulometries performed on binary images cannot be straightforwardly related to actual fibre (resp. pore) size distribution, they provide some quite useful information:
– The mean size of the fibres compares well to values obtained with different methods. It is accordingly a good indicator of the size of the fibres. The comparison with object-based measures shall be possible relying on segmented images. This is addressed further in this paper.
Fig. 4. Evolution of the distribution of the diameter of fibres with the size of the treated volume.
Fig. 5.Evolution of the distribution of the size of the pores with the size of the treated volume.
– The inter-fibre distance distribution is related to the manufacturing process,
– REV of a size of about 1.68 mm3 (1.89×1.89×0.47) has been determined for the
measured properties.
AN ALTERNATIVE DEFINITION FOR THE LOCAL ORIENTATION
The local orientation of fibres is an important parameter since the physical properties of fibres are often orthotropic. This is the case for the mechanical and thermal properties of wood fibres (Siau, 1984). The computation of the local orientation field thus allows determining the local physical properties. It is also interesting because it is an indicator of the medium anisotropy complementing other global methods, like the rose of directions or covariograms analysis.
Previous definition
The original definition is due to Soille and Talbot (2001) in the case of grey level image analysis. Letx be a pixel that belongs to a structure brighter than the background in an image noted f. Its local orientation, notedDS
λ(f) (x), is the directionαof the segmentLλ,α
of length λ minimizing the difference of grey level between the original image f and the opened image by Lλ,α, denoted as γλ,α(f), at the same location. It
may be written as:
DSλ(f)(x) =αiifγλ,αi(f) (x)≥γλ,αj(f) (x),∀i6= j,
(2)
where γλ,αi(f) (x) is the grey level of voxel x
belonging to the opened image.
The segment lengthλhas to be chosen accordingly to the size of the objects in the image. If different scales coexist in the same image, this definition may therefore not be able to give good results. This is particularly pronounced in the case of binary images even with objects of very similar sizes, as γλ,αi(f) (x) can only
take two values, 0 or 1. Fig. 6 illustrates this on a simple binary 2D image, where the four directions of the square grid are tested only. The length of the segment was chosen to be of 19 pixels. The grey pixels indicate that no orientation can be determined at this location, due to that :
– either all the values ofγλ,αi(f) (x),∀iare zero (λ
is too large),
– or there exist at least two directionsαi for which γλ,αi(f) (x) =1 (λ is too small).
Extension to multi-scale binary images
In order to work on binary multi-scale images, we propose a modified definition that consists in increasing the length of the segment until one value ofγλ,αi(f) (x) =1.
First a local direction notedDγλ(f) (x)of the pixel
xwith respect to the segment of lengthλ is defined:
Dγλ(f) (x) = ½
αiifγλ,αi(f) (x)>γλ,αj(f) (x),∀i6= j
Ø otherwise
(3) Then, beginning with the unitary segment, λ is increased until Dγλ is defined. The local orientation Dγ(f) (x)may therefore be written as:
Dγ(f) (x) =nα|Dγλ−1(f) (x) =Ø andDγλ(f) (x) =αo
(4) withα ={θ,ϕ}(see Fig. 1).
The previous algorithm is applied to the test image, but there remains pixels for which two or more directions are equivalent. They are marked as undetermined. Nonetheless, they may be provided with an orientation corresponding to the most probable orientation of their 3×3 neighbourhood. Fig. 7
presents the final local orientation field, after the interpolating step. We may however notice that some orientations do not correspond to the expected values, especially nearly points of inflexion. The use of openings indeed implies that the orientation of a pixel is the orientation of the largest segment included in the object and intersecting the considered point. The orientation of a pixel thus does not always depend on its close neighbourhood, but reflects a more global directional property of the object.
Fig. 7.Local orientation field obtained by openings.
A variated definition using erosions
In order to retrieve a local directionnal property, we propose the following definition for the local orientation of a voxel in a binary image :
The orientation of a pointx∈Xis the orientation of
the largest segment that is included inX andcentered atx.
This definition is equivalent to the expressions in Eqs. 3,4 but with erosion taking the place of opening. The difference between the two approaches is illustrated in Fig. 8.
Fig. 8. The orientation by opening (orientation of segment 1) clearly depends on the morphology of the whole object whereas the results of the orientation by erosion (orientation of segment 2) depends on a sufficiently large neighborhood of x.
The local direction by erosion, notedDελ(f) (x), of a pixel x with respect to the segment of length λ, is given by:
Dελ(f) (x) = ½
αiifελ,αi(f) (x)>ελ,αj(f) (x),∀i6= j
Ø otherwise
(5) In the same way as above, the local direction Dε(f) (x)is given by:
Dε(f) (x) =©
α|Dελ−1(f) (x) =Ø andDελ(f) (x) =αª
(6) The result of this algorithm applied to the test image is presented in Fig. 9. We may notice that the local orientation field by erosions is much more realistic than the one previously obtained by openings.
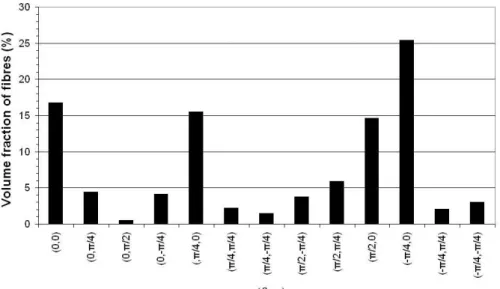
Finally, Fig. 10 presents the results of the detection of the 13 unbiased directions of the cubic lattice on a 3D image of size 2.5×2.5×1.3 mm3. Fig. 11 shows
the distribution of the local orientation. These results highlight the anisotropy of this type of insulating materials. More than 70% of the voxels of the fibres are oriented in the xOy plane (longitudinal planes) while less than 1% of the voxels are oriented along the Ozaxis (transverse direction of the fibre board). This result was expected since the material is compressed along theOzaxis during the manufacturing process.
Fig. 10.Local orientation field on a 3D sample of the fibrous medium.
The simple, yet efficient tool, presented here allows to test the local directional properties of a multi-scale binary image and provides a quantitative characterization of the anisotropy of complex
materials. The directional informations may also be used to compute the local physical properties of the fibres. See Lux et al. (2006) for an exemple of computation of the local thermal conductivity field of wood based fibrous materials.
COVARIOGRAMS
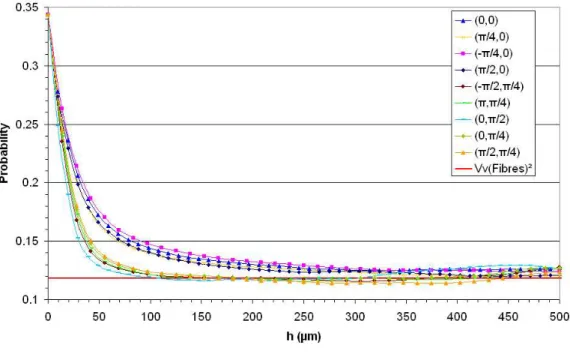
To further investigate the concept of REV, we may evaluate the correlation length with the help of covariance. The covariance is the probability for two points of distance h to belong to the same phase. It provides useful informations about the state of dispersion of the considered phase (Matheron, 1967; Serra, 1982) altogether as an estimation of correlation length. Indeed, when the correlation between the events{x∈X}and{x+h∈X}vanishes,
the covariance curve tends to an asymptote of equation y = VV2(X), where VV(X) is the volume fraction
of set X. Fig. 12 shows the covariograms (i.e., the representation of the covariance along one direction) computed on a sufficiently large image, for each of the 13 directions of the cubic lattice. From these curves the correlation length may be estimated as about 400 µm (longitudinal direction) and 100 µm (transverse direction). The representative scales for porosity and granulometry are thus compatible with an estimation of a REV based on covariance analysis. The REV determined previously contains about 4 correlation lengths and its size is influenced by the anisotropy of the fibrous network. The covariograms also indicate a strong anisotropy of the fibre board. This is in agreement with the observation coming from the local orientation field.
Fig. 12.Covariograms for all tested directions.
DISCUSSION
Our objective was to examine the informations readily available by classical morphological measurements realised on phase-segmented image. This leads us in particular to introduce alternative definitions of the local direction suited to multi-scale binary images and based on simple operations like erosion and opening. The direct measurement of the porosity of the fibre board and of the wood fibre is consistent with the expected values, although a better accuracy (for fibres porosity) could be achieved with a higher image resolution. The granulometric information concerning the fibres provides an estimation of the size of fibres and shows that the mean value of the fibre diameter is consistent with other results obtained by different methods. Concerning the pore size distribution, the shape of the curve (here a gamma law) shows the influence of the manufacturing process on the structure as well as the random nature of the material. Moreover, all of these results reveal the existence of representative volumes for the different properties.
All the information obtained above has been measured on phase (void vs. solid) segmented images. This information may be ultimately complemented and/or refined by measurements on an ‘objects basis’ segmented image, i.e., an image where elementary components (fibres) are individualized. The availability of such an object segmented image allows to measure the number of fibres contacts, the distribution of fibres length or the fibres tortuosity,
etc... Toward that end we briefly discuss hereafter an example of approach leading to the individualization of the fibres.
The complexity of the studied material makes image segmentation a difficult task. Therefore, one may opt for a segmentation process relying on a simpler representation of the image. Here, the curve skeleton is chosen as the basis for the segmentation. The segmented skeleton is then used as a marker in the original image.
The skeleton provides a compact representation of an object, preserving its geometry (via the concept of end-points) and topology. The skeleton is defined by the centers of maximal balls (Serra, 1982). Generally this definition leads to surface skeletons for 3D objects. For this reason, the skeleton is accordingly commonly searched as a set of desired properties. Here, we follow Pudney (1998) and call skeleton of a setX an object topologically equivalent to the original image, thin in the sense of a line of 1 voxel thickness (thinness) and centrally located inX (medialness). In this work the curve skeleton is obtained through a parallel algorithm based on the work of Palágyi and Kuba (1998) (homotopic thinnig) and calling in the concepts of simple andP−simple points (Bertrand and
Fig. 13.Skeleton computed on an image of2.5×2.5×
1.3mm3.
The voxels of the skeleton are classified into branches and nodes. To do so, we use the concept of
λ-adjacency (Lianget al., 2000) to prevent clustering effect (Le Trong, 2003; Le Trong et al., 2005). A branch is a set of λ-connected voxels having at most 2 λ-neighbours and a node is a set of λ -connected voxels having more than 2 λ-neighbours. The local direction of branches adjacent to the same node is computed in the manner of Le Trong (2003) (see Fig. 14). This directional information allows merging in a same fibre the branches showing the most similar orientations among all possible pairs. This segmentation process is here illustrated in a 2D image (Fig. 16), highlighting that, at least from a visual point of view, the segmentation is satisfying.
Fig. 14. Computation of the normal vectors of the branches adjacent to an intersection
(a) (b) (c)
Fig. 15. Skeleton of a 2D simple image (a), segmentation results with full merging of branches adjacent to a 3-node (b) and with merging of only two branches adjacent to a 3-node (c). The nodes are coloured in red.
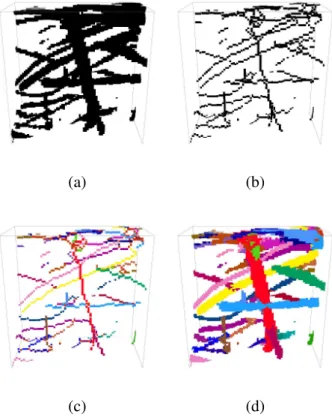
We present in Fig. 16 a first segmentation result on a small 3D image of the insulating material of size 1.3×1.3×0.6 mm3, for visualization purpose. The
final segmented image (Fig. 16d) is simply obtained by geodesic dilatation of the segmented skeleton (Fig. 16c) inside the original image (Fig. 16a). This result is quite encouraging, even though some fibres appear to be over segmented.
(a) (b)
(c) (d)
Fig. 16.Example of the segmentation process. Original image (a), skeleton (b), segmented skeleton (c) and final segmented image (d).
to be around 253 per mm3. We may then compute the
mass of the ‘average fibre’ with the available value of average fibre length, fibre porosity (28%) and wood cell-wall density (1530 kg m−3). Knowing the number
of fibres per unit volume, it is then easy to calculate the density of an equivalent material constitued only with ‘average fibres’. Here we found a density of 172 kg m−3 which is close to the real density of the
fibre board (170 kg m−3). The same process was also
performed on another wood insulator with a lower density. We calculated a density of 30 kg m−3whereas
the real density is of 45 kg m−3.
The results above emphasize that the various measures allow approaching the real density of different fibre boards. This does not validate the above segmentation method but this is clearly a good indication that our results are consistent with a known macroscopic property.
CONCLUSION
This paper presents a preliminary 3D characterization of wood fibrous materials. The tomography technique is used to observe the microstructure in a non destructive way. Mathematical morphology is used to process the 3D images.
Classical measurements such as porosity and distributions of the fibre and pore sizes are computed. An alternative definition for the local orientation (i.e., the orientation of each voxel of the fibres) is proposed, allowing quantifying the anisotropy of a network in simple way. Besides, an estimation of representative volume is also provided and it is shown that the size of this REV is consistent with a covariance based estimation.
Towards complementing/refining the above characterization, a segmentation method is proposed in a more prospective discussion. The individual fibres are reconstructed from the 3D segmented skeleton of the structure. The proposed segmentation process, although far from being perfect, is very encouraging and allows in particular to retrieve the density of different insulating fibre boards. Some further improvements on skeleton computations, or the addition of other constraints for the merging of branches, for example based on granulometric or distance map informations, should improve the segmentation of 3D images of fibrous materials.
Extraction of the various information available in segmented images of different fibrous materials is currently pursued. We will next focus on the construction of 3D models derived from real networks
which will serve as a support for numerical analysis of effective thermal and mechanical properties.
ACKNOWLEDGEMENTS
The authors wish to thank the reviewers whose comments greatly improved this paper, as well as Dr. Yannick Anguy for his fruitful advices and contribution.
REFERENCES
Bertrand G (1995). Sufficient conditions for 3D parallel thinning algorithms. In: SPIE Vision Geometry IV, 2573:52–60.
Bertrand G, Malandain G (1994). A new characterization of three-dimensional simple points. Pattern Recogn Lett 15:169–75.
Castéra P, Jeulin D, Bos F, Michaud F, Delisée C (2000). On the role of microstructural morphology on the macroscopic properties of cellulosic fibrous materials. In: Proceedings of the International Conference on Wood and wood fiber Composites. Stuttgart, Germany. Coles M (1999). Experimental Methods in the Physical
Sciences, vol. 32. San Diego: Edited by P.-Z Wong, 301–36.
Delisée C, Jeulin D, Michaud F (2001). Caractérisation morphologique et porosité en 3D de matériaux fibreux cellulosiques. Comptes rendus de l’Academie des sciences Série IIB Mécanique 329:179–85.
Dodson C, Sampson W (1996). Modeling a class of stochastic porous media. Appl Math Lett 10:87–9. Faessel M, Delisée C, Bos F, Castéra P (2005). 3D
modelling of random cellulosic fibrous networks based on x-ray tomography and image analysis. Composites Sci Technol 65:1931–40.
Herman G (1980). Image Reconstruction from Projections. Arlington, VA, USA: Academic Press.
Jeulin D (1998). Probabilistic models of structures. In: Probamat-21st century : probabilities and materials. Perm, Russie.
Le Trong E (2003). Mise en oeuvre de modèles de réseaux 3D pour l’étude du transport binaire en milieux poreux. Ph.D. thesis, Université Bordeaux I no2775.
Le Trong E, Anguy Y (2005). Simplification d’images 3d de matériaux poreux en vue de leur caractérisation physique the phase-retrieval problem and the interpretation of the covariance. Rev Eur Gnie Civil 9:353–72.
media: Pore space partitioning based on morphological skeletonization. J Coll Interf Sci 221:13–24.
Lux J (2005). Comportement thermique macroscopique de milieux fibreux réels anisotropes : étude basée sur l’analyse d’images tridimensionnelles. Ph.D. thesis, Université Bordeaux I no3034.
Lux J, Ahmadi A, Gobbé C, Delisée C (2006). Macroscopic thermal properties of real fibrous materials : volume averaging method and 3D image analysis. Int J Heat Mass Transfer. Article in press.
Matheron G (1967). Eléments pour une théorie des milieux poreux. Paris: Masson.
Natterer F (1986). The mathematics of computerized tomography. New York: Wiley.
Palágyi K, Kuba A (1998). A 3D 6-subiteration thinning algorithm for extracting medial lines. Pattern Recogn
Lett 19:613–27.
Pudney C (1998). Distance-ordered homotopic thinning: A skeletonization algorithm for 3D digital images. Comput Vis Image Und 72:404–13.
Serra J (1982). Image analysis and mathematical morphology, vol. 1. London: Academic Press.
Serra J, Vincent L (1992). An overview of morphological filtering. Circ Syst Signal Pr 11:1153–60.
Siau JF (1984). Transport processes in wood. Springer series in wood science.
Soille P, Talbot H (2001). Directional morphological filtering. PAMI 23:1313–29.