EMC Corporation Corporate Headquarters: Hopkinton, MA 01748-9103 1
-508-435-1000
www.EMC.comVersion 5.7
Administration Guide
300-011-555
REV A01
Published December 2010
EMC believes the information in this publication is accurate as of its publication date. The information is subject to change without notice.
THE INFORMATION IN THIS PUBLICATION IS PROVIDED “AS IS.” EMC CORPORATION MAKES NO
REPRESENTATIONS OR WARRANTIES OF ANY KIND WITH RESPECT TO THE INFORMATION IN THIS PUBLICATION, AND SPECIFICALLY DISCLAIMS IMPLIED WARRANTIES OF MERCHANTABILITY OR FITNESS FOR A PARTICULAR PURPOSE.
Use, copying, and distribution of any EMC software described in this publication requires an applicable software license. For the most up-to-date regulatory document for your product line, go to the Technical Documentation and Advisories section on EMC Powerlink.
For the most up-to-date listing of EMC product names, see EMC Corporation Trademarks on EMC.com. All other trademarks used herein are the property of their respective owners.
Preface
Chapter 1
Security and
Port Settings
Ports and protocols ... 12
Overview ... 12
Server port settings... 14
GUI Client port settings... 14
Illuminator port settings... 15
Collector port settings... 16
Startup process ... 17
Security... 18
Encryption... 19
An encryption session... 19
Key Tool ... 20
Encryption from a web browser interface ... 21
Chapter 2
Configuring Data
Monitoring
Introduction to DPA data monitoring ... 24Data Collection and Discovery Wizards ... 24
Data collection and licensing ... 24
Requests ... 24
Testing credentials ... 24
Gathering historical data ... 24
Application Hosts ... 25
Prerequisites ... 25
Importing hosts from a CSV file... 25
Importing hosts from EMC Ionix ControlCenter... 26
Monitoring a single host... 28
Storage arrays... 30
EMC CLARiiON ... 30
EMC Symmetrix... 34
Monitoring storage arrays that use RecoverPoint ... 36
Applications ... 37
CA BrightStor ARCserve ... 37
CommVault Simpana ... 38
EMC NetWorker... 41
HP Data Protector ... 43
IBM Tivoli Storage Manager... 45
Oracle RMAN ... 49
Symantec Backup Exec... 51
Symantec NetBackup... 53
Symantec PureDisk... 55
EMC HomeBase ... 58
Microsoft Exchange Server ... 59
Verifying that backup application monitoring works ... 60
Databases... 61 Oracle ... 61 SQL Server ... 65 PostgreSQL... 68 RecoverPoint ... 72 System monitoring ... 73
Monitoring a Windows host remotely ... 73
Monitoring a host for system data... 75
Tape libraries... 77
Switches and I/O Devices... 80
Fibre Channel switches ... 80
IP switches... 81
Xsigo I/O Director ... 81
File Servers ... 83
Celerra... 83
Network Appliance Filers... 84
Backup appliances... 86
EMC Disk Libraries... 86
EMC Data Domain... 87
NetApp NearStore ... 89
Fujitsu ETERNUS CS... 89
FalconStor Virtual Tape Library devices... 90
ACSLS ... 91
Disk management ... 92
EMC Ionix ControlCenter ... 92
HP Command View... 93
Virtualization ... 95
Chapter 3
Configuring Requests
Viewing requests ... 98Assigning a request to a node ... 99
Removing a request ... 102
Recoverability requests ... 103
Reloading the Collector ... 104
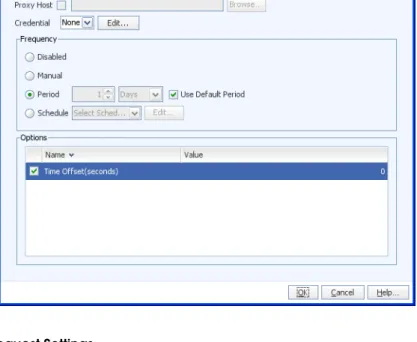
Editing default request settings ... 105
Viewing the request history... 107
Remote data collection ... 108
Chapter 4
Credentials
Creating credentials ... 110Chapter 5
Configuring Control Panels
Creating a Control Panel ... 114Changing the background of a Control Panel... 114
Adding a label to a Control Panel ... 115
Adding an image to a Control Panel ... 115
Adding a report to a Control Panel ... 116
Adding a button to a Control Panel ... 117
Working with Control Panels... 118
Running a Control Panel from the navigation tree ... 118
Setting an initial Control Panel... 118
Editing a Control Panel ... 118
Deleting a Control Panel... 119
Chapter 6
Configuring Analysis Jobs
Rulesets and analyses... 122Ruleset ... 122
Analysis... 122
Generating events from analyses ... 122
Assigning an analysis job ... 123
Creating an alert ... 123
Alert arguments ... 126
Creating an analysis job ... 127
Editing an analysis job ... 129
Chapter 7
Using the Ruleset Editor
Ruleset basics... 132Creating a simple ruleset ... 133
Complex rulesets... 141
Testing a ruleset... 143
Chapter 8
Troubleshooting and
Reporter Performance
Tuning the Reporter for performance ... 146Reporter worker processes... 146
Log files ... 148
Server process log files... 148
Client process log file ... 148
Recoverability server log ... 148
Changing the log level (server) ... 149
Managing the log files... 150
Viewing log files from the GUI... 150
Sending notifications on warnings and errors ... 151
Processes ... 152
Stopping and restarting a process ... 152
Viewing process status from the GUI ... 152
Data collection... 153
Data collection troubleshooting first actions ... 153
Data collection troubleshooting second actions... 153
Data collection troubleshooting third actions ... 153
Preparing a log file for submission to EMC Support ... 154
Client discovery (recoverability analysis) ... 155
Remote client discovery... 155
Local client discovery... 157
Incorrect Recovery Point times ... 159
Report history ... 161
System clock synchronization ... 162
Appendix A
Analysis Job Definitions
Capacity planning ... 164 Change management ... 165 Configuration... 166 Data protection ... 168 Licensing... 170 Performance ... 171 Provisioning ... 172 Resource utilization ... 173Service Level Agreements... 175
Status ... 176
Troubleshooting... 178
Appendix B
WDS File
Importing the WDS file ... 183Exporting the WDS file... 184
Appendix C
Command Line Operations
Exporting the WDS file... 186Running reports from the Publisher... 188
Syntax ... 188
Classpath ... 189
Changing the terminology in the GUI ... 191
Loading historical backup job data ... 192
Job summary reports ... 192
As part of an effort to improve and enhance the performance and capabilities of its product lines, EMC periodically releases revisions of its hardware and software. Therefore, some functions described in this document may not be supported by all versions of the software or hardware currently in use. For the most up-to-date information on product features, refer to the product release notes.
If a product does not function properly or does not function as described in this document, please contact the EMC representative.
Purpose This guide describes the networking environment requirements for Data Protection Advisor and the prerequisites for setting up data monitoring for each supported data protection server or appliance in the environment. The guide also describes the advanced adminstrative functions, including creating custom reports and analysis jobs.
Audience This guide is intended for users already familiar with Data Protection Advisor. System administrators should use this guide, along with the EMC Data Protection Advisor Installation Guide, to prepare their environment for data monitoring by DPA. Advanced DPA users should also use this guide to create custom reports and Control Panels, and set up analysis jobs for alerting on environment changes.
Organization This guide contains the following chapters:
Chapter 1, "Security and Port Settings," describes the default ports and protocols DPA uses to communicate internally between processes, and when discovering clients for recoverability analysis. The chapter also describes the authentication and encryption options available for interprocess communication.
Chapter 2, "Configuring Data Monitoring," describes the environment prerequisites for all supported data protection servers and devices that you must meet before data can be gathered.
Chapter 3, "Configuring Requests," how to modify DPA requests. Requests are the DPA objects that capture information about how, what, and how often to gather data from monitored components.
Chapter 4, "Credentials," describes how to create credentials. Credentials contain connection and authentication information and are used by the Collector to access monitored components and gather data.
Chapter 5, "Configuring Control Panels," describes how to create Control Panels, which are one or more reports grouped into a custom display.
Chapter 6, "Configuring Analysis Jobs," describes how to create analysis jobs. Analysis jobs are a set of user criteria that the Analysis Engine uses to scan the database and alert on changes in conditions.
Chapter 7, "Using the Ruleset Editor," describes how to create rulesets. A ruleset is the set of conditions that is contained in an Analysis Job.
Chapter 8, "Troubleshooting and Reporter Performance," provides some
troubleshooting scenarios that may occur and how to resolve them. The chapter also describes how to scale Reporter performance in large environments.
Appendix A, ”Analysis Job Definitions,” lists all of the system Analysis Jobs that ship with DPA.
Appendix B, ”WDS File,” describes how to import and export configuration data from the DPA server.
Appendix C, ”Command Line Operations,” describes a number of command line utilities for use by administrators.
Related documentation
Related documents include:
◆ EMC Data Protection Advisor Compatibility Guide — Provides information on all of the components of a data protection environment supported by DPA, including servers, databases, and operating systems.
◆ EMC Data Protection Advisor Preinstallation Checklist — Provides a checklist of all of the prerequisite activities that must occur before DPA is installed and data can be gathered for reporting.
◆ EMC Data Protection Advisor Installation Guide — Describes the minimum system requirements for the DPA Server, Collector and GUI client, and describes how to install or upgrade those components. The guide also describes how to configure the database that will be used to store DPA configuration and datamine data.
◆ EMC Data Protection Advisor Quick Start Guide — A quick start guide for installing and setting up DPA for experienced users.
◆ EMC Data Protection Advisor Product Guide — Provides an overview of the DPA architecture and explains how administrator's configure basic operations such as creating users and user roles, and configuring views, nodes and queries.
◆ EMC Data Protection Advisor Report User Guide — Provides information on how to use the DPA GUI to create, modify, and run reports, as well as perform basic reporting functions. This guide also includes a listing of all the predefined, system reports that come installed with DPA.
◆ EMC Data Protection Advisor Report Reference Guide — Describes in detail the predefined, system reports by report type that are installed with DPA.
◆ EMC Data Protection Advisor Data Collection Reference Guide — Discusses each of the DPA data collection modules, describing the information that each module returns and how it obtains that data.
◆ EMC Data Protection Advisor API Reference — Describes the Application Programming Interface (API) to the DPA Controller and Reporter.
◆ EMC Data Protection Advisor Release Notes — Provides the latest information about fixed and known defects in the release and also provides information about new product features and changes for the release.
◆ EMC Data Protection Advisor online help — Provides detailed context-sensitive information about screens of the product to help customers learn and understand how to use DPA.
Conventions used in this document
EMC uses the following conventions for special notices.
Note: A note presents information that is important, but not hazard-related.
Typographical conventions
EMC uses the following type style conventions in this document:
For more information EMC support, product, and licensing information can be obtained as follows. Product information — For documentation, release notes, software updates, or for information about EMC products, licensing, and service, go to the EMC Powerlink website (registration required) at http://Powerlink.EMC.com.
Technical support — For technical support, go to EMC Customer Service on Powerlink. To open a service request through Powerlink, you must have a valid support agreement. Please contact the EMC sales representative for details about obtaining a valid support agreement or to answer any questions about the account.
Normal Used in running (nonprocedural) text for:
• Names of interface elements (such as names of windows, dialog boxes, buttons, fields, and menus)
• Names of resources, attributes, pools, Boolean expressions, buttons, DQL statements, keywords, clauses, environment variables, filenames, functions, utilities
• URLs, pathnames, filenames, directory names, computer names, links, groups, service keys, file systems, notifications
Bold: Used in running (nonprocedural) text for:
• Names of commands, daemons, options, programs, processes, services, applications, utilities, kernels, notifications, system call, man pages Used in procedures for:
• Names of interface elements (such as names of windows, dialog boxes, buttons, fields, and menus)
• What user specifically selects, clicks, presses, or types
Italic: Used in all text (including procedures) for: • Full titles of publications referenced in text • Emphasis (for example a new term) • Variables
Courier: Used for:
• System output, such as an error message or script
• URLs, complete paths, filenames, prompts, and syntax when shown outside of running text
Courier bold: Used for:
• Specific user input (such as commands)
Courier italic: Used in procedures for: • Variables on command line • User input variables
< > Angle brackets enclose parameter or variable values supplied by the user
[ ] Square brackets enclose optional values
| Vertical bar indicates alternate selections - the bar means “or”
{ } Braces indicate content that you must specify (that is, x or y or z)
Your comments Comments and suggestions about our product documentation are always welcome. To provide feedback, please email
[email protected]
Security and
Port Settings
This chapter describes the security and interprocess communication requirements for Data Protection Advisor. It includes the following sections.
◆ Ports and protocols ... 12
◆ Startup process ... 17
◆ Security ... 18
Ports and protocols
The port and networking requirements for DPA components to communicate with each other are described in this section:
◆ “Overview” on page 12
◆ “Server port settings” on page 14
◆ “GUI Client port settings” on page 14
◆ “Illuminator port settings” on page 15
◆ “Collector port settings” on page 16
Overview
DPA uses several predefined TCP ports for communication between DPA processes. This section describes the port requirements for the DPA Server, GUI Client, and Collector components.The ports described in this section are the default values. If necessary, an administrator can change the port on which a process listens from the System Settings dialog. Chapter 4, “Credentials,” describes how to configured the system settings for a process. The administrator requires the "Edit System Settings - Processes" privilege.
Figure 1 DPA process communication Datamine Configuration Illuminator Publisher GUI Predictive Analysis Engine Reporter Controller Listener
Server
3916 3916 3916 4002 4002 4007 4007 4002 3916GUI
3741Data input
Illuminator Collector Only or Application Host with Collector 3916 4007 3916 4001 4001 25011 8583 (RMI) 3916 3916 8587 (RMI) 3741 Application Host Without Collector Windows Proxy collector 8090 135 3741 25011 22 or 21/23 or 135Server port settings
The default ports for communications between the core Server processes are described in Table 1 on page 14.GUI Client port
settings
The default ports for communications between theGUI Client and Server processes are described in Table 2 on page 14.
For almost all functionality, the GUI Client only needs to connect to ports 3916 (Controller) and port 4002 (Reporter). Connection to ports 9002, 4001, and 4007 are only required if the features described in Table 2 on page 14 are required.
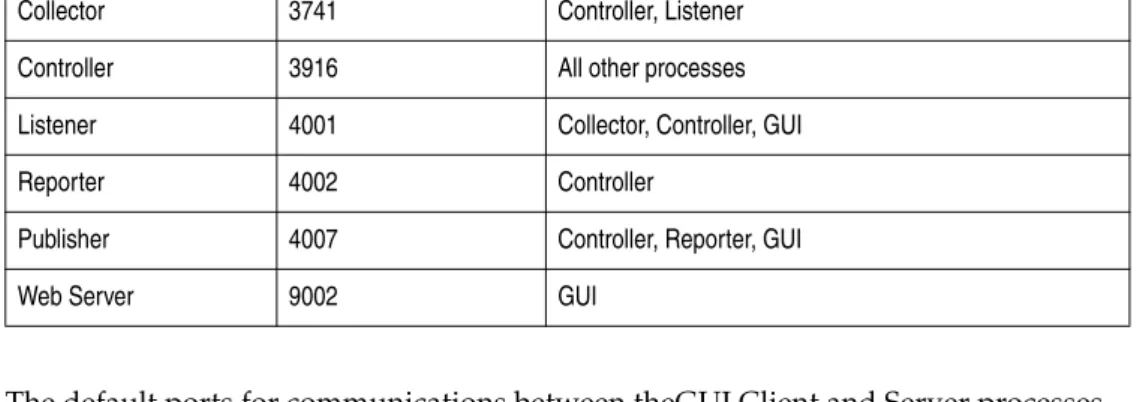
Table 1 Server process communications
This process: Listens on port: Communicates with:
Collector 3741 Controller, Listener
Controller 3916 All other processes
Listener 4001 Collector, Controller, GUI
Reporter 4002 Controller
Publisher 4007 Controller, Reporter, GUI
Web Server 9002 GUI
Table 2 Client communications
Client listens on port: Communicates with:
3916 Controller
4002 Reporter
9002 Web Server
The user can launch the GUI from a web browser, or chose to install it locally. If they choose to launch from a web browser, the client also needs to be able to connect to port 9002, which is the web server.
4001 Listener
In the backup module, the user has the ability to annotate failed backups with the reason the job failed and other information. To use this feature, the GUI needs to connect to port 4001 (Listener) to store data in the database.
4007 Publisher
If the user is using scheduled reports, and wishes to test the report from the GUI, the GUI neeeds to connect to port 4007 (Publisher).
Illuminator port
settings
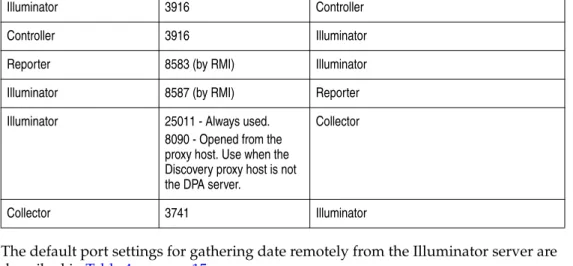
The default ports for communication between the recoverability server (the Illuminator process) and the other server processes are described in Table 3 on page 15.
The default port settings for gathering date remotely from the Illuminator server are described in Table 4 on page 15.
Local and remote discovery
Figure 1 on page 13 shows both the ports required for both the local and remote discovery processes:
◆ Collector only or application host with Collector
This scenario refers to a DPA Collector installed remotely on any platform, or a Collector installed on an application host (for exampole, an ECC host).
◆ Windows proxy Collector
This scenario refers to a DPA Collector installed on a Windows platform to perform discovery on Windows hosts. This configuration is required to remotely discover Windows hosts when DPA server is running on Solaris.
◆ Application host without Collector
This scenario refers to discovery performed on an application host without a Collector installed local to the host.
Table 3 Illuminator server communications
This process: Listens on port: Communicates with:
Illuminator 3916 Controller
Controller 3916 Illuminator
Reporter 8583 (by RMI) Illuminator
Illuminator 8587 (by RMI) Reporter
Illuminator 25011 - Always used.
8090 - Opened from the proxy host. Use when the Discovery proxy host is not the DPA server.
Collector
Collector 3741 Illuminator
Table 4 Remote communications
Operating system Direction: Using port:
Windows From DPA server RPC port range
(Default port 135).
To DPA server RPC port Range
(Default 1024-65535). TCP port 25011.
UNIX From DPA server One of:
• SSH (TCP 22) • FTP & Telnet (TCP 23,
TCP 21)
If the recoverability discovery process is performed remotely, DPA will attempt on SSH (default port 22). If that fails, DPA will attempt via ftp/telnet (ports 21/23). If this fails, DPA will attempt an RPC connection (default port 135).
The following must be enabled to ensure communication between the monitored host and the Illuminator process:
◆ RPC services should be enabled and accessible to the DPA Server .
◆ SSHD should be enabled and accessible to the DPA Server, or FTP/Telnet services should be enabled and accessible to the DPA Server
Collector port
settings
Ensure that the firewall between a Collector and the server that is running the controller allows traffic destined for ports 3916 and 4001 to flow from the Collector to the controller and listener. The Controller must communicate with the Collector on port 3741 to allow the Collector to be informed of changes in the configuration.
Startup process
The following is the sequence of events during Collector startup:
1. The Collector is started by the system (/etc/init.d or Windows Services) or manually.
2. The Collector initiates a connection to the Controller as configured during installation, and identifies the hostname and aliases.
3. The Controller obtains its configuration for the host from the config database and forwards this information to the Collector. This information includes the items to monitor along with any options (for example, username and passwords, specific ports, time-out values, polling interval).
4. The Collector immediately starts monitoring the system upon receipt of the configuration.
5. Upon gathering data, the Collector formats the information into an XML packet, and sends the packet to the Listener.
6. The Collector returns to idle, and continues polling each request at the specified interval for that request.
7. The Listener, upon receipt of a packet from the Collector, inserts the data into the database, either as a new row or as an update to data that is already present. In addition, specific Collectors may require other available ports. For example, collecting data through SNMP requires access from the Collector to port 161 on the node being monitored by both TCP and UDP protocols. The full details of the ports required for each module depend on the application being monitored (for example, NetWorker or Symantec NetBackup).
Chapter 2, “Configuring Data Monitoring,”describes the configuration prerequisites for all of the data gathering modules of DPA.
Security
Security for all server processes includes the Reporter, Listener, Analysis engine, and Publisher. If security is enabled, users are not able to connect to any of these processes using the API without being authenticated first.
To enable security, modify the controller.xml file on the server. There is an AUTHREQUIRED setting in this file that can be set to one of three values:
◆ none
Security is not enabled. Users can connect to Server-side processes using the API without being authenticated.
◆ compatauth
Security is enabled. Users must authenticate when connecting to the Server-side processes. This method should be used with Collectors 2.1 or 2.1.2 in your environment.
◆ fullauth
Security is enabled. Users must authenticate when connecting to server processes. This method should be used if all Collectors in the environment are version 3.0 or later.
If upgrading from a previous version that had security enabled, the security setting is automatically changed to the new method of configuration, and the security level is set to compatauth.
If Collectors earlier than version 2.1 are in your environment, do not enable server security. The Collectors will not be able to communicate with the Controller and will stop gathering data.
Encryption
If encryption is enabled, all communications between all processes in the product are encrypted.
To enable encryption, modify the controller.xml file on the server by changing the CRYPTREQUIRED variable to one of the following values:
◆ none
No encryption occurs between any processes.
◆ allow
Processes are capable of performing encryption, and communications are encrypted. Use this setting if components in the environment are an earlier version of the product and are not capable of encryption.
◆ enforce
All communications are encrypted. If a component is incapable of encrypting data, it will not be able to communicate with other processes. Use this setting if all components are version 3.1 and later.
If upgrading from an old version of DPA, set the Collector to allow so that Collectors in the environment that have not been upgraded can continue to communicate with the server.
Restart the Controller to apply the changes and enable encryption .
An encryption session
When encryption is enabled, data is encrypted using the Advanced Encryption Standard (AES). A session key is used to encrypt all data sent across the network. This key is unique to each individual network connection and is used only for the duration of that connection.
When a client initiates a network connection, it must negotiate a session key with the server. As part of the negotiation phase, the initiating process sends a private key across the network to the server. The server generates a unique session key and encrypts the key using the private key of the client. The session key is then returned to the client, which then uses that key to encrypt all data sent over the network using AES.
The private key used by the client process during the negotiation of the session key is created by default when the process is installed. This key is unique to that host. By default, the client process will generate a 2048 bit RSA key. The following algorithms are supported:
◆ RSA (1024 and 2048 bit keys)
◆ AES (128 and 256 bit keys)
◆ 3DES (192 bit keys)
◆ DES (56 bit key).
The encryption algorithm and key used during the session key negotiation can be modified by a customer if necessary, using the key tool.
Key Tool
To change the encryption algorithm, a binary called dpa_keytool is distributed with the Server and Collector packages. The key tool binary is used to generate a new encryption key. Its usage is:
dpa_keytool <type> <keylength> [<keyfile>]
The list of possible values for type and key length are shown in Table 5 on page 20.
For example:
dpa_keytool RSA 1024 MyDPA.key
When run, the key tool produces a file containing the generated key. If the <keyfile>
parameter is not specified, the file is created in the same directory in which the command was run, with a file extension that matches the specified algorithm and key length.
On UNIX platforms, you must source the dpa.config file before running the key tool. For sh, ksk, bash, or equivalent shell, run:
. <installdir>/etc/dpa.config
For csh, tcsh, or equivalent shell, run:
source <installdir>/etc/dpa.config
For the new key file to take effect, it must be placed in the keys directory for the component. The location of the keys directory depends on the operating system:
◆ The Windows keys directory is $INSTALLDIR/keys.
◆ The UNIX keys directory is $INSTALLDIR/etc/keys.
After creating a key, move the key file into the keys directory on that machine. Multiple keys can be placed in the keys directory. The encryption process uses the key with the longest key length that exists in the keys directory. After putting the key file in the keys directory, all processes must be restarted for the change to take affect.
Table 5 Key type and key length
Algorithm Key Length
RSA 2048 RSA 1024 AES 256 AES 128 DES3 192 DES 56
Encryption from a web browser interface
To change the encryption method used by a GUI launched from a web browser, the generated keys must be placed inside a jar file.
To place the keys inside a jar file for the user interface:
1. Rename the resource.jar file in $INSTALLDIR/webapps/root/resource.jar to resource.zip.
2. Open the file using a zip compression tool. 3. Add the key file or files to the zip file.
4. Save the zip file back to the $INSTALLDIR/webapps/root directory and rename it with a .jar extension.
Configuring Data
Monitoring
This chapter describes how to configure Data Protection Advisor to monitor devices, hosts, and applications in a data protection environment. When the product is first installed, Data Protection Advisor automatically starts gathering information about the host on which the DPA server is installed.
The chapter includes the following sections:
◆ Introduction to DPA data monitoring... 24
◆ Application Hosts ... 25 ◆ Storage arrays ... 30 ◆ Applications ... 37 ◆ Databases... 61 ◆ RecoverPoint ... 72 ◆ System monitoring ... 73 ◆ Tape libraries... 77
◆ Switches and I/O Devices... 80
◆ File Servers ... 83
◆ Backup appliances... 86
◆ ACSLS ... 91
◆ Disk management ... 92
Introduction to DPA data monitoring
This section introduces the configuration wizards that DPA uses to simplify setting up data gathering, and some common elements of configuration.
Data Collection and
Discovery Wizards
Monitoring devices and applications is automated by the Data Collection Wizard and the Discovery Wizard, which configure DPA using a series of questions about the device or application to monitor. After defining a device or application in a wizard, one or more nodes are automatically added to the Configuration view and data monitoring by the Collector starts.
The sections in this chapter describe how to use the wizards to configure all of the components of a data protection environment that DPA monitors. Many devices and applications require configuration tasks to be performed on the DPA server, the Collector proxy host, or the monitored host before using the Data Collection Wizard or Discovery Wizard. These prerequisite tasks are also described.
Data collection and
licensing
The options that are available for configuration in the Data Collection and Discovery wizards depend on the types of licenses that you have installed with DPA. If you do not have the correct license installed, the option to create that device or host is disabled in the wizard.
The EMC Data Protection Advisor Installation Guide describes the license types available for DPA. For more information on how to obtain licenses for reporting, please contact an EMC Account Manager or Customer Support Engineer.
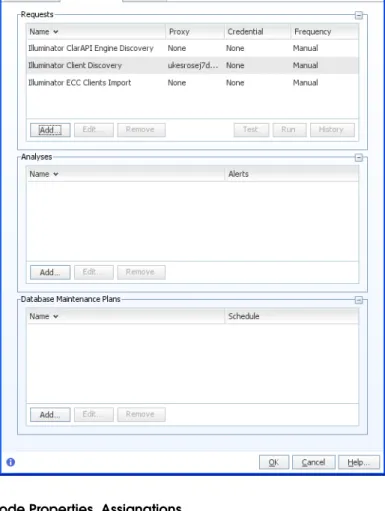
Requests
All of the configuration data that tells DPA how, when, and what sort of data to gather for a node is stored in a DPA object called a "request". Requests are assigned to a node automatically after that node is created using the Data Collection or Discovery wizards.You can change data gathering for a node by changing the details of the assigned requests, and the type of requests assigned. Chapter 3, "Configuring Requests," describes how do change and assign requests.
Testing credentials
For most devices and applications, a credential is required for the Collector to access the device or server. The Data Collection and Discovery Wizards prompt for the credential during the configuration process.A Test button is available in the wizard that tests the validity of the supplied credential by connecting briefly to the device or application.
Chapter 4, "Credentials," describes how to create and modify credentials.
Gathering historical
data
The Collector can also gather historical backup data from jobs that were run prior to the backup application being configured in Data Protection Advisor. Appendix C, ”Command Line Operations,” contains more information on gathering historical data.
Application Hosts
DPA can monitor database hosts and Microsoft Exchange Server for recoverability analysis. There are two methods to configure application hosts for monitoring in DPA:
◆ To configure multiple hosts, use the Discovery Wizard. Hosts can be imported from a CSV file, or by connecting to an EMC Ionix ControlCenter host and importing the defined clients.
◆ To configure a single host, use the Data Collection Wizard.
The following sections describe how to create application host nodes for gathering data:
◆ "Importing hosts from a CSV file" on page 25
◆ "Importing hosts from EMC Ionix ControlCenter" on page 26
◆ "Monitoring a single host" on page 28
Prerequisites
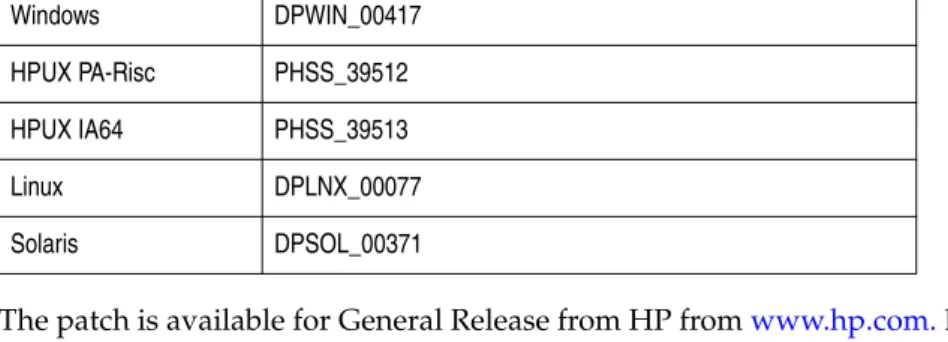
HP-UXIf you are performing discovery for a host on HP-UX 11v1, the following patches must be installed on the HP-UX host prior to the discovery:
◆ PHCO_24504 ◆ PHSS_36004 ◆ PHCO_31923 ◆ PHCO_35743 ◆ PHKL_34805 Linux
Retrieving VDISK information on Red Hat and SUSE Linux requires the following library to be installed on the host: libstdc++.so.6.
Importing hosts from
a CSV file
You can provide the Discovery Wizard with a comma-separated list of hostname values that you want imported into the DPA Configuration view.
Prerequisites
To perform an import from a CSV file, the user must select a text file from the local filesystem that is in a comma-separated value format. The format of the file must be:
Client,AlternativeName,Timezone,Platform
The values for the time zone field and Platform field are optional, but if specified must conform to the following formats:
◆ Timezone — A valid Java time zone string, as defined at
http://java.sun.com/j2se/1.4.2/docs/api/java/util/TimeZone.html# NormalizedCustomID
◆ Platform — One of: Windows, Solaris, Linux, HP-UX, AIX, ESX.
If no time zone is specified, the default time zone is taken from the machine on which the DPA client is running.
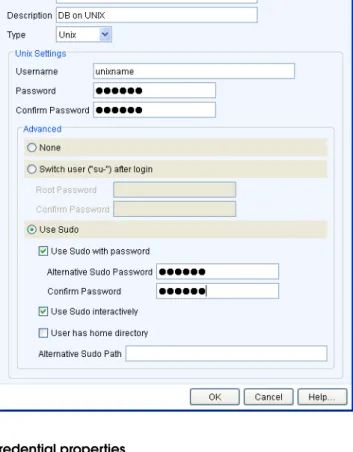
The credentials used to connect to the storage array host must include the following:
◆ UNIX and Linux — A user with root level rights , or a user with the following SUDO rights:
<user> <computer alias> = NOPASSWD: /<dir>/IllumAgent/l4magent
Where <dir> is the home directory for the user specified in the credential
(usually/var/tmp). The SUDO program should support the -p parameter and the -s parameter when the interactive mode is used.
The following must be enabled to ensure communication between the monitored host and the recoverability process:
◆ RPC services should be enabled and accessible to the recoverability agent .
◆ SSHD should be enabled and accessible to the recoverability agent .
◆ FTP/Telnet services should be enabled and accessible to the recoverability agent .
To import hosts from a CSV file
To import hosts from a CSV file:
1. Select Tools > Discovery Wizard from the toolbar. The Discovery Wizard appears. 2. Select Servers and click Next to proceed to the Import Source panel.
3. Select File, and enter the full path to the CSV file in the File name field, or click
Browse to search for the file.
4. Click Next to proceed to the Select Clients panel. All of the hosts defined in the CSV file are displayed.
5. Select the hosts from the file to be imported. Click Next. The Recoverability panel appears.
6. Select Monitor for Recoverability to enable recoverability analysis for the selected hosts.
7. Select a Credential to use to connect to the hosts to gather recoverability data, or click Edit to modify or create a credential.
8. Select a Schedule for the recoverability data gathering request, or click Edit to modify or create a schedule. Click Next. The Import Location panel appears. 9. Select Assign nodes in Tree to assign the imported host nodes to the selected
position in the Configuration view.
By default, the created nodes are not added to the Configuration view, but added to the configuration database, and can be edited and assigned from the Node List dialog.
10. Click Next. The Importing panel appears. Click Next to start importing the selected clients.
11. A message indicates if the import process was successful. Select Finish to close the Discovery Wizard, or OK to return to the Wizard if the import failed. 12. If the import was successful, the host nodes are created and the client discovery
request is assigned to the nodes with the specified credential and schedule to gather recoverability data.
Importing hosts from
EMC Ionix
ControlCenter
You can discover application hosts from EMC Ionix ControlCenter by connecting to the ControlCenter host.
Prerequisites
The DPA Collector must be able to communicate with the ECC API.
The credentials used to connect to hosts for recoverability monitoring must include the following:
◆ Windows — A user with local or domain administrator rights.
◆ UNIX and Linux — A user with root level rights , or a user with the following SUDO rights:
<user> <computer alias> = NOPASSWD: /<homedir>/IllumAgent/l4magent
The SUDO program should support the -p parameter and the -s parameter when the interactive mode is used.
The following must be enabled to ensure communication between the monitored host and the recoverability process:
◆ RPC services should be enabled and accessible to the recoverability agent .
◆ SSH should be enabled and accessible to the recoverability agent .
◆ FTP/Telnet services should be enabled and accessible to the recoverability agent .
To import hosts from EMC Ionix ControlCenter
To import hosts from EMC Ionix ControlCenter:
1. Select Tools > Discovery Wizard from the toolbar. The Discovery Wizard appears. 2. Select Servers and click Next to proceed to the Import Source panel.
3. Select ECC connection.
4. If at least one ControlCenter host has already been defined using the Data Collection or Discovery Wizard, it will appear in the Existing list. ControlCenter nodes created using the Node Editor will not appear in this list. Select an existing ControlCenter host from the list to reimport the EMC Ionix ControlCenter configuration.
5. Otherwise, select Custom to import from a known ControlCenter host. Complete the fields:
• Hostname — The name of the host on which ECC API is running. • Port — The port on which the ECC API listens.
• Credential — The credential used to connect to the ControlCenter host. • ECC Credential — The credential used to connect to ECC API.
• Connect Remotely — Select if DPA should connect directly to ECC API. Otherwise, DPA will connect to the ECC host (using host credentials) and connect from there to ECC API.
6. Click Next to proceed to the Select Clients panel. 7. Select the hosts that you want to import and click Next.
8. If the import is successful, the Wizard displays a list of all of the hosts that were imported from this ControlCenter server. Click Next. The Recoverability panel appears.
9. Select Monitor for Recoverability to enable recoverability analysis for the selected clients.
10. Select a Credential to use to connect to the clients to gather recoverability data, or click Edit to modify or create a credential.
11. Select a Schedule for the recoverability data gathering request, or click Edit to modify or create a schedule. Click Next. The Import Location panel appears. 12. Select Assign nodes in Tree to assign the imported hosts to the selected position
in the Configuration view. By default, the created nodes are not added to the Configuration view, but added to the configuration database, and can be edited and assigned from the Node List dialog.
13. Click Next. The Importing panel appears. Click Next to start importing the selected hosts.
14. A message indicates if the import process was successful. Select Finish to close the Discovery Wizard, or OK to return to the Wizard if the import failed. 15. If the import was successful, the host nodes are created and the client discovery
request is assigned to the nodes with the specified credential and schedule to gather recoverability data.
Monitoring a single
host
Monitor an application host from a Collector running on the host machine or another machine in the environment. System data can only be gathered from UNIX systems by a Collector local to the UNIX machine.
Prerequisites
"Prerequisites" on page 25 provides the prerequisites for monitoring application hosts.
Monitoring a host
To monitor a host:
1. Launch the Data Collection wizard by selecting Tools > Data Collection wizard
from the menu.
2. Click Host in the Data Collection Wizard and click Next. The Host Details panel appears.
3. In the Enter the name of the Host field, type the name or IP address of the host.
Note: The unique node name must be the name of a valid host. This name is restricted to 255 characters.
4. In the Enter a description of the Host field, type a short description that will help to identify the host.
5. In the Select the operating system running on the Host field, select an operating system from the list of values.
6. In the Enter any aliases of the Host field, type any aliases that are associated with the host.
Note: Aliases can be entered on separate lines or separated by commas (for example, Alias1, Alias2, Alias3).
7. Click Next. The Collector Location panel appears. This panel does not appear for operating systems of type Other.
8. In the Is there or will there be a Collector installed on the Host? field, select either Yes or No. Click Next and the Data Gathering panel appears.
9. Select Yes to gather system information from the application’s host in the Do you want to gather system information? field, or No to not gather system
information.
10. Click Next and the Remote System Information Permissions panel appears. The Remote System Information Permissions panel only appears if the following conditions are met:
• The operating system is Windows.
• A Collector is not installed on the computer. • System information is to be monitored.
11. In the User Name field, type the user name for an account that exists on the host. In the Password field, type the password for the user name. In the Confirm Password field, type the password again.
12. Click Next. The Recoverability Analysis Permissions panel appears.
13. Select Yes in the Do you want to perform Recoverability Analysis on this host
field. Select a Credential used to connect, or click Edit to create or edit an existing credential.
14. Click Next. The Item Location panel appears. Click to select the folder in the Navigation tree under which you want the node to appear.
15. Click Next. The Summary panel appears.
Click Finish to create the node. All applicable requests, proxy information, and credentials are assigned to the host node and the Collectors are reloaded.
Storage arrays
Data Protection Advisor monitors the following storage arrays:
◆ EMC CLARiiON
◆ EMC Symmetrix
EMC CLARiiON and Symmetrix storage arrays replicated with EMC RecoverPoint require additional configuration to enable complete recoverability analysis. The following sections describe setting up storage array nodes for monitoring:
◆ "EMC CLARiiON" on page 30
◆ "EMC Symmetrix" on page 34
◆ "Monitoring storage arrays that use RecoverPoint" on page 36
EMC CLARiiON
EMC CLARiiON storage arrays (CLARiiON) must be monitored remotely from a Collector running on a different host (such as the DPA server).A CLARiiON is only monitored for recoverability analysis reporting. Normal DPA reporting, for example, capacity planning or performance reporting, is not available. There are two methods to configure EMC CLARiiON storage arrays for monitoring in DPA:
◆ To configure multiple hosts and multiple storage arrays, use the Discovery Wizard, as described in "Discovering CLARiiON storage arrays" on page 31. DPA discovers all of the storage arrays that are being managed and creates nodes in the Navigation tree.
◆ To configure a single storage array, use the Data Collection Wizard, as described in "Monitoring a single CLARiiON" on page 32.
In both methods, you will need to supply the name of the host on which EMC Solutions Enabler is installed.
Prerequisites
Monitoring EMC CLARiiON requires additional licensing. Without the correct license, the option to configure EMC CLARiiON for monitoring does not appear in the Data Collection Wizard.
The recoverability server connects to the CLARiiON on TCP port 443. If the CLARiiON is configured to use port 2163, use port 2163.
EMC Solutions Enabler
Discovering CLARiiON hosts from DPA requires version 7.1 of Solutions Enabler to be installed. The following are the steps required.
1. Download EMC Solutions Enabler 32-bit version 7.1 from PowerLink.EMC.com. 2. Install Solutions Enabler on the DPA server or any supported host able to connect
to the CLARiiON array through HTTPS.
A Solutions Enabler license is not required to discover a CLARiiON. 3. Create a text file with the following CLARiiON information, one line per
CLARiiON:
<SPA IP> <SPB IP> <Username> <Password>
◆ <SPA IP> is the IP address of the first controller (SP-A).
◆ <SPB IP> is the IP address of the second controller (SP-B).
◆ <username> and <password> are the account name and password of a CLARiiON user with view permissions.
The first field must be the first CLARiiON controller, followed by the second controller.
4. If the Base license of Solutions Enabler exists, run the following command on the Solutions Enabler host to register the CLARiiON:
symcfg disco -clar -file <filename>
5. If the Base license of Solutions Enabler does not exist, copy the ClarApiDiscovery executable file from the following directory:
<DPA Install Directory>\Illuminator_Agent\bin\ClarAPI\<Platform> to the Solutions Enabler host, and run the following command:
Windows
ClarApiDiscovery.exe REGISTER -file=<filename> UNIX
./ClarApiDiscovery REGISTER -file=<filename>
The available platforms are: • AIX
• Hp • Linux • Solaris • Win32
6. Run the following command to confirm that the CLARiiON has been registered:
symcfg list -clar
7. If the CLARiiON is listed, you are ready to run the Discovery Wizard in DPA and configure the CLARiiON.
Discovering CLARiiON storage arrays
To perform a discovery of CLARiiON storage arrays, select either a host previously configured in DPA, or connect to a host with Solutions Enabler installed.
To discover storage arrays:
1. Select Tools > Discovery Wizard from the toolbar. The Discovery Wizard appears. 2. Select Storage Arrays and click Next to proceed to the Import Source panel. 3. If at least one host has already been defined using the Data Collection or
Discovery Wizards, it will appear in the Existing list. Storage array hosts created using the Node Editor will not appear in this list. Select an existing host from the list to re-import changes in the storage array configuration.
4. Otherwise, select Custom to import from a known host. Complete the fields: • Hostname — The name of the host running Solutions Enabler.
• Credential — The credential used to connect to the host. • Method — Select EMC CLARiiON (CLARAPI).
• Time Offset — Specifies the time difference between the Symmetrix host and the recoverability analysis agent (SYMAPI only).
5. Click Next.
6. If the import is successful, the Wizard displays a list of all of the storage arrays that were discovered from this host in the Select Storage Arrays panel.
The Remote column indicates if the Storage Array API is remote to the SE host. The Connector column indicates the current node used to store the SE host for this storage array. Click on the Connector column to change the connector node used to discover this storage array.
7. Select the storage arrays that you want to import and click Next.
8. Select a Schedule for the recoverability data gathering request, or click Edit to modify or create a schedule. Click Next. The Import Location panel appears. 9. Select Assign nodes in Tree to assign the imported client nodes to the selected
position in the Configuration view. By default, the created nodes are not added to the Configuration view, but added to the configuration database, and can be edited and assigned from the Node List dialog.
10. Click Next. The Importing panel appears. Click Next to start importing the selected clients.
11. A message indicates if the import process was successful. Select Finish to close the Discovery Wizard, or OK to return to the Wizard if the import failed. 12. If the import was successful, the storage array nodes are created. If the user
selected recoverability monitoring, the client discovery request is assigned to the nodes with the specified credential and schedule to gather recoverability data.
Monitoring a single CLARiiON
To monitor a CLARiiON storage array:
1. Launch the Data Collection wizard by selecting Tools > Data Collection wizard
from the menu. 2. Select Storage Array.
3. Select EMC CLARiiON from the Storage Array Type panel and click Next. The Storage Array Details panel appears.
4. Enter a Name for the storage array. The name is given to the node created in DPA. Enter a Description for the storage array. Click Next.
5. Select Use settings from a previously configured host if you want to use the host and credentials of an existing storage array node.
a. Select the existing host from the list. The credentials already configured for the host are used to connect to the new storage array.
6. Select Specify new connection settings to create new host and credential settings. a. Click Browse to open the Node List dialog. Select a node from the list to be
configured as a CLARiiON host (must have Solutions Enabler installed). Click
OK.
b. Select a Credential, or click Edit to open the Credential editor to create or modify a credential.
c. When the Data Collection Wizard is finished, the node you selected is assigned the appropriate storage array discovery requests, using the credential you supplied.
7. Click Next. The Item Location panel appears. Select the folder in the navigation tree for the node to appear.
8. Click Next. The Summary panel appears.
9. Click Finish to create the node. All applicable requests and credentials are assigned to the node and the Collectors are reloaded.
EMC Symmetrix
EMC Symmetrix storage arrays (Symmetrix) must be monitored remotely from a Collector running on a different host (such as the DPA server).A Symmetrix is only monitored for recoverability analysis. Normal DPA reporting, for example, capacity planning or performance reporting, is not available.
There are two methods to configure EMC Symmetrix storage arrays for monitoring in DPA:
◆ To configure multiple hosts and multiple storage arrays, use the Discovery Wizard, as described in "Discovering Symmetrix storage arrays" on page 34. DPA discovers all of the storage arrays that are being managed and creates nodes in the Navigation tree.
◆ To configure a single storage array, use the Data Collection Wizard, as described in "Monitoring a single Symmetrix" on page 35.
In both methods, you will need to supply the name of the host on which EMC Solutions Enabler is installed.
Prerequisites
Monitoring EMC Symmetrix requires additional licensing. Without the correct license, the option to configure EMC Symmetrix for monitoring does not appear in the Data Collection or Discovery Wizard.
EMC Solutions Enabler
Discovering Symmetrix hosts from DPA requires an existing EMC Solutions Enabler host, or Solutions Enabler to be installed. The following are the steps required. 1. If you are using an existing Solutions Enabler host, it must satisfy the following
requirements:
• The host operating system and Solutions Enabler version are supported by DPA as described in the EMC Data Protection Advisor Compatibility Matrix.
• The host must be 32-bit, or 64-bit with a 32-bit version of Solutions Enabler. • The host must be connected to the Symmetrix array by a SAN connection. • The DPA server must be able to connect to the Solutions Enabler host. Otherwise, download a supported version of EMC Solutions Enabler from PowerLink.EMC.com and install on a host that satisfies the above.
2. Obtain the "Base" and "DevMasking" licenses for Solutions Enabler. 3. Run the following command on the Solutions Enabler host to register the
Symmetrix:
symcfg discover
4. Run the following command to confirm that the Symmetrix has been registered:
symcfg list
5. If the Symmetrix is listed, you are ready to run the Discovery Wizard in DPA and configure the Symmetrix.
Discovering Symmetrix storage arrays
To perform a discovery of Symmetrix storage arrays, select either a host previously configured in DPA, or connect to a host with Solutions Enabler installed.
To import a storage array:
2. Select Storage Arrays and click Next to proceed to the Import Source panel. 3. If at least one host has already been defined using the Data Collection or
Discovery Wizards, it will appear in the Existing list. Storage array hosts created using the Node Editor will not appear in this list. Select an existing host from the list to reimport changes in the storage array configuration.
4. Otherwise, select Custom to import from a known host. Complete the fields: • Hostname — The name of the host running Solutions Enabler.
• Credential — The credential used to connect to the host. • Method — Select EMC Symmetrix (SYMAPI).
• Time Offset — Specifies the time difference between the Symmetrix host and the recoverability analysis agent (SYMAPI only).
5. Click Next.
6. If the import is successful, the Wizard displays a list of all of the storage arrays that were discovered from this host in the Select Storage Arrays panel.
The Remote column indicates if the Storage Array API is remote to the SE host. The Connector column indicates the current node used to store the SE host for this storage array. Click on the Connector column to change the connector node used to discover this storage array.
7. Select the storage arrays that you want to import and click Next.
8. Select a Schedule for the recoverability data gathering request, or click Edit to modify or create a schedule. Click Next. The Import Location panel appears. 9. Select Assign nodes in Tree to assign the imported client nodes to the selected
position in the Configuration view. By default, the created nodes are not added to the Configuration view, but added to the configuration database, and can be edited and assigned from the Node List dialog.
10. Click Next. The Importing panel appears. Click Next to start importing the selected clients.
11. A message indicates if the import process was successful. Select Finish to close the Discovery Wizard, or OK to return to the Wizard if the import failed. 12. If the import was successful, the storage array nodes are created. If the user
selected recoverability monitoring, the client discovery request is assigned to the nodes with the specified credential and schedule to gather recoverability data.
Monitoring a single Symmetrix
To monitor a Symmetrix storage array:
1. Launch the Data Collection wizard by selecting Tools > Data Collection wizard
from the menu. 2. Select Storage Array.
3. Select EMC Symmetrix from the Storage Array Type panel and click Next. The Storage Array Details panel appears.
4. Enter a Name for the storage array. The name is given to the node created in DPA. Enter a Description for the storage array. Click Next.
5. Select Use settings from a previously configured host if you want to use the host and credentials of an existing storage array node.
a. Select the existing host from the list. The credentials already configured for the host are used to connect to the new storage array.
6. Select Specify new connection settings to create new host and credential settings. a. Click Browse to open the Node List dialog. Select a node from the list to be
configured as a Symmetrix host (must have Solutions Enabler installed). Click
OK.
b. Select a Credential, or click Edit to open the Credential editor to create or modify a credential.
c. When the Data Collection Wizard is finished, the node you selected is assigned the appropriate storage array discovery requests, using the credential you supplied.
7. Click Next. The Item Location panel appears. Select the folder in the navigation tree for the node to appear.
8. Click Next. The Summary panel appears.
9. Click Finish to create the node. All applicable requests and credentials are assigned to the node and the Collectors are reloaded.
Monitoring storage
arrays that use
RecoverPoint
If your EMC CLARiiON or Symmetrix storage arrays are replicated with EMC RecoverPoint, DPA provides recoverability analysis for RecoverPoint replication operations.
To perform recoverability analysis for RecoverPoint, you have to configure the CLARiiON or Symmetrix storage arrays and the RecoverPoint host in DPA in correct order.
To gather RecoverPoint recoverability data:
1. Use the Data Collection Wizard to create the host node for the Solutions Enabler host that is connected to the storage array replicated with RecoverPoint.
2. Run the Illuminator Client Discovery request from the host connector node you created, to discover the arrays attached to the host.
3. Configure the Symmetrix or CLARiiON arrays using the Discovery Wizard, as described in "Storage arrays" on page 30.
4. Run the Illuminator Policy Import request on the storage array nodes you created to import recoverability policy data.
5. Using the Data Collection Wizard, configure the EMC RecoverPoint appliances data monitoring, as described in "RecoverPoint" on page 72.
6. Ensure that the RecoverPoint Configuration request has been assigned to the RecoverPoint appliance node that handles replication for the storage array. Run this request. Chapter 3, "Configuring Requests," describes how to assign requests to nodes and run requests.
7. After the RecoverPoint Configuration request is run and sufficient time has passed, DPA should have begun gathering recoverability analysis data for RecoverPoint. Reports can be run from the storage array nodes and the SLM workspace will show the mapping of storage and recovery points.
Applications
DPA monitors the following backup applications and servers:
◆ "CA BrightStor ARCserve" on page 37
◆ "CommVault Simpana" on page 38
◆ "EMC Avamar" on page 39
◆ "EMC NetWorker" on page 41
◆ "HP Data Protector" on page 43
◆ "IBM Tivoli Storage Manager" on page 45
◆ "Oracle RMAN" on page 49
◆ "Symantec Backup Exec" on page 51
◆ "Symantec NetBackup" on page 53
◆ "Symantec PureDisk" on page 55
◆ "EMC HomeBase" on page 58
◆ "Microsoft Exchange Server" on page 59
This section provides instructions for configuring each application.
CA BrightStor
ARCserve
CA BrightStor ARCserve servers are monitored from a Collector running on the CA BrightStor ARCserve server or from a Collector running on any other Windows computer in the environment.
Install the ARCserve Manager on the computer in which the Collector is running.
Prerequisites
There are no prerequisites for monitoring a CA BrightStor ARCserve server.
Monitoring a CA BrightStor ARCserve server
To monitor an ARCserve server:
1. Launch the Data Collection wizard by selecting Tools > Data Collection wizard
from the menu.
2. Click Host in the Data Collection Wizard and click Next. The Host Details panel appears.
3. In the Enter the name of the Host field, type the name of the node.
Note: The unique node name must be the name of a valid host. This name is restricted to 255 characters.
4. In the Enter a description of the Host field, type a short description that will help to identify the host.
5. In the Select the operating system running on the Host field, select an operating system from the list of values.
6. In the Enter any aliases of the Host field, type any aliases that are associated with the host.
Note: Aliases can be entered on separate lines or separated by commas (for example, Alias1, Alias2, Alias3).
7. Click Next. The Collector Location panel appears. This panel does not appear for operating systems of type Other.
8. In the Is there or will there be a Collector installed on the Host? field, select either Yes or No. Click Next and the Data Gathering panel appears.
9. Select Yes to gather system information from the application’s host in the Do you want to gather system information? field.
10. Select Yes in the Do you want to monitor applications on this host? field. Select
CA BrightStor ARCserve from the list of applications.
11. Click Next and the Remote System Information Permissions panel appears. The Remote System Information Permissions panel only appears if the following conditions are met:
• The operating system is Windows.
• A Collector is not installed on the computer. • System information is to be monitored.
12. In the User Name field, type the user name for an account that exists on the host. In the Password field, type the password for the user name. In the Confirm Password field, type the password again.
13. Click Next. The Recoverability Analysis Permissions panel appears.
14. Select Yes in the Do you want to perform Recoverability Analysis on this host
field to enable recoverability analysis on the application. Select a Credential used to connect, or click Edit to create or edit an existing credential.
15. Click Next. The Item Location panel appears. Click to select the folder in the Navigation tree under which you want the node to appear.
16. Click Next. The Summary panel appears.
17. Click Finish to create the node. All applicable requests, proxy information, and credentials are assigned to the node and the Collectors are reloaded.
CommVault
Simpana
Monitor CommVault Simpana servers from a Collector running on the CommVault Simpana database or from a Collector running on any other computer in the environment.
Prerequisites
The Collector has to run as an account that has permission to access and execute read-only statements in the CommVault database.
Monitoring a CommVault Simpana Database
To monitor a CommVault Simpana database:
1. Launch the Data Collection wizard by selecting Tools > Data Collection wizard
from the menu.
2. Click Host in the Data Collection wizard. Click Next and the Host Details panel appears.
3. In the Enter the name of the Host field, type the name of the node.
Note: The unique node name must be the name of a valid host. This name is restricted to 255 characters.
4. In the Enter a description of the Host field, type a short description to help identify the host.
5. In the Select the operating system running on the Host field, select an operating system from the list of values.
6. In the Enter any aliases of the Host field, type any aliases that are associated with the host.
Note: Aliases can be entered on separate lines or separated by commas (for example, Alias1, Alias2, Alias3).
7. Click Next. The Collector Location panel appears. This panel does not appear for operating systems of type Other.
8. In the Is there or will there be a Collector installed on the Host? field, click either Yes or No and click Next. The Data Gathering panel appears.
9. Select Yes to gather system information from the application’s host in the Do you want to gather system information? field.
10. Select Yes in the Do you want to monitor applications on this host? field.Select
CommVault Simpana from the list of applications.
11. Click Next and the Remote System Information Permissions panel appears. The Remote System Information Permissions panel only appears if the following conditions are met:
• The operating system is Windows.
• A Collector is not installed on the computer. • System information is to be monitored.
12. In the User Name field, type the user name for an account that exists on the host. In the Password field, type the password for the user name. In the Confirm Password field, type the password again and click Next. The CommVault Information panel appears.
13. Click Next. The Recoverability Analysis Permissions panel appears.
14. Select Yes in the Do you want to perform Recoverability Analysis on this host
field to enable recoverability analysis on the application. Select a Credential used to connect, or click Edit to create or edit an existing credential.
15. In the Is the CommVault database stored remotely? field, click either Yes or No. If you clicked Yes, the Remote Database Settings region is enabled.
16. In the Hostname field, type the hostname of the CommVault database.
17. In the Instance Name field, type the instance name of the CommVault database. 18. Click Next. The Item Location panel appears. Click to select the folder in the
navigation tree for the node to appear. 19. Click Next and the Summary panel appears.
20. Click Finish to create the node. All applicable requests, proxy information, and credentials are assigned to the node and the Collectors are reloaded.