Model
Development
for a
Deferred-grazing
System
RICHARD C. G. SMITH AND WILLIAM A. WILLIAMS
Highlight: A model of the early growth of an annual pasture and liveweight response of grazing sheep was built using first order differential equations to study the practice of deferred grazing. The dynamic behavior of the system over time was simulated by solving the equations on a computer.
The model is an interpretative representation of a sub- terranean clover pasture in Western Australia and relates to a specific site and set of seasonal conditions. Use was made of the literature and a recent grazing experiment to develop the model. Herbage growth is estimated from known relationships with radiation received, leaf area exposed, soil moisture, and herbage removed by grazing. Change in soil moisture is estimated from rainfall and pan evaporation data. Defoliation is based on stocking rate, pasture weight, and pasture height to account for the effects of animal numbers and availability of pasture. Liveweight change of the consuming animal is calcu- lated as a function of intake, digestibility, and the partitioning of metabolizable energy between maintenance and weight change. Validation of the model by results observed in the grazing experiment is presented.
The early productivity of mediterranean annual pastures and the resulting weight gain of Merino sheep depend on interactions among pasture plants, climate, soil, and animals (Smith et al., 1972, 1973). It is beyond the scope of any single grazing experiment to control and vary individually all these factors. However, knowledge concerning processes that deter- mine the liveweight response of sheep grazing a mediterranean annual type pasture is sufficient to attempt an integrating model. The objective of this study was to synthesize these relationships into a dynamic model to aid our understanding of the system.
The model relates to a single species sward (subterranean clover ‘Woogenellup,’ Trifolium subterraneum) and a specific site and set of climatic conditions in Western Australia. Its construction was motivated by a desire to generalize from a specific field experiment (Smith et al., 1972 experiment B; and Smith et al., 1973) and data from the literature to the
Authors are postdoctoral fellow and professor, Department of Agronomy and Range Science, University of California, Davis. Dr. Smith’s present address is Department of Agronomy, University of New England, Armidale, N.S.W., Australia.
The senior author was in receipt of a postdoctoral fellowship from the Commonwealth Scientific and Industrial Research Organization, Australia. Computer services were supported by the National Science Foundation. Dr. N.W. Taylor, Department of Mathematics, University of New England, Australia gave valuable criticism and advice on the manuscript. Help in this work was also provided by Mr. E. F. Riddiscombe and Dr. G. W. Arnold, CSIRO, Western Australia, Profes- sor w. R. Stern, Department of Agronomy, University of Western Australia, and Mr. W. R. Powell, Department of Agronomy and Range Science, University of California, Davis.
Manuscript received December 26, 1972.
454
practice of deferred grazing (Bishop and Kentish, 1966). Thus the model was developed as a hypothesis about the dynamic behaviour of a specified system. Such a model makes use of an understanding of processes at the lower level of organization in the system to explain results at the higher level (de Wit, 1969). In the system under study, the lower level of organization consists of processes determining the growth and presentation of pasture, whereas the higher level consists of its consumption and animal conversion.
Model Description
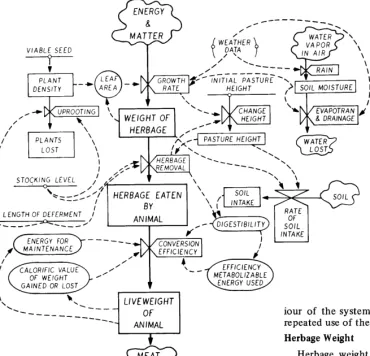
The transformation of energy and matter to sheep live- weight is central to the model (Fig. 1). The differential equations to calculate the rate of conversion involve considera- tion of the growth rate of pasture, its rate of removal by grazing, and the conversion of ingested pasture to sheep liveweight. For the solution of these equations, other func- tions are used to calculate the weight of herbage produced, pasture height, plant density, herbage intake and digestibility, soil moisture, and other phenomena.
The model was written for computer simulation in Fortran IV and its structure follows the form used by For-rester (196 1, 1969). The system is considered in terms of state variables which define the status of the system of any given point in time. The principal state variables are:
1) weight of herbage (kg/ha) 2) plant density (plants/dm2) 3) pasture height (cm) 4) liveweight of sheep (kg/ha)
5) soil moisture (cm in top 30 cm of soil) The current value of a state variable represents the accumulated difference between the flow of material into and out of that variable. Rates of flow are represented by first order differen- tial equations. To simulate the system the equations are solved numerically by a finite difference method, which uses differ- ence equations of the form:’
Y t + I = Yt + &At
where Y, is the value of a state variable at time t days from emergence of the pasture, Y, + 1 is the value of Y at t + 1 days from emergence, Y, = dY,/dt is the rate of change of Y, and At is the increment of time (one day in this model). A set of such difference equations is used to update the system each day. By this stepwise approach the dynamic performance of the system is simulated (Goodall, 1969).
The model is deterministic, that is, values of state variables are determined in accordance with “known” biological and physical relationships with no randomly varying elements.
‘The “dot” notation will be used throughout to denote a time rate of change.
PASTURE HEIGHT
I
:
I STOCKING LEVEL
I I \ \
‘\
\ LIVEWEIGHT.
t--___ ---___ .--_ OF
-_
i
ANIMAL
MEAT
a
PRODUCED
Equations of the System
Daily values of rainfall, pan evaporation and hours of sunlight from 1969 climatic records of the CSIRO Yalanbee Experiment Station, Western Australia, are read into the model prior to solution of the equations (Table 1). These data provide the basic input for simulating the system and are the same as those relating to the field experiment used to develop the model. Daily incoming radiation (RA) is estimated (in Cal/cm2 day) from sunlight hours (SUN) by an equation derived by Black et al. (1954):
RA = RMAX (0.23 + 0.48 SUN/DL)
where RMAX is the maximum possible radiation in the absence of atmosphere, and DL is the maximum possible duration of bright sunshine. Both values are obtained from meteorological tables (List, 1958).
To define the break of season, the model computes daily the sum of rainfall for periods of 14 days from March 1 until a value of 2.0 cm is exceeded. On that day growth is initiated. This value of 2.0 cm was derived by comparing the incidence of rainfall with the date of pasture emergence in the experiment used in deriving the model. The level of soil moisture (SM, ) at the break of season is calculated from total rainfall (RNT) and total pan evaporation (EOT) in the 14 day period as:
SM, = RNT - 0.4 EOT
where 0.4 is the ratio between evaporation from the soil sur- face and pan evaporation. The value of this coefficient was estimated from the field experiment.
Plant emergence is assumed to occur within 24 hours of the break of season, and initial plant density is equal to the density of viable seeds which are specified as an initial condition. Initial weight of pasture present on the day of emergence is calculated by assuming individual plant weight to equal 5 mg.
After the break of season has been located and initial soil moisture and pasture weight calculated, the dynamic behav-
JOURNAL OF RANGE MANAGEMENT 26(6), November 1973
_ __- ..- .
LEGEND
0 SOURCE OR SINK
0 STATE VARIABLE
0 AUXILLARY VARIABLE
DC3 RATE OF FLOW
-o- INITIAL CONDITION
I
4 b
DATA SUPPLIED TO THE MODEL EXTERNAL--* FLOW OF AN EFFECT - FLOW OF MATERIAL
Fig. 1. Flow diagram relating the early growth of a subterranean clover pasture to liveweight of grazing sheep.
iour of the system is simulated for the next 105 days by the repeated use of the equations in Table 1.
Herbage Weight
Herbage weight (HW) or green dry matter on offer to the sheep is considered a function of the rates of plant growth and removal by grazing (equation 1).
Herbage Growth Rate
The potential growth rate of herbage (Wp) with nutrients and water not limiting was predicted from leaf area index (L) and incoming radiation (equations 2-5). These equations were derived from the data of Black (1964) but were adjusted so that the relationship between Wp and L was assumed to be an asymptotic exponential (equation 5) to accord with the evidence of Brown and Blaser (1968). Error due to this assumption is not important to a model of early growth, since growth for the most part will occur below the optimum leaf area index. Wmax (equation 3) is the upper limit to growth rate imposed by the level of incoming radiation, and _K (equation 4). is a variable that determines the rate at which Wp approaches Wmax as L increases.
To determine actual growth rate (equation 6) the effects of soil productivity and moisture are represented by multipliers (Forrester, 1969). A multiplier is a dimensionless number that predicts the proportionate change in the rate due to the variable considered. The soil productivity multiplier (SPM) was estimated to be 0.82 by comparing simulated and observed results for HW (Smith et al., 1973). It is an overall scale factor to adjust Black’s (1964) data for soil differences, as detailed modeling of plant nutrition and other soil productivity factors is beyond the scope of the present study. The form of the soil moisture multiplier (SMM) (equation 7) is based on the work of Brockington (1969), who used a similar function to predict the effect of available soil moisture on pasture growth. The constant “2.1” in equation 7 was the level at which pasture growth was assumed to cease (i.e. SMM = 0). This value is lower than the estimated wilting point of the soil (2.5 cm) because growth did not appear to cease at this level in the field experiment.
Soil Moisture
The estimated levels of moisture in the top 30 cm of soil were 2.5 cm at wilting point (15 atm) and 5.0 cm at field capacity (0.3 atm) (Smith, 1970). Changes in soil moisture storage for the top 30 cm are calculated from an assessment of
_ -. -- _-- --_- -_ _ _
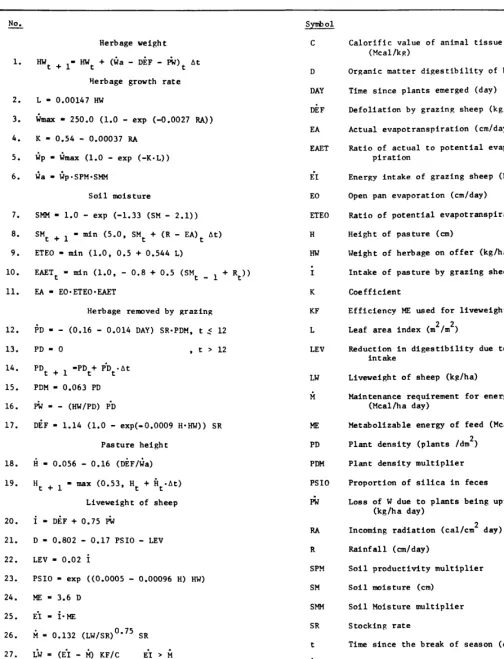
Table 1. Equations used in the model to simulate the system for 105 days from the break of season.
No
2
1.
2.
3.
4.
5.
6.
7.
8.
9.
10.
11.
12.
13.
14.
15.
16.
17.
18.
19.
20.
21.
22.
23.
24.
25.
26.
27.
28.
29.
30.
31.
Herbage weight
HW
t+1- HWt + (ia - DiF - I%J)t At
Herbage growth rate
L - 0.00147 HW
timax - 250.0 (1.0 - exp (-0.0027 RA))
K - 0.54 - 0.00037 lU
tip - &ax (1.0 - exp (-K-L))
tia - rjp*SPM*SMM
Soil moisture EO Open pan evaporation (cm/day)
SMM - 1.0 - exp (-1.33 (SM - 2.1))
SM
ETEO Ratio of potential evapotranspiration to EO
t+l - min (5.0, SMt + (R - EA)t At)
ETEO - min (1.0, 0.5 + 0.544 L)
EAETt = mln (1.0, - 0.8 + 0.5 (SMt _ 1 + Rt))
EA - EO*ETEO*EAET
H
HW
i.
Height of pasture
Weight of herbage
Intake of pasture
(cd
on offer (kg/ha)
by grazing sheep (kg/ha day)
K Coefficient
Herbage removed by grazing
.
PD - - (0.16 - 0.014 DAY) SR=PDM, t ,< 12
PD = 0 ,t>12
PD
t+l =PDt+ P'Dt.At
PDM = 0.063 PD
.
PW=- (HW/PD) pb
DiF - 1.14 (1.0 - exp(-0.0009 HeHW)) SR
Pasture height
.
H - 0.056 - 0.16 (DEF/ia)
H t + 1 - max (0.53, Ht + fit-At)
.
Liveweight of sheep
I = DiF + 0.75 ti
D = 0.802 - 0.17 PSI0 - LEV
LEV = 0.02 i
PSI0 = exp ((0.0005 - 0.00096 H)
ME = 3.6 D
Ei = i-ME
.
M - 0.132 (LW/SR)0'75 SR
LW - ($1 - I?) KF/C Ei > i
KF - 0.06 + 0.63 D
C - 0.13 LW/SR (LW/SR .I>, 10 kg
iw - (E'I - A) 15.5 EI sl;i
LW
t+l - LWt + iWt l At
Symbol
C Calorific value of animal tissue anabolized
(Mcal/kR)
D Organic matter digestibility of herbage
DAY
DiF
Time since plants emerged (day)
Defoliation by grazing sheep (kg/ha day)
EA Actual evapotranspiration (cm/day)
EAET Ratio of actual to potential evapotrans-
piration
E'I Energy intake of grazing sheep (Meal/ha day)
KF
L
LEV
Efficiency ME used for liveweight gain
Leaf area index (m2/m2)
Reduction in intake
digestibility due to level of
LW
ri
Liveweight of sheep (kg/ha)
Maintenance requirement for energy by sheep (Meal/ha day)
ME
PD
PDM
PSI0
PiJ
Metabolizable energy of feed (Meal/kg)
Plant density (plants /dm2)
Plant density multiplier
Proportion of silica in feces
Loss of W due to plants being uprooted (kg/ha day)
RA
R
SPM
SM
SMM
SR
t
&ax
Incoming radiation (Cal/cm2 day)
Rainfall (cm/day)
Soil productivity multiplier
Soil moisture (cm)
Soil Moisture multiplier
Stocking rate
Time since the break of season (day)
Maximum herbage growth rate with only RA limiting (kg/ha day)
Potential herbage growth rate with L and RA limiting (kg/ha day)
Actual herbage growth rate with L, R, SM
and soil productivity limiting (kg/ha day)
the balance between water input (rainfall) and withdrawal (evapotranspiration) (equation 8). Evapotranspiration (EA) was calculated from open pan evaporation (EO) by using multipliers to allow for the effect of leaf area and available soil moisture (equations 9-l 1). The ratio of potential evapotrans- piration to pan evaporation (ETEO) (equation 9) is taken to increase with leaf area index (L) until L = 0.92. The ratio of actual evapotranspiration (EA) to potential evapotranspiration (EAET) (equation 10) is taken to increase with soil moisture (SM) until SM = 3.6 cm.
This method of simulating soil moisture has been used by Fitzpatrick and Nix (1969). The values of coefficients were determined iteratively until the predicted and observed values (Smith et al., 1972 experiment B) for soil moisture agreed. Herbage Removed by Grazing
During early growth of annual pasture, animals may remove herbage by uprooting of plants and defoliation (Greenwood and Arnold, 1968). In subterranean clover the main loss of plants by uprooting occurs in the first 12 days after emergence (i.e. t < 12) (Smith, 1970). Loss of plants is estimated in equations 12-13 as a function of stocking rate (SR), days from emergence (DAY), and plant density (Smith, 1970). The plant density multiplier (PDM) (equation 15) accounts for the decline in number of plants uprooted as plant density decreases and was chosen for reasons of logic to prevent plant loss from exceeding plant density at high stocking rates. Equation 14 is the finite difference equation for deriving plant density for the next day.
Weight of herbage lost as whole plants is calculated by estimating individual plant weight and multiplying by the number of plants lost (equation 16).
Defoliation rate (DEF) (equation 17) is calculated as a function of HW, pasture height (H), and stocking rate.
Pasture Height
Pasture height influences the ease with which sheep can prehend pasture (Allden and Whittaker, 1970), and the relationship between intake and weight of pasture tends to be an asymptotic exponential (Arnold and Dudzinski, 1967). Coefficients for equation 17 were derived from the data of Smith et al. (1972). The constant “1.14” in equation 17 is the maximum rate of defoliation by an individual sheep and was estimated to give the maximum liveweight gain recorded in the field experiment.
Without grazing, pasture height is considered to increase at a constant rate of 0.056 cm per day. Grazing is then postulated to decrease this rate, the amount depending on the ratio between rate of defoliation and rate of pasture growth (equation 18). The coefficients of equation 18 were calculated to fit the pasture height data of the field experiment. In equation 19 pasture height is assumed to have an absolute minimum of 0.53 cm.
Liveweight of Sheep
The intake rate of pasture by the grazing sheep is considered equal to the amount removed by defoliation plus 3/4 of the plants uprooted (equation 20).
The proportion of the ingested pasture digested (D) (equations 21-23) is considered to depend on level of intake and amount of soil in the diet (measured as silica in the feces). The digestibility of subterranean clover at zero intake of soil is taken to be 0.802 during vegetative growth (Smith, 1970). The digestibility is then reduced according to the level of intake (LEV) (Graham, 1969) and the proportion of silica in the feces (PSIO) (Smith et al., 1972, 1973). In equation 23 the proportion of silica in the feces (PSIO) is calculated as a function of the weight and height of pasture present (Smith,
1970), to reflect the effect of pasture availability on soil intake.
The amount of metabolizable energy (ME) derived from the digested pasture is calculated in equation 24 to be 3.6 Meal per kg of digested pasture (Blaxter, 1964), and using this value the total rate of intake of ME (EI) to meet the energy requirement of the grazing sheep is calculated in equation 25.
The daily maintenance requirement rate (&I) of the sheep is calculated in equation 26 as a function of liveweight (LW) (Young and Corbett, 1968).
Rate of liveweight change (LW) is calculated after allowing for the maintenance requirement of the sheep. If intake of ME @I) exceeds maintenance (M) then liveweight gain is calcu- lated by equation 27 (Blaxter, 1967). In equation 28 the efficiency with which ME surplus to maintenance is used for tissue synthesis (KF) is calculated from Agricultural Research Council (1965) data as a function of digestibility (Blaxter 1966). In equation 29 the caloric value of the weight gain (C) is calculated as a function of liveweight (Searle and Graham
1970).
If intake of ME @I) is below maintenance (M), then the loss in liveweight is calculated by equation 30 (Blaxter, 1967), where the denominator, 5.5, is the amount of metabolizable energy in liveweight loss in Meal per kg (Farrell et al., 1972).
Equation 31 is the finite difference equation for calculating total liveweight per hectare for the next day.
Initial Conditions
In simulation runs to test and develop the model, state variables except for soil moisture were given the same values as those in the field experiment (Smith et al. 1972). Initial conditions were:
i) Plant density at emergence - 20 plants/dm’ ii) Plant weight at emergence - 5 mg/plant
iii) Plant height immediately following emergence - 1.0 cm
iv) Stocking rate - 0 and 10 sheep/ha, t < 36 days and 10 sheep/ha, 36 < t < 105 days
v) Liveweight of sheep used to evaluate effects of grazing treatment for the first 36 days - 27.5 kg/sheep
In the field experiment plots were either grazed contin- uously (SR = 10) or were deferred (SR = 0) for the first 36 days from pasture emergence. Thereafter they were all stocked (SR = 10) with a new set of sheep uniform in age, breed, and weight to evaluate the grazing treatments. A similar procedure was adopted during simulation runs to test and develop the model.
Model Performance
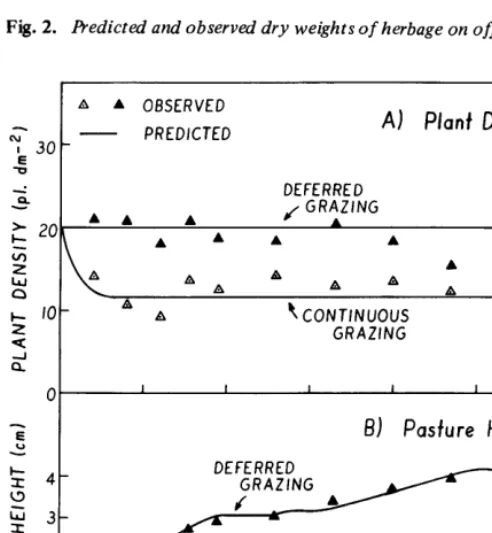
Predictions of the weight of herbage available agreed with measured values in general (Fig. 2).-There were -deviations between predicted and measured values under continuous grazing at-the beginning of the experiment and under deferred grazing at the end of the experiment. The measured values have coefficients of variation of about 30% (Smith, 1970), therefore, the deviations are probably not significant.
The model agreed with measured values of plant density and pasture height (Fig. 3A, 3B).
Predictions of pasture growth rate did not deviate substan- tially except at the end of the experiment (Fig. 4). There it was probably due to bias in the enclosure technique used in the field experiment for estimating growth rate:
100
u 20 40 60 80 100 120
DAYS FROM EMERGENCE
Fig. 2. &edict& and observed dry weights of herbage on offer.
b A OBSERVED
PREDICTED AI Plant Density
I- 10
t
A
A f CONTINUOUS
2 GRAZING
2
00
f3) Pasture Height A
GRAZING
I I 1
0 20 40 60 80 100 I20
DAYS FROM EMERGENCE
Fig. 3. Predicted and observed values of (A) plant density and (B) pasture height.
indicates that the samples taken were representative mainly of moisture deficit periods.
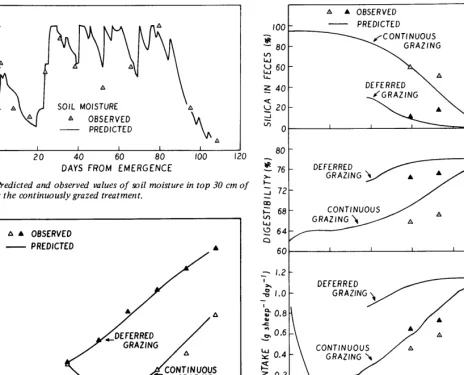
Predicted values of sheep liveweight agreed closely with measured values (Fig. 6). Variables underlying the prediction of liveweight change deviated systematically from measured values (Fig. 7). The underestimation of fecal silica caused early values of digestibility to be overestimated (Fig. 7A,B). This, associated with a compensating overestimate of intake (Fig. 7C), simulated actual liveweight (Fig. 7). The apparent overestimate of intake may not be real due to a negative bias in measured intake resulting from the method of fecal collection (Smith et al. 1973).
458 JOURNAL OF RANGE MANAGEMENT 26(6), November 1973
I
A A OBSERVED IDAYS fROM EMERGENCE
Fig. 4. l+edicted and observed values of growth rate of herbage dry matter. Observed values are means over a 14day interval.
Model Critique
The inclusion of soil ingested as a factor influencing digestibility is based on recent evidence (Smith et al., 1972, 1973; Young and Corbett, 1972). In an earlier version of the model digestibility was assumed constant, but a systematic deviation between predicted and observed liveweights was eliminated subsequently by relating digestibility to level of soil intake.
Several factors have been omitted from this model. The effect of dry residue from the previous year on subsequent pasture growth and diet of grazing animals was not included because of its absence in the experimgnt used to develop the model.
The explicit effect of temperature was omitted in the segment predicting pasture growth. It is known that tempera- ture affects the growth rate of spaced subterranean clover plants (Morley, 1958; Bouma and Dowling, 1969) but this effect was not observed by Davidson et al. (1970) with plants growing in dense communities with or without defoliation. De Wit and Brouwer (1968) have recorded a similar lack of temperature response by maize plants grown in a crop in contrast to plants grown singly. It appears that the effect of temperature may vary with the stage of crop growth. The mechanism of this effect in subterranean clover is not clear, and therefore temperature has not been included explicitly in the current model. However, its effect is partly accounted for by its association with radiation.
Effect of the physiological state of the sheep and its genetic makeup on maximum intake and effect of stage of plant growth on herbage digestibility were excluded because they were not considered important in relation to the objective of the model.
SOIL MOISTURE
- PREDICTED
a
g
2.01
I I I I I0 20 40 60 80 100 120
DAYS FROM EMERGENCE
Fig. 5. Predicted and observed values of soil moisture in top 30 cm of soil, for the continuously grazed treatment.
Ol3SERVED
PREDICTED
I I I I 1
20 40 60 80 100 120
DAYS FROM EMERGENCE
Fig. 6. Predicted and observed values of liveweight of sheep for deferred and continuousgrazing.
of defoliation in equation 17. These coefficients are used as scaling factors, but they have biological meaning, and their values are not unrealistic.
The present predictive power of the model has several limitations. For example, the break of season and subsequent seed germination were assumed to occur in one day. There- fore, for the model to have predictive value for different years, equations to relate rate of seed germination and seedling survival to climatic conditions during the break of season are needed. Also, the model only relates to a single species sward, so that additional equations to predict the effect of species composition are needed before the model may have predictive value for different pasture types. The information needed to expand the model are available in part from published data, but much will have to be derived from further experimenta- tion.
These deficiencies should not detract from the value of the model as a hypothesis about the system’s behaviour. It was for this purpose that the model was constructed and used to make postulates about the response of a subterranean clover pasture to variations in initial plant density, and the manage- ment variables of stocking rate and length of deferment. The testing and improvement of this hypotheiss should provide a basis for furthering our understanding of animal-pasture interactions during the early growth of annual pasture.
2
2 60 - LL g 40-
$20-
v, 0, I
8
80
ii! 76 DEFERRED
:
i
721
/
“V
I
c
4 1.2
0” -u 1.0 I
,Q 0.8 2
v, 0.6 .z
LLI y 0.4 s 5 0.2
DEFERRED
CONTINUOUS
01 I I I I
0 20 40 60 80 100 I
OAYS FROM EMERGENCE
0
Fig. 7. Predicted and observed values of (A) silica in feces, (B) digesti- bility of eaten pasture, and (C) intake of herbage for grazing sheep. Observed values are means over a 14day interval.
Literature Cited
Agricultural Research Council. 1965. The nutrient requirements of farm livestock. No. 2, Ruminants. Agricultural Research Council: London. Allden, W. G., and I. A. McD. Whittaker. 1970. The determinants of
herbage intake by sheep: The inter-relationship of factors influenc- ing herbage intake and availability. Aust. J. Agr. Res. 21:755. Arnold, G. W., and M. L. Dudzinski. 1967. Studies on the diet of the
grazing animal. II. The effect of physiological status in ewes and pasture availability on herbage intake. Aust. J. Agr. Res. 18:349-359.
Bishop, A. H., and T. D. Kentish. 1966. The effects on liveweight and wool production of autumn deferment with hay feeding. Proc. Aust. Sot. Anim. Prod. 6: 164-168.
Black, J. N. 1964. An analysis of the potential production of swards of subterranean clover (Trifolium subterraneum L.) at Adelaide, South Australia. J. App. Ecol. 1:3-18.
Black, J. N., C. W. Bonython, and J. A. Prescott. 1954. Solar radiation and the duration of sunshine. Quart. J. Roy. Mcteorol. Sot. 80:231-235.
Blaxter, K. L. 1964. Utilization of the metabolizable energy of grass. Proc. Nutr. Sot. 23:62-71.
Blaxter, K. L. 1966. The energy metabolism of ruminants. 2nd ed. Thomas, Springfield, Ill. 332 p.
Blaxter, K. L. 1967. The effect of the dietary energy supply on growth. p. 329. In G. A. Lodge and G. E. Laming (ed.) Growth and development of mammals. Butterworths, London.
Bouma, D., and E. J. Dowling. 1969. Effects of temperature on growth and nutrient uptake in subterranean clover during recovery from phosphorus stress. 1. Growth changes. Aust. J. Biol. Sci. 22:505-S 14.
Brockington, N. R. 1969. A simulation model of grass production in relation to water supply. Annual report of the Grassland Research Institute, Hurley, United Kingdom, p. 140.
Brown, R. H., and R. E. Blaser. 1968. Leaf area index in pasture growth. Herb. Abs. 38: l-9.
Davidson, J. L., A. H. Gibson, and J. W. Birch. 1970. Effects of temperature and defoliation on growth and nitrogen fixation in subterranean clover. Int. Grassl. Congr. Proc. 11:542-545.
DeWit, C. L., and R. Brouwer. 1968. Uber ein dynamisches Model1 des vegetativen Wachstum von Pflanzenbestanders. Zeit. Fur Ange- wandte Bot. 42:1-12.
DeWit, C. L. 1969. Dynamic concepts in biology. In Productivity of photosynthetic systems, model and methods. IBP/PP Technical meeting. Trebon, Czech. p. 17-23.
Farrell, D. J., R. A. Leng, and J. L. Corbelt. 1972. Undernutrition of grazing sheep. I. Changes in the composition of the body, blood and rumen content. Aust. J. Agr. Res. 2 1:483.
Fitzpatrick, E. A., and H. A. Niz. 1969. A model for simulating soil water regime in alternating fallow-crop systems. Agr. Meteorol. 6:303-319.
Forrester, J. W. 1961. Industrial Dynamics. M.I.T. Press, Cambridge, Massachusetts. 464 p.
Forrester, J. W. 1969. Urban Dynamics. M.I.T. Press, Cambridge, Massachusetts. 285 p.
Goodall, D. W. 1969. Simulating the grazing situation. In F. Heimets (ed.) Biomathematics Vol. I. Concepts and models of biomathe- matics. Marcel Dekket, New York. p. 21 l-236.
Graham, N. McC. 1969. The net energy value of artificially dried subterranean clover harvested before flowering. Aust. J. Agr. Res. 20~365-373.
Greenwood, E.A.N., and G. W. Arnold. 1968. The quantity and frequency of removal of herbage from an emerging annual grass sward by sheep in a set stocked system of grazing. J. Brit. Grassl. Sot. 23: 144-147.
List, R. J. (ed.) 1958. Smithsonian Meteorological Tables. Smithsonian Institution, Washington. 527 p.
Morley, F. H. W. 1958. Effects of strain and temperature on the growth of subterranean clover (Trifolium subterraneum L). Aust. J. Agr. Res. 9:745-753.
Searle, F. W., and N. McC.Graham. 1970. Body composition of growing sheep and its relevance to pasture evaluation. Proc. Aust. Sot. Anim. Prod. 8:472.
Smith, R. C. G. 1970. Early growth of annual pasture and liveweight gain of sheep in south-western Australia. Ph.D. Thesis. University of Western Australia.
Smith, R. C. G., E. F. Biddiscombe, and W. R. Stem. 1972. Evaluation of five annual pasture species during early growth. Aust. J. Agr. Res. 23 :703-7 16.
Smith, R. C. G., E. F. Biddiscombe, and W. R. Stern. 1973. Effects of spelling of newly sown pastures. Aust. J. Exp. Agr. Anim. Husb. In press.
Watt, K. E. W. 1968. Ecology and resource management. p. 241. McGraw-Hill, New York.
Young, B. A. and 3. L. Corbett. 1968. Energy requirement for maintenance of grazing sheep measured by calorimetric techniques. Proc. Aust. Sot. Anim. Prod. 7:327-334.
Young, B. A. and J. L. Corbett. 1972. Maintenance energy require- ments of grazing sheep in relation to herbage availability. II. Observations on grazing intake. Aust. J. Agr. Res. 23:77-85.
How to
Prepare
a Range
Soil Monolith
NORMAN C. DONALDSON AND DEWAYNE .I. BECK
Highlight: Step-by-step instructions are given for preparation of range soil and vegetation monoliths. These are slices of range vegetation and soil mounted on boards for demonstrations and educational purposes. A complete list of
materials needed for preparation of monoliths is described.
This technical note gives improved procedures for the preparation of range soil monoliths. These monoliths with range vegetation are useful to show pro- duction, root growth, and kind of soil. They show what is happening to the soil,
Authors are soil scientist, Soil Scientist, Soil Conservation Service, U.S. Department of Agri- culture, Colfax, Washington; and range conser- vationist, Soil Conservation Service, U.S. De- partment of Agriculture, Dayton, Washington.
Manuscript received January 6, 1973.
460
root development, and soil properties. soil monolith: Monoliths are useful visual aids. Range
conservationists working with ranchers find them of particular value when ex- plaining range condition classes, soil mois- ture relationships, relationships between plants, blend of soil and site, and effects of grazing management (Anderson,
1951). The range soil monoliths are 3 x 4 ft in size and weigh loo-150 lb. They can be hauled to rural community meetings without damage and are useful as office displays.
Method of Preparation
The range soil monoliths were pre- pared by using the same procedures described by Smith et al. (19521, using some revisions of solutions by Berger and Muckenhirm (1945). Following is a step- by-step procedure for preparing a range
JOURNAL OF F ?ANGE MANAGEMENT 26(6), November 1973
1. Carefully select the section to be represented on the monolith. A string should be stretched over plant species to help maintain their alignment on the mount.