First testing experiments with measurement of pool boiling
heat transfer coefficient on a new apparatus
ViktorVajc1,∗and MartinDostál1,∗∗
1Department of Process Engineering, Faculty of Mechanical Engineering, Czech Technical University, 166 07 Prague, Czech Republic
Abstract.We have designed a simple apparatus for measurement of heat transfer during pool boiling in order to find or create suitable correlations for heat-transfer coefficient, which could be used for various liquids and conditions. We have run several testing experiments with tap and deionized water. This contribution presents proceedings and the first results of these experiments as well as comparison of these results with some published and verified correlations.
1 Introduction
Pool boiling is a process, which is commonly used in various industries, e.g., energetics, petroleum refining, petrochemical and chemical industry, distillation plants, process-gas and air-separation industries, food and bever-age production, refrigeration industry, etc. Heat exchang-ers are apparatuses in which boiling typically occurs. If they are used to generate vapor for a distillation column, then they are called reboilers. Otherwise, when used for other purposes, they are often labeled as vaporizers. There is no principal difference between reboilers and vaporiz-ers.
Nucleate boiling is one and the most common regime of boiling characterized by nucleation of new bubbles. Bubbles emerge on heating surface from nucleation em-bryos, which are entrapped in cavities, i.e., irregularities of a heating surface. Nucleation of new bubbles occurs in periodic cycles.
Pool boiling is a special type of boiling during which any movement of liquid phase related to the heating sur-face is caused only by emerging bubbles. In other words there is no external factor responsible for liquid movement during pool boiling.
2 Correlations for heat transfer coefficient
There are a lot of heat transfer correlations, which can be used to estimate heat-transfer coefficientαduring sat-urated nucleate pool boiling. They are based on diff er-ent (often contradictory) assumptions and theoretical ap-proaches. A list of some of these correlations can be found in Vajc [1]. Several of these correlations are considered as verified and are recommended by worldwide community of scientists and engineers. We will briefly describe five
∗e-mail: [email protected] ∗∗e-mail: [email protected]
of these correlations and use them later to compare our experimental results with values they predict.
Rohsenow [2] correlation
Nub=
1 Csf
Reb2/3Prl1−m (1)
was derived already in 1952 and still probably is the most used and validated correlation for saturated nucleate pool boiling. CoefficientCsfdepends on combination of
boil-ing liquid and material of heatboil-ing surface, e.g., for water – stainless steelCsf =0.013, for water–brassCsf =0.006
and for ethanol–chromeCsf =0.0027. Exponentm=1.7
for various liquids boiling on clear heating surfaces ex-cept for water, for whichm =1.0. Bubble Nusselt num-ber Nub =αDL/λl, Prandtl number of liquid Prl =µl/al,
bubble Reynolds number
Reb=
q DL
µl∆hlg
(2)
and Laplace’s bubble diameter.
DL =
s σ
g %l−%g
. (3)
Correlation (1) is dimensionless and was originally based on experimental datasets obtained for pressure ranges from 101 kPa to 17 MPa, although it was successfully applied for pressures outside this range. For example McGillis et al. [3] used this correlation even for vacuum of 16 kPa.
in-terface measured through the liquidβc=45◦) they derived
Nub=0.246·107
q Db
λlTsat
!0.673
∆hlgD2b
a2 l
−1.58
·
·
cp,lTsatD2b
a2 l
1.26
%l−%g
%l
!5.22
. (4)
Bubble departure diameter should be obtained from Fritz [5] correlation
Db=CdβcDL, (5)
where value of coefficientCd = 0.0208 is usually taken
andDLis calculated with (3).
Nishikawa [6] correlation respects roughness of the heating surface. Jones et al. [7] present it in modified di-mensional form
α= 31.4p0cr.2
Mm0.1Tcr0.9
8 Ra Ra0
!0.2 (1−pred) p0.23 red q
0.8
(1−0.99pred)0.9
. (6)
Reference roughness Ra0 = 0.4 µm, Mm needs to be
in kg kmol−1,pcrin Pa andTcrin kelvins.
Mostinski [8] arrived at the dimensional correlation
α=0.00417p0cr.69q 0.7
Fp. (7)
According to Mostinski, pressure correction factor should be calculated using
Fp=1.8p0red.17+4pred1.2+10p10red. (8) Yagov [9] derived correlation based on his approximative model of nucleate pool boiling
q=3.43·10−4 λ
2∆T3
νlσTsat
1+∆hlg∆T Mm 2RmTsat2
! · ·1+ p1+800Cb+400Cb
. (9)
Dimensionless boiling parameter
Cb=
∆hlg(%gνl)3/2
σ(λlTsat)1/2
. (10)
Tsatin (9) and (10) should be in kelvins. In order to use
equation (9), relation
∆T =q/α (11)
based on Newton’s cooling law was put into (9) andαwas calculated iteratively.
3 Experimental apparatus and procedure
3.1 The apparatus
Experiments were performed on the apparatus shown in Fig. 1. Apparatus was opened, which means, that vapor could escape into ambient air and water had to be refilled after some time. Experiments were thus executed under atmospheric pressures, which was measured with pressure web sensor Comet T7510.
Fig. 1. Apparatus assembly; 1 Heated block, 2 Heating car-tridges, 3 Auxiliary heater, 4 Glass cylinder, 5 Isolating pad, 6 Assembly pad, 7 Plug
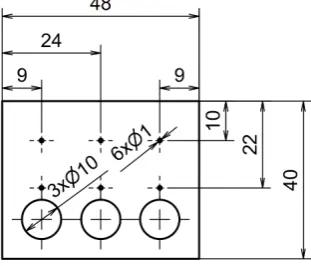
Fig. 2.Drawing of the heated block
Cylinder made of borosilicate glass with internal di-ameter of 200 mm stands on stainless-steel bottom with an opening for square 48×48 mm stainless-steel heated block. Stainless-steel components are made of 1.4301 ac-cording to ˇCSN EN 10 0027-2. Top side of the block serves as a heating surface for liquid in the cylinder. The block stands on isolating pad made of glass and is heated by three horizontally-placed cartridge heaters with diame-ter of 10 mm, length of 60 mm and nominal power of one cartridge 400 W. We also used auxiliary heating spiral made of Inconol-800 with nominal power of 3 kW. Power supplied to cartridges and spiral was set with variacs.
Gap between the block and the bottom is sealed with a combination of epoxy resin Kittfort Epoxy 1200 and Ver-sachem silicone, which should withstand temperatures up to 320◦C.
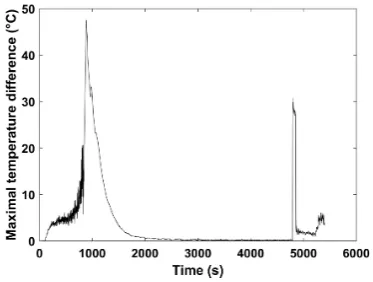
Fig. 3.Development of maximal temperature difference in time
There are six 25 mm long horizontal holes of 1 mm diameter drilled into the heated block as is shown in Figure 2. These holes were aligned in two horizontal lines. Six thermocouples – usually some combination of sheathed OMEGA TMQSS-040(U)-6 and bare-wire OMEGA 5TC-TT-K-36-72 – were inserted into the holes to measure temperatures inside the block. Tips of bare-wire thermocouples were coated with OB-600 chemical-set cement. Temperature of the liquid was measured with thermocouple probe TJ36-CASS-116(U)-12. Tip of the probe is placed about 15 mm above the heating surface.
Reference point with temperature 0◦C for cold ends of thermocouples was created with ice-point calibration ref-erence chamber OMEGA TRCIII-A. Calibration probes TRP-K-36 and TRP-T-36 were inserted into its six cylin-drical chambers. External module JanasCard AD24USB was used to convert signals from thermocouples and bring them to PC input.
3.2 Principle of measurement
We use six temperatures measured by thermocouples in-side the heated block to calculate average temperatures in both lines. Then we calculate:
• temperature gradient inside the block; • temperature of the heating surfaceTw;
• heat flux q assuming, that thermal conductivity of the blockλ=15 W m−1K−1.
We than use measured temperature of the liquid bulkTlto
determine superheat
∆T =Tw−Tl. (12)
Finally we obtain desired heat-transfer coefficient from Newton’s cooling law, i.e.,α=q/∆T.
3.3 Data evaluation
Sampling period of AD24USB was set to one second. During measurements we found out, that time needed for reaching a steady state, in which temperatures are stabi-lized, is pretty long. In order to find sufficiently-stable regions, we used arbitrary time step∆t=60 s and waited until differences of all temperatures measured at timet1
Table 1.Table of results
No.
(−)
Points
(−)
Tw (◦C)
Tl (◦C)
Tsat (◦C)
q
(W m−2)
α
(W m−2K−1)
1 289 108.5 98.7 99.2 81080 8231
2 127 106.8 98.4 99.2 81041 9628
3 1792 109.3 98.9 99.1 82234 7866
4 2114 109.5 98.7 99.1 82027 7564
5 90 106.9 98.7 99.4 99422 12164
6 690 106.8 98.8 99.4 92407 11567
7 101 106.7 98.8 99.4 90812 11483
8 168 107.0 98.4 99.3 93343 10964
and at timet2=t1−∆tfell and stayed below an arbitrary
limit value – typically of about 0.3◦C. Common change
of maximal temperature difference with time can be seen in Figure 3. Peak at time of about 3 700 s is caused by a change of power supplied to heaters. Region between 1 650 and 3 700 s in Figure 3 was considered to be stable. Average temperatures in both rows of the heated block were calculated simply as an arithmetic mean of temper-atures in corresponding row. Temperature difference be-tween both lines lied typically bebe-tween 50 and 70◦C.
All needed thermophysical properties of water were obtained from MATLAB script X Steam, which can be downloaded from www.x-eng.com.
4 Results
Results from eight chosen testing measurements are pre-sented in Table 1. Values ofαcalculated with correlations mentioned in section 2 are in Table 2. Correlations were used for heat fluxesq from 80 to 100 kW m−2. For
cal-culations we assumed pressure p = 98.8 kPa, which is an average pressure calculated from saturation pressures corresponding to saturation temperatures given in Table 1. For Nishikawa correlation (6) roughness of the heating surfaceRa=0.4µm was used. This value is based on sty-lus-method measurement on stationary surface-measuring station Mahr Marsurf XR 20.
Graphical comparison of measured data and trends of correlations mentioned in section 2 are in Figure 4. One can clearly see, that the Rohsenow correlation (1) predicts the highest heat-transfer coefficients.
5 Discussion
Table 2.Heat-transfer coefficientα(W m−2K−1) estimated from correlations for different heat fluxesq(kW m−2)
Correlation q=80 85 90 95 100 kW m−2
Rohsenow 9572 9966 10353 10733 11107
St. & Ab. 7483 7794 8100 8400 8695
Nishikawa 7480 7852 8219 8582 8942
Mostinski 8196 8552 8901 9244 9582
Yagov 6937 7224 7505 7781 8052
coefficients were measured compared to those, that were correlated, but the trend more or less corresponds to those obtained with correlations. Several possible explanations of such results offer themselves. From Table 1 one can see, that liquid temperatureTlis lower than saturation
temper-atureTsatfor all measurements. This means, that for these
measurements boiling was subcooled in average by 0.6◦C.
Nucleate-pool-boiling correlations are usually (although not always) created precisely for saturated boiling. For the same heat flux larger subcooling should reduce heat-trans-fer coefficient, which is however not satisfied for dataset in Table 1.
Another problem (which cannot be deduced from Ta-ble 1) is, that temperatures measured by thermocouples in one horizontal row differed in a relatively large extent, es-pecially for the thermocouple line closer to heating car-tridges. These differences were of about 3 to 4 ◦C for
the upper line, but of about 6 to 8◦C for the lower line. Such a variation might indicate unwanted heat conduction in horizontal direction, which should be eliminated, since the measurement method described in section 3.2 is based on the assumption of one-dimensional vertical heat con-duction.
Heat-transfer coefficients were measured for relatively high heat fluxes due to inability to reach stable and suf-ficiently-intense bubble nucleation at lowerq. Auxiliary heating spiral was not separated from the liquid bulk above the heating surface, but careful adjustments of supplied electric power were made to suppress bubble nucleation on the spiral as much as possible. We could not com-pletely prevent bubble nucleation on the spiral, because sufficiently-stable temperature of the liquid bulkTlwould
then not be reached. Power supplied to the spiral was com-parable with power supplied to heating cartridges.
Heat fluxes q were calculated from the temperature gradients in the heated block, which means, that they are based on average temperatures measured by thermocou-ples. Due to possible heat conduction in horizontal di-rection actual reached heat fluxes could be different from those, that were calculated. It would be useful to compare heat fluxes obtained with this method and those measured for example with wattmeters connected to supply wiring.
For presented measurements thermocouples were not calibrated, but we verified, that measured temperatures of
Fig. 4. Comparison of measured heat-transfer coefficients and trends predicted by correlations
the liquid intensively boiling on auxiliary heater agreed very well with tabulated saturation boiling temperatures corresponding to measured atmospheric pressures. Nev-ertheless we want to calibrate all measuring thermocou-ples for future measurements. Temperature of the boiling liquid seemed constant in the whole bulk as we tried to change position of the thermocouple probe submerged in the boiling liquid. Epoxy used to seal the gap between the heated block and the bottom of the apparatus degraded af-ter some time. It eventually unsticked from the bottom and sometimes drops of water seeped. When this hap-pened, experiments were immediately stopped, apparatus was completely dismantled and assembled again.
We want to install new isolations for both the glass cylinder and the heated block. These isolations should be made of solid materials instead of currently-used pliable glass wool, which is also unsuitable for wet environments. Also vertical orientation of heating cartridges will help to install the isolation more easily, improve temperature dis-tribution inside the heated block and reduce heat losses. With horizontally-placed cartridges front and back faces of the block can not be isolated at all. We also want to sepa-rate auxiliary heating spiral from the liquid bulk above the heating surface.
During measurements with tap water limescale de-posited on the heating surface and created almost continu-ous thin coating. In view of the fact, that this coating might significantly influence boiling heat transfer, we decided to switch tap water for deionized water.
6 Conclusion
We have run several testing experiments on our apparatus, measured heat-transfer coefficients during nucleate pool boiling and compared obtained results with some verified nucleate-pool-boiling correlations.
On the one hand some measured points evince trends comparable to values calculated with correlations, on the other hand four heat-transfer coefficients from approxi-mately 7.5 up to 9.6 kW m−2K−1were obtained for almost
We observed temperature differences inside the heated block in horizontal direction, which need to be lowered in order to satisfy the fundamental assumption of one-dimen-sional heat conduction in the heated block.
We are planning to implement adjustments mentioned in section 5 Possible not-mentioned improvements and modifications will follow as we proceed with our measure-ments.
This work was supported by the Ministry of Education, Youth and Sports of the Czech Republic under OP RDE grant number CZ.02.1.01/0.0/0.0/16_019/0000753 “Research centre for low-carbon energy technologies” and by the Grant Agency of the Czech Technical University in Prague, grant No. SGS18/129.
Nomenclature
a thermal diffusivity (m2s−1) cp isobaric specific-heat capacity (J kg−1K−1)
Cb boiling parameter in (9) (−)
Cd coefficient in (5) (−)
Csf liquid–surface coefficient in (1) (−)
Db bubble departure diameter (m)
DL Laplace’s diameter (m)
Fp pressure-correction factor in (7) (−) g gravitational acceleration (m s−2)
m exponent in (1) (−)
Mm molar mass (kg mol−1)
Nu Nusselt number (−)
p pressure (Pa)
Pr Prandtl number (−)
q heat flux (W m−2)
Rm universal gas constant (J mol−1K−1)
Ra surface roughness (m)
Ra0 reference roughness in (6) (m)
Re Reynolds number (−)
t time (s)
T temperature (K)
α heat-transfer coefficient (W m−2K−1)
βc contact angle (◦)
∆t time difference (s)
∆T superheat (K)
∆hlg specific latent heat of vaporization (J kg−1)
λ thermal conductivity (W m−1K−1)
µ dynamic viscosity (Pa s)
ν kinematic viscosity (m2s−1)
% density (kg m−3)
σ surface tension (N m−1)
Subscripts:
b related to bubble cr critical property g related to vapor phase l related to liquid phase red reduced
sat at saturation state
w related to the heating surface
References
[1] V. Vajc, Master’s thesis, Czech Technical University, Prague, Czech Republic (2017)
[2] W.M. Rohsenow, Tech. rep., MIT Division of Indus-trial Cooporation (1952)
[3] W.R. McGillis, J.S. Fitch, W.R. Hamburgen, V.P. Carey, Tech. Rep. 91/7, Western Research Laboratory (1991)
[4] K. Stephan, M. Abdelsalam, Int. J. of Heat Mass Transf.23, 73 (1980)
[5] W. Fritz, Phys. Z.36, 379 (1935)
[6] K. Nishikawa, Y. Fujita, H. Ohta, S. Hidaka, Proc. Seventh Int. Heat Transf. Conf.4, 61 (1982)
[7] B.J. Jones, J.P. McHale, S. Garimella, J. of Heat Transf.131, 1 (2009)