Geo-Information Technology for Coastal
Disaster Risk Reduction
V.M. Patel 1, M.B. Dholakia 2 , V. D. Patel 3
Research Scholar & Lecturer, Department of Civil Engineering, K.D. Polytechnic, Patan, Gujarat, India1
Professor, Department of Civil Engineering, L.D. College of Engineering, Ahmedabad, Gujarat, India2
Assistant Professor, Department of Civil Engineering, Government Engineering, Katpur - Patan, Gujarat, India3
ABSTRACT: Geo-information techniques have proven their usefulness for the purposes of early warning and emergency response. These techniques enable us to generate extensive geo-information to make informed decisions in response to natural disasters that lead to better protection of citizens, reduce damage to property, improve the monitoring of these disasters, and facilitate estimates of the damages and losses resulting from them. Three-dimensional (3D) models make perceiving real world easy. A 3D model shows what is going to change and happen at the end of a new design. 3D visualizations of spatial objects are employed in an increasing number of applications from the areas of urban planning, city marketing, tourism, and facility management. To reach a beneficial decision, it convinces decision maker by providing sufficient argument. 3D model of urban buildings helps to future decision-making process for reorganizing current urban building structures. In this study discuss various methods of data source capture from satellite, aerial imagery, laser scanner and terrestrial imagery data used to create 3D model. In this paper, the 3D model of Okha coast was generated using CAD software MAP 3D. In order to do this, a Google earth image was used to generate 3D model. The satellite images overlaid on the tsunami risk map, and identified the region to be particularly at risk in study area. In our study satellite images integrated with GIS/CAD, can give information for assessment, analysis and monitoring of disaster. We expect that the results of case study presented here will supportive disaster risk reduction model.
.
KEYWORDS: Geo-information, RS, GIS, CAD, 3D
I. INTRODUCTION
GIS and remote sensing are incredibly useful and effective tools in disaster management. These technologies have been the object of substantial interest for all countries and bodies concerned with space and in exacting emergency services and disaster management. In disaster management, the objectives of the disaster experts are to monitor the situation, simulate the complicated disaster occurrence as accurately as possible so as to come up with better prediction models, suggest appropriate contingency plans and prepare spatial databases. Remotely sensed data can be used very effectively for quickly assessing severity and impact of damage due to, earthquakes, landslides, flooding, forest fires, cyclones and other disasters.
During the disaster prevention stage, GIS is used in managing the huge levels of data required for vulnerability and hazard assessment. In the disaster preparedness stage, it is a tool for planning evacuation routes, designing centres for emergency operations, and for the integration of satellite data with other relevant data in the design of disaster warning systems. In the disaster relief phase, GIS, in combination with GPS, is extremely useful in search and rescue operations in areas that have been devastated and where it is difficult to find one’s bearings. In the disaster rehabilitation stage, GIS is used to organize the damage information and post-disaster census information and in the evaluation of sites for reconstruction.
activities that reduce the vulnerability of societies to the impacts of a disaster, while preparedness refers to activities that facilitate preparation for responding to a disaster when it occurs . Post-disaster applications are associated with response and recovery efforts. Response is related to the immediate and short-term effects of a disaster, while recovery refers to activities that restore communities to pre-disaster conditions, such as reconstruction.
Three-dimensional models of urban buildings suitable for various applications such as urban planning, visualization, environmental studies and simulation (pollution, noise), tourism, facility management, real estate management, telecommunication network planning, 3D cadastre and vehicle/pedestrian navigation are of increasing importance in urban areas. The biggest advantage of the 3D model is its mobility (Sauerbier and Lambers, 2003) and it’s convincing effect on users for future decision making processes. It can be shown everywhere and allows people who cannot or do not want to travel to get to know the region all the same. Due to the improvement of transportation infrastructures, rural migration as well as high natural birth rates, expanding economies and the effects of globalization in general, these cities increase quickly in size and get a regional extend. So, to monitor, control and guide these development trends, up-to date maps are needed as a basis for urban and regional planning (Zhang et al., 2002).
With the rapid development of technologies in recent years, such as the laser scanner, the airborne sensor and 3D computer graphics, 3D-CAD/GIS has been emerged with reality. The Objectives of the application are:
• To evaluate urban space efficiently and to provide information about urban planning to local communities • Visualize complicated urban planning regulations in the 3D way to be easily understood.
• Compare the existing buildings and the regulations on the 3D city model. • Simulate the proposed urban development plans.
A. Emergency Response System along Coast of Gujarat
Gujarat state has the longest coastline in India, and has massive capital and infrastructure investments in its coastal regions (Singh et al., 2008). With rapid developmental activities along the coastline of Gujarat, there is a need for preparing tsunami risk 3D visualizations database using geo-information technology. The coast of Gujarat is prone to many disasters in past (Singh et al., 2008). Some of the most devastating disasters that have struck the state in the last few decades include: the Morbi floods of 1978; the Kandla (port) cyclone of 1998; the killer earthquake in Kutch, January 26th 2001; and the flash floods in south Gujarat in 2005 and in Surat in 2006. Also in the past the coast of Gujarat was affected by tsunami (Jaiswal et al., 2009; Singh et al., 2012, Patel et al., 2014). Visualization is the graphical presentation of information, with the goal of improving the viewer understands of the information contents. Comprehension of 3D visualized models is easier and effective than 2D models. 3D visualization models are important tools to simulate disaster from different angle that help users to comprehend the situation more detailed and help decision makers for appropriate rescue operations. 3D visualizations are tools for rescue operations during disasters, e.g., cyclone, tsunami, earthquake, flooding and fire, etc (Patel et al. 2013, 2014).
B. Importance of Geo-Information Technology for Tsunami Risk Visualization
The tsunami risk visualization created by geo-information technologies of Geographic Information Systems (GIS), Remote Sensing (RS) and Computer Aided Design (CAD) are powerful tools for conveying information to decision-making process in natural disaster risk assessment and management. Visualization is the graphical presentation of information, with the goal of improving the viewer understands of the information contents. Comprehension of 3D visualized models is easier and effective than 2D models. 3D visualization models are important tools to simulate disaster from different angle that help users to comprehend the situation more detailed and help decision makers for appropriate rescue operations. 3D visualizations are tools for rescue operations during disasters, e.g., cyclone, tsunami, earthquake, flooding and fire, etc.
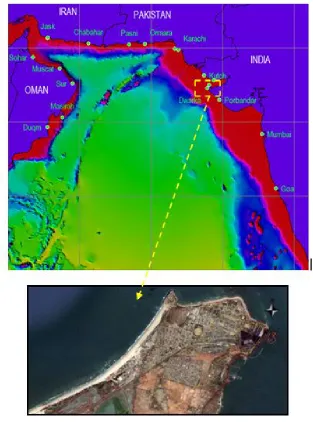
visualisations have the potential to be an even more effective communication tool (Zlatanova et al. 2002; Kolbe et al. 2005). Previous studies have shown that the presentation of hazard, vulnerability, coping capacity and risk in the form of digital maps has a higher impact than traditional analogue information representations. Graphical representation significantly reduces the amount of cognition effort, and improves the efficiency of the decision making process, therefore disaster managers increasingly use digital maps. Better disaster management strategies can be designed by visualization. In this paper, the 3D model of Okha coast,Gujarat was generated using CAD software MAP 3D. The location of Okha coast is shown in Fig. 1.
Fig. 1. Location of the Okha Coast, Gujarat
results presented here will be supportive to the tsunami emergency response system and useful in planning the protection measures due to tsunami.
II. DATASOURCEFORGENERATIONOF3DURBANMODEL
For generation of 3D urban models various methods of raw data capture are available (Wolf, 1999). There are various raw data such as satellite imagery, aerial imagery, laser scanner data and terrestrial imagery.
A. Satellite imagery
In case of large areas, recently high resolution satellite imagery is used, like the 1-meter panchromatic from Ikonos. Satellite imagery data is used to study and monitor land features, natural resources and dynamic effects of human activities on urban areas. A broad base map of the city and city region, indicating physical features may be prepared quickly with help of satellite imageries. The data capturing process is the same as with aerial images, but the accuracy is less, measurement error can be up to 1 meter in height. DTM and Orthophoto can be derived automatically (Ulm, 2003).
B. Aerial Imagery
Now a day’s aerial imagery is being used for generation of base maps and other thematic maps for urban areas as it prove to be cost and time effective and reliable. The information about land features, land use, built up areas, city structure, physical aspects of environment etc. is available from aerial imagery. Aerial imagery methods are well suited for the economic acquisition of 3D city models, making it possible to recover the structure as well as the dimensions. On the other hand, classical photogrammetric measurement is mostly point based, which does not exploit the inherent structure of buildings and thus cannot be optimal economically (Brenner et al., 2001). At that moment, aerial images are the most common used raw data. For capturing the 3D point cloud, the stereo pairs of the images are needed. The scale of the images depends on the accuracy that is required for the 3D model and is normally about 1:5000 with a forward and a side overlaps of 30 and 60 percent respectively. If the images are used for True-Orthophoto, the side overlap is suggested to be 60 percent. Using this data, many building details can be measured from the aerial images and the measurement error is maximal 0.2 meter in height (Ulm, 2003).
C. Laser Scanner Data
For the generation of 3D city models from lasers canner data, densities of laser scanner points of more than 2 points/sqm are required. Big areas are already surveyed with laser scanner, which is seen as an advantage for the application of this data. The procedure for the calculation of 3D building models from laser scanner data uses a tangential plane as a first approximation that suits the laser scanner points. From this geometric model, edge lines are derived whereas edge lines of building structures are generated (e.g. eaves lines, ridge lines etc.). The accuracy is expected to be 0.3-0.5 meters in height (Ulm, 2003). Automatic systems working solely on the basis of DSMs acquired by laser scanning have been reported. Since DSMs represent the geometry of the surface directly, they have advantages with regard to automated interpretation (Brenner et al., 2001).
D. Terrestrial Imagery
III. CASESTUDY
In this study, a 3D model of Okha coast, Gujart is tried to be built using different data sources such as google earth image, SRTM data, and different visualization techniques.
A. Raster layer operation:
The first step of raster layer operation is geo-referencing of satellite images. Satellite images collected from Google Earth orthophotos were used for geo-referencing. Nine pairs of images (RGB, jpeg format) from Google Earth cover the study area. There was an average of 12 ground control points (GCPs) collected for each image registration. The World Geodetic System 84 (WGS84) geographic projection was selected for image-to-image registration with Digital Globe image. After creating the geo-referenced images, all images are mosaiced to generate a whole geo-referenced image. The next step of raster layer operation is the digital elevation model (DEM) generation. A DEM is defined as a file or a database containing points over contiguous areas (Manual of photogrammetry 2004). The needed field height data for DEM generation can be obtained from point, line or polygonal vector height maps or stereo satellite/vector images. The SRTM data were used to create DEM. The geo-referenced image and DEM results constitute the basis of vector layer operations. This study uses SRTM data to generate the tsunami risk zone map.
B. Vector layer operation
The purpose of 3D GIS/CAD modelling was the thematic visualization of the disaster vulnerability of Okha generated from a 3D model. The geo-referenced image of the Okha coast was used for 2D building footprint in AutoCAD Map 3D. AutoCADMap 3D provides access to geographic information system (GIS) and mapping data to support planning, design and data management. The building footprint layer was generated according to height value governed by the number of floors to create 3D building shapes.
IV. RESULTS AND DISCUSSION
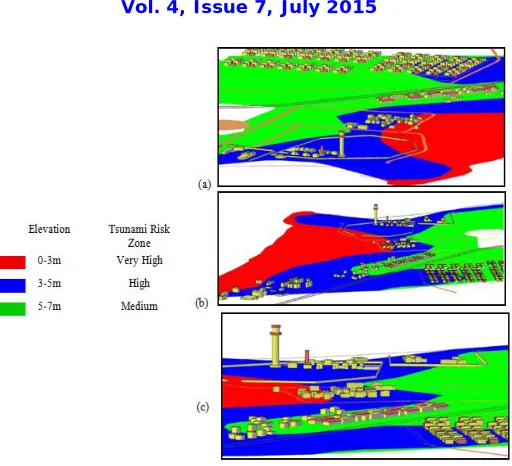
Fig. 2. Classification of Tsunami Risk Zone
Fig. 4. Visualization of 3D tsunami risk model of Okha with different viewing angles
V. CONCLUSION
In the future, scientists/researchers need to focus on 3D visualization and animation of disaster risk. The study was performed to show the advantages of 3D GIS/CAD models and satellite images in disaster risk assessment of the Okha coast, Gujarat. The disaster risk visualization created by geo-information technologies of Geographic Information Systems (GIS), Remote Sensing (RS) and Computer Aided Design (CAD) are powerful tools for conveying information to decision-making process in natural disaster risk assessment and management. The main aim of the 3D Okha model is to visualize each building’s tsunami risk level which improves decision-maker’s understanding of the disaster level. Merging of SRTM elevation data with satellite images is suitable for disaster risk assessment. Combining the advanced computer-aided modelling, GIS-based modelling, and Remotely sensed data and also using conventional and traditional knowledge, it is possible to develop a suitable disaster management.
ACKNOWLEDGMENT
The VMP is grateful to Dr B. K. Rastogi, Director General, Institute of Seismological Research (ISR), for permission to use ISR library and other resource materials; and also thankful to A. P. Singh, Scientist, ISR, for encouragement to conduct such studies for the benefit of science and society.
REFERENCES
[1] Brenner C., Haala N., and Fritsch D., 2001. Towards fully automated 3D city model generation. In Proc. Workshop on Automatic Extraction of Man-Made Objects from Aerial and Space Images III, Ascona.
[2] Jaiswal RK, Rastogi BK, Singh AP. 2008. Past tsunamis in the Arabian Sea and future possibilities. Indian Miner. 61_62:75_82.
[3] Jaiswal RK, Singh AP, Rastogi BK. 2009. Simulation of the Arabian Sea tsunami propagation generated due to 1945 Makran earthquake and its effect on western parts of Gujarat (India). Nat Hazard. 48:245_258.
[4] Jaiswal RK, Singh AP, Rastogi BK, Murty TS. 2011. Aftershock sequences of two greatSumatran earthquakes of 2004 and 2005 and simulation of the minor tsunami generated on September 12, 2007 in the Indian Ocean and its effect. Nat Hazard. 57(1):7_26.
[5] Karsli F., Ayhan E., Tunc E., 2003, Building 3D Photo-Texture Model Integrated With GIS for Architectural Heritage Conservation, CIPA 2003 New Perspectives to save The Cultural Heritage, Antalya, Türkiye.
[7] Manual of Photogrammetry. 5th ed. 2004. American Society for Photogrammetry and Remote Sensing ASPRS, Falls Church, Virginia; p. xvi C 1151.
[8] Marincioni F. 2007. Information technologies and the sharing of disaster knowledge: the critical role of professional culture, disasters. Disasters. USA: Blackwell Publishing; p. 459_476.
[9] Pasko, M. and Gruber, M., 1996. Fusion of 2D GIS data and aerial images for 3D building reconstruction. International Archives of Photogrammetry and Remote Sensing, Vol. 31, pp. 257–260.
[10] Patel VM, Dholakia MB, Singh AP. 2013. Tsunami risk 3D visualizations of Okha coast, Gujarat (India). Int J Eng Sci Innov Technol. 2:130_138.
[11] Patel VM, Dholakia MB, Singh AP, 2014, Emergency Preparedness in the Case of Makran Tsunami: a Case Study on Tsunami Risk Visualization for the Western Parts of Gujarat, India, Geomatics Natural Hazard and Risk, Taylor & Francis, DOI: 10.1080/19475705.2014.983188.
[12] Singh, A. P., Bhonde, U., Rastogi, B. K., and Jaiswal, R. K., 2008, Possible Inundation Map of Coastal Areas of Gujarat with a Tsunamigenic Earthquake,” Indian Journal of Geosciences, 61 (3-4) & 62 (1-4), 59-64.
[13] Singh, A. P., Murty, T. S., Rastogi,,B.K. and Yadav ,R.B.S., 2012, Earthquake generated Tsunami in the Indian Ocean and probable vulnerability assessment for the east coast of India. Marine Geodesy, 35, 49-65.
[14] Sauerbier M., Lambers, K., 2003. A 3D Model of the Nasca lines at Palpa (Peru), International Archives of the Photogrammetry, Remote Sensing and Spatial Information Sciences, vol. XXXIV-5/W10.
[15] Ulm, K., 2003. Improved 3D City Modeling With Cybercity- Modeler (Cc-Modeler™) Using Aerial-, Satellite Imagery And Laserscanner Data, International Archives of the Photogrammetry, Remote Sensing and Spatial Information Sciences, Vol. XXXIV-5/W10.
[16] Wolf M., 1999. Photogrammetric Data Capture and Calculation for 3D City Models. Photogrammetric Week ’99, pages 305– 312, Stuttgart,Germany.
[17] Zhang L., Feiner J., Louy O., Gruen A., Schmid W., 2002. Photo-textured Digital Terrain Models as a Basis for Regional and Local Planning, International Workshop on Visualization and Animation of Landscape, IAPRS Vol. XXX IV, Part NO., 5/W3, Kunming, China.
[18] Zlatanova, S., A. Fabbri, A. and J. Li, 2005, Geo-information for Disaster Management: Large scale 3D data needed by Urban Areas. GIM International, 19 (3), pp. 10-13.