Predictive Machinability of Lm25 aluminum
alloy in CNC turning operation with the help
of Taguchi Technique
Shakeela .K
1, Manu Ravuri
2,
Gunasekhar reddy.G
3P.G. Student, Department of Mechanical Engineering, Madanapalle Institute of Technology and Science, Madanapalle, India1
Assistant Professor, Department of Mechanical Engineering, Madanapalle Institute of Technology and Science, Madanapalle, India2
ABSTRACT: Machining is one of the Core operation in most of the Manufacturing firms as it consumes most of the time,material and effort .The development of any manufacturing industry lies in proper ,controlled machining environment. Hence to avoid wastage of Material and ensure in time production it is necessary to optimize the machining Process. This can be achieved through optimizing certain parameters like Speed ,feed , and depth of cut etc. The Controlled machining process can be achieved through Pre simulated study or predicting the values in a Computer environment. Predictive study of parameters ensures better machinability in a specified time without much wastage of resources.
In the Present Work turning operation is carried out on LM 25 Aluminum alloy in a medium duty CNC Lathe with a multi coated carbide tool. Taguchi L9 orthogonal array method is applied for design of experiments with certain of cutting parameters ,those are a cutting speed of 1000, 1500, 2000m/min, feed rate of 0.025, 0.05, 0.075mm/rev, and cutting depth0.5, 0.75, 1mm. An attempt has been made to generate models to predict surface roughness using Taguchi technique. Anova Analysis is also performed to predict the Material removal rate and to find out the factors that influence the surface roughness.
KEYWORDS:Machinability, Turning operation, ANOVA, Taguchi technique, Surface roughness, MRR
I. INTRODUCTION
In the present context Surface finish is one of the primary asset to any product which is desirable by the consumer .Surface finish is dependent on the texture and surface roughness of the material.The surface roughness can be controlled through controlling certain factors like corrosion , friction ,temperatures and stresses influencing on the material.The surface finish of the machined component is dependent on the type of tool utilized for machining Various types of tool materials ,ranging from high carbon steel to ceramics and diamonds are used as cutting tools in today’s metal working industry. To ensure surface finish and to avoid roughness it is essential to select the proper tool size ,material before machining.
Predictive study of parameters in a computer environ ment ensure least wastage of resources and time.Anova analysis provides a better tools for simulated study of parameters
II. LITERATURE SURVEY
process parameters, such as speed feed, depth of cut and noise radius of single point cutting tool. The L9 orthogonal array is selected for experimental planning. The result from conducted experiment analysis showed that the two of higher levels of cutting speed, depth of cut and lower level of feed is essential to achieve simulations increase of MRR and decrease of surface roughness. M.Madicet.al Presented an approach by coupling artificial neural network (ANN)and improved harmony search algorithm(IHSA)to determine the optimum cutting parameter settings for minimizing surface roughness when turning of polyamide material. An ANN model surface roughness was developed in terms of cutting speed ,feed rate ,depth of cut, and tool nose radius using the data from the turning experiment conducted according to Taguchi’s L27 orthogonal array. The optimal cutting parameter settings were determined by applying the IHSA to the developed ANN surface roughness model. KanaseTanaji. SandJadhav D.B.the experimentation is as follows, done on a lathe CNC turning machine to do machining of a different types of work pieces material with using different types of cutting tool bits and a set of values to be for give cutting parameters. These same experimentation is repeated at different values of parameters. To find the optimized solution of the taguchi method is using as constantly for experimentation. Mr. Manoj Kumar SahooWe reported the optimization of turning process by taking effects of machining parameters in the form of applying taguchi method. Basically speed,feed and depth of cut. But all of these parameters only one parameter is taking as variable parameter and the remaining two are as fixed fixed parameters. So in these way the maximum value of each parameters is obtained. The designing of taguchi orthogonal array is done with Three levels of turning parameters by the help of software MINITAB lab.Harsimran SinghSodhi and Harjot Singh Discusses an investigation is to be done in order to optimize surface roughness generated on conventional lathe with the using of taguchi parameters. In this paper control parameters to be considered as cutting speed, feed rate and depth of cut. The machining samples of work pieces to be using for orthogonal array and parameters to be considered in thes way, after experimentation. This study is to be for produce an optimum combination of controlled parameters for the surface roughness .E.Daniel Kirby discusses an investigation is to be done in order to surface roughness generated on CNC lathe with the using of taguchi parameters. This study expresses the standard orthogonal array of speed, feed and depth of cut but noise factors is a little bit of damaging the jaws. In order to get robustness and its increase of applicability the noise factors are included. After experimentally study a turning sample of work piece is using the selected orthogonal array and parameters. With a given set of parameters the study to be produces a finalized combination control factors and a predictive equations for determining surface texture.
III.OBJECTIVESOFTHEWORK
The objective of the work is to discuss the several techniques of Taguchi technique and plan that are accepted in order to find the following parameters by both experimentally and Taguchi techniques.
The use of arrays to study the effort to machining parameters influence on surface roughness.
To optimize turning operation parameters for surface roughness, material removal rate.
IV.EXPERIMENTAL STUDY
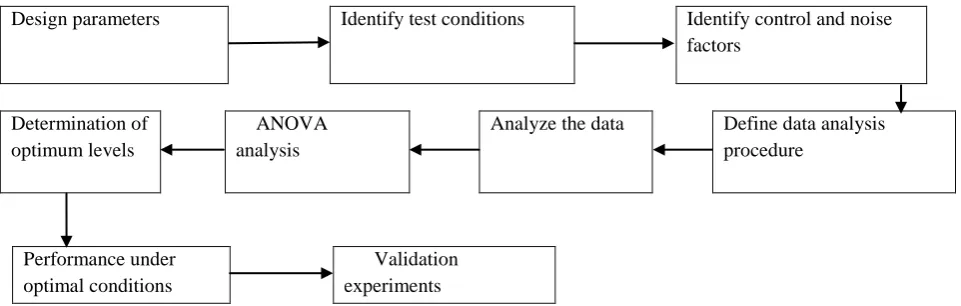
Fig: 1 Methodology to determine the effectiveness of the turning parameters on surface roughness of Al-LM25 alloy
Al-LM25 alloys were used in this study shown the below table the data related to the respective chemical composition of the aluminium alloy. This aluminium alloys is primarily used in aerospace engineering.
4.1 Chemical composition of LM25
ELEMENT S CONTRIBUTION (%)
Copper 0.20
Magnesium 0.25-0.65
Silicon 6.5-7.5
Iron 0.55
Nickel 0.15
Zinc 0.15
Lead 0.15
Tin 0.05
Titanium 0.05- 0.25
Manganese 0.35
V. EXPERIMENTAL WORK AND PROCEDURE
Fabrication of metal matrix composite requires very good interfacial bond condition between matrix and reinforcement. In our study aluminium (LM25) material is preheated to 8500c using pre heater furnace. Fig c shows the casting setup used in the experiment, Electric furnace was used to melt LM25. It was heated up to 8000c the material will be melts. Later melt was poured into a die of diameter 30mm and 100mm length. After finishing the material we done turning operation by using CNC Lathe machine.
(a) (b) (c)
Fig: fig(a) Preparing a casting mould, fig(b) Pattern for casting ,fig(c)Furnace
(d) (e) Fig: Fig(d) casted specimens ,fig(e) Machined specimen
4.3 FLEXTURN MTAB CNC LATHE TOOL:
FLEXTURN MTAB CNC Lathe tool was available at Madanapalle institute of technologically and science, which was used for experimentation purpose.
Specifications of CNC Lathe tool:
Range of spindle speed 150-4000 rpm
Range of Feed rate up to 5000 mm/min
Bed type 450 slant bed, length 300mm
Maximum swinging range of diameter on chuck 80mm
Chuck size 100mm
Maximum turning length 195mm
Power 3phase, 415W, 50Hz
Fig: FLEXTURN MTAB CNC Lathe tool
Fig: 3-Jaw chuck, Tool post, Tail stock of CNC Lathe tool, and figure represents the fixed specimen to chuck
5 Types of Tool Inserts According to Coatings:
Tool inserts are categorized in to two types
A). Coated B). Uncoated
The Coated tool inserts are sub divided in to The un coated tool inserts are categorized in to 1.Gradient Monolayer coated 1. Nitride Ceramics-SiC3N4
2. Two layer coated 2. Cermets’, and 3. Multilayer coated 3. Oxide Ceramics Al2O3
(a) (b) (c) Fig: fig(a)Turning tool inserts,fig(b) insert’s holders,fig(c) and turning operation with inserts
6.Measuring of surface roughness: By using the MITUTOYO surf tester (SJ-210 model) we can measure surface roughness (Ra), (Rq), (Rz) with cutoff length 0.8mm and transverse length of 5mm. The surface roughness Ravalues
Fig: Measuring surface roughness of machined test specimen
7 Material removal rate
It is calculated by change in work piece volume to the taken during turning. MRR = [𝜋𝐷
2
4 −
𝜋𝑑2
4 ] x f x N mm 3
/min
Where D=Diameter before cutting in mm d=Diameter after cutting in mm f=Feed rate in mm/rev
N=Speed in rpm 8 Mach inability study
8.1 Taguchi method
Select an experimental design:
As per levels and factors quantity the experimental design will be selected, for this project we were selected the L9 array design. This design consists of total quantity of 9 trail runs or tests should be carryout by project.
Analysis of DOE data:
Numerical approaches will be used in data analysis.
1. Identification of relevant and irrelevant impacts and interfaces or relations.
2. Grade of virtual significance of factor impacts and interfaces or relations. Analysis of variance (ANOVA) can notice the relative meaning of each factor by allocating a numerical value.
3. Empirical mathematical model of response versus experimental factors. The form of the mathematical model could be linear or polynomial, plus interactions. DOE data analysis can also provide graphical presentations of the mathematical relationship between experimental factors and output, in the form of main-effects charts and interaction charts.
Full factorial design of experiments:
A full factorial design may also be called a fully crossed design.
S. No Speed (rpm) Feed (mm/rev) Doc (mm)
1 1000 0.05 0.5 2 1000 0.05 0.75 3 1000 0.075 1 4 1500 0.025 0.75
5 1500 0.05 1
6 1500 0.075 0.5 7 2000 0.025 1 8 2000 0.05 0.5
8.2 Design of experiments
In order to determine optimal cutting parameters from the experimental observations the depth of cut is considered. The experimentation of this paper is to study, orthogonal array has been used to find the effect of the three process parameters.
Design parameters Identify test conditions Identify control and noise factors
Determination of optimum levels
ANOVA analysis
Analyze the data Define data analysis procedure
Performance under optimal conditions
Validation experiments
8.3 Process parameters based on L9 orthogonal array
Process parameter Unit Level 1 Level 2 Level 3
Cutting speed m/min 1000 1500 2000
Feed rate mm/rev 0.025 0.05 0.075
Depth of cut Mm 0.5 0.75 1
Table 3: Process parameters used at various levels
The machining tests were conducted according to the 3 level and 3 factors orthogonal array. The experiments are planned using the taguchi technique .The experiments were conducted at 3 different cutting speeds (1000, 1500, 2000 m/min) with 3 different feed rates (0.025, 0.05, 0.075 mm/rev) and varying cutting depth (0.5, 0.75, 1 mm). The cutting parameters and their levels are indicated in Table 3.
8.4ANOVA Analysis
The recorded experimental results are investigated using analysis of variance (ANOVA) for determining the parameters affecting the performance measures on the total variance of the results.
Table4: Design of experiments and experiment results
8.5 Results and Discussion
8.5.1 Surface roughness (Ra) Results
Taguchi Analysis: Surface Roughness versus Speed (rpm), Feed (mm/rev), DOC (mm)
Linear Model Analysis: SN ratios versus Speed (rpm), Feed (mm/rev), DOC (mm) Table 18: Analysis of Variance for SN ratio(R-Sq = 91.9%)
S. No Speed (rpm)
Feed (mm/rev)
DOC (mm)
Surface roughness MRR (m3/min) Ra Rq Rz
1 1000 0.025 0.5 1.22 1.59 8.072 0.545 2 100 0.05 0.75 1.50 1.912 9.58 1.627 3 1000 0.075 1 1.52 1.94 9.611 3.24 4 1500 0.025 0.75 1.24 1.64 7.67 1.22 5 1500 0.05 1 1.29 1.87 7.90 3.24 6 1500 0.075 0.5 1.40 1.75 8.49 2.45 7 2000 0.025 1 1.22 1.417 7.869 2.16 8 2000 0.05 0.5 1.25 1.65 7.06 2.18 9 2000 0.075 0.75 1.18 1.48 7.45 4.88
𝐒. 𝐍𝐎. ( 𝐫𝐩𝐦 )𝐒𝐩𝐞𝐞𝐝 𝐅𝐞𝐞𝐝 ( 𝐦𝐦 /𝐫𝐞𝐯 ) 𝐃𝐎𝐂 ( 𝐦𝐦 ) 𝐒𝐮𝐫𝐟𝐚𝐜𝐞 𝐑𝐨𝐮𝐠𝐡𝐧𝐞𝐬𝐬 ( 𝐌𝐢𝐜𝐫𝐨𝐧𝐬 ) Ra
SNRA MEAN
01 1000 0.025 0.5 1.22 -1.72720 1.22
02 1000 0.05 0.75 1.50 -3.52183 1.50
03 1000 0.075 1 1.52 -3.63687 1.52
04 1500 0.025 0.75 1.24 -1.86843 1.24
05 1500 0.05 1 1.29 -2.21179 1.29
06 1500 0.075 0.5 1.40 -2.92256 1.40
07 2000 0.025 1 1.22 -1.72720 1.22
08 2000 0.05 0.5 1.25 -1.93820 1.25
Source DF Seq. SS MS F P
Speed (rpm) 2 2.106 1.053 1.57 0.390
Feed(mm/rev) 2 1.277 0.638 0.95 0.513
DOC (mm) 2 0.099 0.049 0.07 0.931
Residual Error 2 1.344 0.672
Total 8 4.827
S = 1.198 R-Sq = 91.9% R-Sq (adj) = 67.6%
Linear Model Analysis: Means versus Speed (rpm), Feed (mm/rev), DOC (mm)
Table 19: Analysis of Variance for Means(R-Sq = 92.7%)
Source DF Seq. SS MS F P
Speed (rpm) 2 0.050 0.025 1.59 0.386
Feed(mm/rev) 2 0.030 0.015 0.96 0.510
DOC (mm) 2 0.002 0.001 0.08 0.929
Residual Error 2 0.032 0.016
Total 8 0.115
S = 0.06869 R-Sq = 92.7% R-Sq(adj) = 70.6%
Table 20: Response Table for Signal to Noise Ratios Smaller is better
Level Speed (rpm) Feed(mm/rev) DOC (mm)
1 -2.885 -1.774 -2.196
2 -2.334 -2.557 -2.276
3 -1.701 -2.588 -2.448
Delta 1.184 0.814 0.252
Rank 1 2 3
Table 21: Response Table for Means
Level Speed (rpm) Feed(mm/rev) DOC (mm)
1 1.400 1.227 1.290
2 1.310 1.347 1.307
3 1.217 1.353 1.330
Delta 0.183 0.127 0.040
Rank 1 2 3
Graphs 1&2:Main Effects Plot (data means) for SN ratios &Means
Main Effects Plot (data means) for Interaction Plot (data means) for Surface Roughness Surface Roughness
Graphs 3&4: Main Effects Plot (data means)&Interaction Plot (data means)for MRR
8.5.2 Surface roughness (Rq) Results
Taguchi Analysis: Surface Roughness versus Speed (rpm), Feed (mm/rev), DOC (mm)
𝐒. 𝐍𝐎. ( 𝐫𝐩𝐦 )𝐒𝐩𝐞𝐞𝐝
𝐅𝐞𝐞𝐝 ( 𝐦𝐦 /𝐫𝐞𝐯 )
𝐃𝐎𝐂 ( 𝐦𝐦 )
𝐒𝐮𝐫𝐟𝐚𝐜𝐞 𝐑𝐨𝐮𝐠𝐡𝐧𝐞𝐬𝐬 ( 𝐌𝐢𝐜𝐫𝐨𝐧𝐬 )
Rq
SNRA MEAN
01 1000 0.025 0.5 1.59 -4.027 1.590
02 1000 0.05 0.75 1.912 -5.629 1.912
03 1000 0.075 1 1.94 -5.756 1.940
04 1500 0.025 0.75 1.64 -4.296 1.640
05 1500 0.05 1 187 -5.436 1.870
06 1500 0.075 0.5 1.75 -4.860 1.750
07 2000 0.025 1 1.417 -3.027 1.417
08 2000 0.05 0.5 1.65 -4.349 1.650
Linear Model Analysis: SN ratios versus Speed (rpm), Feed (mm/rev), DOC (mm)
Table 22: Analysis of Variance for SN ratio(R-Sq = 94.74%)
Source DF Seq. SS MS F P
Speed (rpm) 2 4.0714 2.03568 10.31 0.088
Feed(mm/rev) 2 2.8434 1.42171 7.20 0.122
DOC (mm) 2 0.1962 0.09808 0.50 0.668
Residual Error 2 0.3948 0.19740
Total 8 7.5057
S = 0.444 R-Sq = 94.74% R-Sq (adj) = 78.96%
Linear Model Analysis: Means versus Speed (rpm), Feed (mm/rev), DOC (mm)
Table 23: Analysis of Variance for Means(R-Sq = 95%)
Source DF Seq. SS MS F P
Speed (rpm) 2 0.14917 0.074 10.64 0.086
Feed(mm/rev) 2 0.10649 0.053 7.59 0.116
DOC (mm) 2 0.01066 0.005 0.76 0.568
Residual Error 2 0.01402 0.007
Total 8 0.28034
S = 0.084 R-Sq = 95% R-Sq (adj) = 79.99%
Table 24: Response Table for Signal to Noise Ratios Smaller is better
Level Speed (rpm) Feed(mm/rev) DOC (mm)
1 -5.138 -3.784 -4.413
2 -4.865 -5.139 -4.444
3 -3.594 -4.674 -4.740
Delta 1.544 1.355 0.327
Rank 1 2 3
Table 25: Response Table for Means
Level Speed (rpm) Feed(mm/rev) DOC (mm)
1 1.814 1.549 1.663
2 1.753 1.811 1.677
3 1.516 1.723 1.742
Delta 0.298 0.262 0.079
Main Effects Plot (data means) for SN ratios Main Effects Plot (data means) for Means
Graphs 5&6:Main Effects Plot (data means) for SN ratios &Means
Graphs 7&8: Main Effects Plot (data means)&Interaction Plot (data means)for MRR
8.5.3 Surface roughness (Rz) Results
Taguchi Analysis: Surface Roughness versus Speed (rpm), Feed (mm/rev), DOC (mm)
𝐒. 𝐍𝐎. ( 𝐫𝐩𝐦 )𝐒𝐩𝐞𝐞𝐝
𝐅𝐞𝐞𝐝 ( 𝐦𝐦 /𝐫𝐞𝐯 )
𝐃𝐎𝐂 ( 𝐦𝐦 )
𝐒𝐮𝐫𝐟𝐚𝐜𝐞 𝐑𝐨𝐮𝐠𝐡𝐧𝐞𝐬𝐬 ( 𝐌𝐢𝐜𝐫𝐨𝐧𝐬 )
Rz
SNRA MEAN
01 1000 0.025 0.5 8.0729 -18.1396 8.072
02 1000 0.05 0.75 9.58 -19.6273 9.580
03 1000 0.075 1 9.611 -19.6554 9.611
04 1500 0.025 0.75 7.67 -17.6959 7.670
05 1500 0.05 1 7.90 -17.9525 7.900
06 1500 0.075 0.5 8.49 -18.5782 8.490
07 2000 0.025 1 7.869 -17.9184 7.869
08 2000 0.05 0.5 7.06 -16.9761 7.060
Linear Model Analysis: SN ratios versus Speed (rpm), Feed (mm/rev), DOC (mm)
Table 26: Analysis of Variance for SN ratio (R-Sq = 82.65%)
Source DF Seq. SS MS F P
Speed (rpm) 2 4.403 2.202 3.75 0.210
Feed(mm/rev) 2 0.625 0.313 0.53 0.653
DOC (mm) 2 0.564 0.282 0.48 0.675
Residual Error 2 1.174 0.587
Total 8 6.767
S = 0.766 R-Sq = 82.65% R-Sq (adj) = 30.61%
Linear Model Analysis: Means versus Speed (rpm), Feed (mm/rev), DOC (mm)
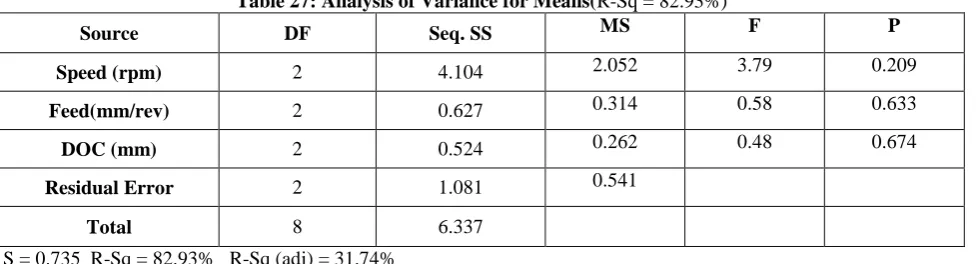
Table 27: Analysis of Variance for Means(R-Sq = 82.93%)
Source DF Seq. SS MS F P
Speed (rpm) 2 4.104 2.052 3.79 0.209
Feed(mm/rev) 2 0.627 0.314 0.58 0.633
DOC (mm) 2 0.524 0.262 0.48 0.674
Residual Error 2 1.081 0.541
Total 8 6.337
S = 0.735 R-Sq = 82.93% R-Sq (adj) = 31.74%
Table 28: Response Table for Signal to Noise Ratios Smaller is better
Level Speed (rpm) Feed(mm/rev) DOC (mm)
1 -19.14 -17.92 -17.90
2 -18.08 -18.19 -18.26
3 -17.45 -18.56 -18.51
Delta 1.69 0.61 0.61
Table 29: Response Table for Means
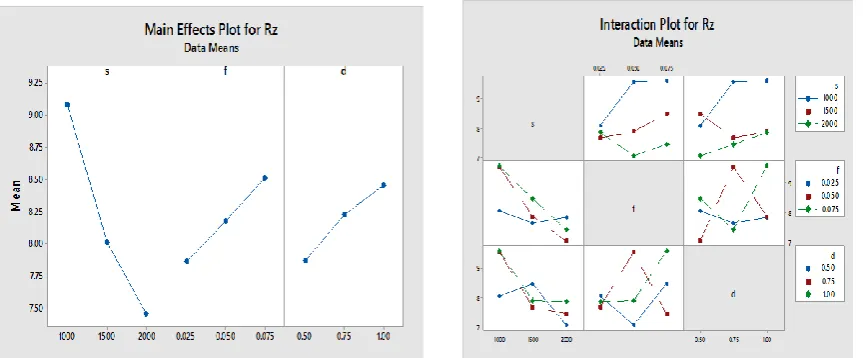
Level Speed (rpm) Feed(mm/rev) DOC (mm)
1 9.088 7.870 7.874
2 8.020 8.180 8.233
3 7.460 8.517 8.460
Delta 1.628 0.647 0.586
Rank 1 2 3
Main Effects Plot (data means) for SN ratios Main Effects Plot (data means) for Means
Graphs 9&10:Main Effects Plot (data means) for SN ratios &Means
VI. CONCLUSION
Hence machining is carried out on LM 25 Aluminium alloy and surface roughness values are derived for the specimen the turning operation parameters such as surface roughness, material removal rate are successfully optimized by using design of experiments .
REFERENCES
[1] Hardeep Singh, Rajesh Khanna, M.P.garg ,Effect of cutting parameters on MRR & Surface roughness in Turning EN-8 Engineering Research Vol.1, No.1(Dec. 2011).
[2] AdeelH.Suhail,N.Ismail,S.V.WongandN.A.AbdulJalil (2010), Optimization of cutting parameters based on surface roughness and assistance of work piece surface temperature in turning process ,American journal of engineering and applied sciences,vol.3(1),pp102-108.
[3] Dr.S.S.Chaudhari,, S.S.Khedkar and N.B.Borkar.“Optimization of process parameters using Taguchi approach with minimum quantity lubrication for turning”, International Journal of Engineering Research, Vol.1(4), 1268-1273.
[4] M.Madic , D.Markoic and M.Radovanovic,2012.“Application of surface roughness when turning polyamide using ANN-IHSA approach”, international journal of engineering and technology, Vol.1(4),432-443.
[5] KanaseTanaji.S and JadhavD. B,2013.“Enhancement of Surface Finish for CNC Turning Cutting Parameters by Using Taguchi Method”, Indian Journal of Research, Vol.3(5),88-91.
[6] Mr.Manoj Kumar Sahoo.“Parametric Analysis and Optimization ofTurning Operation by Using Taguchi Approach”, International Journal of Modern Engineering Research, Vol.3(4),2154-2156.
[7] Harsimran Singh Sodhi and Harjot Singh, 2013. “Parametric Analysis of Copper for Cutting Processes Using Turning Operations Based on Taguchi Method”, International Journalof Research in Mechanical Engineering&Technology,Vol.3(2),202-204.