San
SEISMIC BEHAVIOR AND DESIGN OF
STRUCTURE CONSISTING OF SC WALLS
Peter N. Booth
1
PhD Candidate, Dept. of Civil Eng
2
Associate Professor, Dept. of Civil Engineering,
3
Mitsubishi Heavy Industries, LTD
ABSTRACT
This paper presents the results shield wall (PSW) structure designed for a The PSW structure is composed
plates (two on the interior and exterior surfaces and one in the middle) for reinforcement Japan have tested a 1/6th scale physical model of the PSW structure
its lateral load-deformation behavior
benchmarking of a nonlinear inelastic finite element (NIFE) modeling and analysis approach for predicting the lateral load-deformation behavior of the
analysis results are compared with experimental observations, and used to gain additional insight into the lateral load-deformation behavior of the PSW structure. This additional insight is used to develop a simpler design approach for calculating the lateral load capacity of the PSW structure.
and analytical results indicate that the lateral load capacity of the tested PSW structure depends on the shear strength of the SC walls that constitu
INTRODUCTION
The design of nuclear power plant structures provides a unique set of challenges and conditions in comparison to typical commercial building structures. The extensive use of SC structures in the current generation of nuclear power plants is due to a combination of factors such as accelerated construction, improved quality control, and desirable structural properties. Research in the last few years has shown that SC structures can also be used more efficiently than reinf
nuclear facilities. Research has also shown that SC structures perform well for a wide range of structural loading conditions such as seismic loading (
(Varma, Malushte et al. 2011), and
Figure 1. Experimental test setup and cross
This paper investigates the seismic behavior and design
that is part of a typical PWR nuclear power plant design. The PSW structure is typically massive, and geometrically complex
Transactions, SMiRT-22
San Francisco, California, USA - August 18-23, 2013 Division X
SEISMIC BEHAVIOR AND DESIGN OF A PRIMARY SHIELD
STRUCTURE CONSISTING OF SC WALLS
Peter N. Booth1, Amit H. Varma2, and Mitsubishi Heavy Industries
, Dept. of Civil Engineering, Purdue University, W. Lafayette, IN rofessor, Dept. of Civil Engineering, Purdue University, W. Lafayette, IN
, LTD, Kobe, Japan.
results of a study on the seismic behavior and design
shield wall (PSW) structure designed for a typical pressurized water reactor (PWR) nuclear power plant. structure is composed of steel-plate reinforced concrete composite (SC)
exterior surfaces and one in the middle) for reinforcement scale physical model of the PSW structure (consisting of SC walls)
deformation behavior (Shodo et al. 2003). This paper presents the development and benchmarking of a nonlinear inelastic finite element (NIFE) modeling and analysis approach for
deformation behavior of the 1/6th scale physical model of PSW structure. analysis results are compared with experimental observations, and used to gain additional insight into the
deformation behavior of the PSW structure. This additional insight is used to develop a simpler design approach for calculating the lateral load capacity of the PSW structure.
and analytical results indicate that the lateral load capacity of the tested PSW structure depends on the of the SC walls that constitute the PSW structure.
The design of nuclear power plant structures provides a unique set of challenges and conditions in comparison to typical commercial building structures. The extensive use of SC structures in the current uclear power plants is due to a combination of factors such as accelerated construction, improved quality control, and desirable structural properties. Research in the last few years has shown that SC structures can also be used more efficiently than reinforced concrete structures in safety
nuclear facilities. Research has also shown that SC structures perform well for a wide range of structural conditions such as seismic loading (Varma, Zhang et al. 2011), thermal
), and blast loading (Mizuno et al. 2005).
1. Experimental test setup and cross-section of SC primary shield (Shodo et al.
This paper investigates the seismic behavior and design of a primary shield wall (PSW) structure part of a typical PWR nuclear power plant design. The PSW structure is typically
massive, and geometrically complex structure. Figure 1 shows an isometric view of a cross 23, 2013
PRIMARY SHIELD
STRUCTURE CONSISTING OF SC WALLS
Mitsubishi Heavy Industries3
W. Lafayette, IN ([email protected]) W. Lafayette, IN
and design of a unique primary pressurized water reactor (PWR) nuclear power plant. d concrete composite (SC) walls with three steel exterior surfaces and one in the middle) for reinforcement. Researchers in (consisting of SC walls) to determine (Shodo et al. 2003). This paper presents the development and benchmarking of a nonlinear inelastic finite element (NIFE) modeling and analysis approach for scale physical model of PSW structure. The analysis results are compared with experimental observations, and used to gain additional insight into the deformation behavior of the PSW structure. This additional insight is used to develop a simpler design approach for calculating the lateral load capacity of the PSW structure. The experimental and analytical results indicate that the lateral load capacity of the tested PSW structure depends on the
The design of nuclear power plant structures provides a unique set of challenges and conditions in comparison to typical commercial building structures. The extensive use of SC structures in the current uclear power plants is due to a combination of factors such as accelerated construction, improved quality control, and desirable structural properties. Research in the last few years has shown orced concrete structures in safety-related nuclear facilities. Research has also shown that SC structures perform well for a wide range of structural ), thermal-mechanical loading
section of SC primary shield (Shodo et al. 2003)
22nd Conference on Structural Mechanics in Reactor Technology San Francisco, California, USA - August 18-23, 2013 Division X
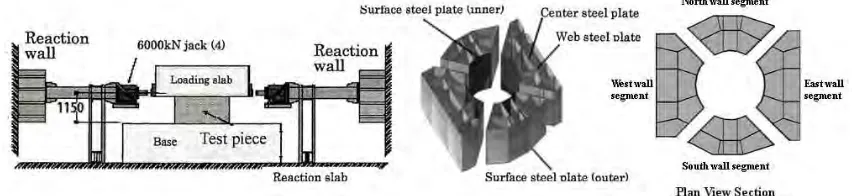
through the PSW structure with concrete removed. As shown, the PSW is a hollow polygonal structure with steel plates on the interior and exterior surfaces, and an additional steel plate at the mid-thickness. These three steel plates of each SC wall are connected to each other by transverse (web) steel plates that are welded to the steel plates. The steel plates are anchored to the concrete infill with sufficient shear studs to generate adequate composite action and prevent local buckling of the steel surface plates. Additionally, there are four openings (shown in the plan view in Figure 1) in the PSW structure that reduce connectivity and interaction, and separate the PSW structure into four SC wall segments further adding to the complexity.
Researchers in Japan have tested a 1/6th scale physical model of this PSW structure consisting of composite SC walls. The results of these experimental investigations were presented by Shodo et al. (2003). Figure 1 includes an elevation view of the test setup. As shown in the test setup, the concrete base is rigidly connected to the reaction slab and the specimen is free-standing. Lateral loading is applied to the concrete block on top of the specimen with hydraulic actuators. The results from the lateral loading test are presented in Shodo et al. (2003), and not repeated here for brevity.
This paper focuses on the development and benchmarking of a NIFE modeling and analysis approach that can be used to predict the lateral load-deformation response of the tested 1/6th scale model PSW structure, and to gain additional insight into its behavior. The results from the experimental and analytical investigations are then used to develop a simpler design approach that is based on conventional approaches combined with the understanding of behavior and principles of structural mechanics.
SUMMARY OF NIFE MODEL OF PSW STRUCTURE
A 3D finite element model of the 1/6th scale test specimen of the PSW structure was developed and analysed using ABAQUS (2012). The model explicitly accounts for all the steel plates (interior and exterior surface plates, and the mid thickness plate), and the web plates. These plates are modeled using 4-node S4R shell elements with reduced integration. The concrete infill is modeled using eight node C3D8R elements with reduced integration. The shear studs providing bond interaction and composite action between the steel plates and the concrete infill were also modeled explicitly using nonlinear spring (connector) elements. The details of the material models used for the steel and concrete materials, and the force-deformation relationship for the connector elements are summarized in the following sub-sections. The finite element model was analyzed using a quasi-static explicit analysis procedure to include the complexities of material and geometric nonlinear, inelastic, and interaction behavior.
Concrete and Steel Material Modeling
The concrete elastic fracture (CEF) model in ABAQUS (2012) is used for the modeling the concrete elements. The CEF model is a suitable option for this analysis since the behavior is dominated by the effects of Mode I and Mode II fracture, shear retention, anisotropic damage evolution, and accurate simulation of simultaneous shear retention and diagonal concrete compression.
The CEF model assumes linear elastic behavior for the concrete in compression. The linear compression model is reasonable if the global structural behavior of concrete is dominated by brittle cracking, tension softening and shear retention. In the case of the 1/6th scale PSW structure, the large amount of steel plate area (reinforcement ratio) resists compression in combination with concrete thus reducing the overall compression demand of the concrete section. Additionally, the cellular-like geometry of the steel section provides substantial confinement of concrete in compression zones thus increasing the compression stiffness and strength.
The tension behavior of the concrete is governed by a Rankine criterion for the detection of initial cracking. After the initiation of cracking, the CEF model fixes the crack orientation for the duration of the analysis. If subsequent cracking occurs at the same integration point, the subsequent crack orientations are orthogonal to the initial crack direction and also fixed for the duration of the analysis.
shown in Figure 2. The uniaxial stress
region, and strain-hardening region. The parameters used to define the idealized stress elastic modulus E, (ii) yield stress
corresponding to onset of strain hardening ultimate stress εu. Equation 1 defines the
response. The idealized stress-strain curve
so that large deformation and large strain behavior can be correctly modeled in the a
Figure 2. Idealized Stress-Strain Curve for Steel
Shear Stud Modeling and Composite Behavior
The shear studs between the steel plates and concrete infill (connector) elements. These con
and concrete infill nodes at the locations of the shear studs i
force-displacement relationships for the connected degrees of freedom. The shear stud force (slip) behavior developed by Ollg
the connector element degrees of freedom corresponding to the concrete infill. Figure 3 shows t
developed using Equations 2 and stiffness are functions of the stud cross
modulus of concrete (Ec), and the ultimate strength of the stud
Boundary Conditions and Meshing
Mesh sizes and distributions for the concrete and steel part instances are shown in
solid concrete elements are 8-node linear reduced integration brick elements with an average size of 3 inches. The steel elements are 4
enhanced hourglass control, and finite membrane strains. The average size of the steel elements is 2 inches by 2 inches. Simpson integration rule is used
specified through the thickness of the elements. nonlinear section stresses and strains and local buckling.
22nd Conference on Structural Mechanics in Reactor Technology San Francisco, California, USA
he uniaxial stress-strain curve consists of a linear elastic portion, post hardening region. The parameters used to define the idealized stress elastic modulus E, (ii) yield stress σy, (iii) yield strain εy (iv) yield plateau length m
corresponding to onset of strain hardening εsh, (vi) ultimate stress σu, and (vii) strain corresponding to
defines the stress-strain behavior in the strain ha strain curve shown is converted into a true stress-so that large deformation and large strain behavior can be correctly modeled in the a
Strain Curve for Steel Plates. Figure 3. Stud Force vs. slip relationship used for the connector elements
Composite Behavior
between the steel plates and concrete infill were modeled using
connector elements were defined by: (i) connecting the coincident steel plate and concrete infill nodes at the locations of the shear studs in the actual structure, and (ii)
displacement relationships for the connected degrees of freedom. The shear stud force (slip) behavior developed by Ollgaard et al. (1972) was specified as the force-displac
the connector element degrees of freedom corresponding to interfacial slip between the steel plates and Figure 3 shows the shear stud force-displacement (Q-∆
and 3 provided by Ollgaard et al. (1972), where the
stud cross-sectional area (Astud), concrete compressive strength
, and the ultimate strength of the stud (Fu, stud):
Q=Qu(1−e−18∆
)2/5
Qu=min(φAstudFu,stud, 0.5Astud fc′Ec)
Boundary Conditions and Meshing
stributions for the concrete and steel part instances are shown in
node linear reduced integration brick elements with an average size of 3 The steel elements are 4-node doubly curved thick shell elements with
and finite membrane strains. The average size of the steel elements is 2 inches by 2 inches. Simpson integration rule is used for the steel shell elements with 5 integration points hrough the thickness of the elements. These shell elements are capable of capturing the nonlinear section stresses and strains and local buckling.
Conference on Structural Mechanics in Reactor Technology , USA - August 18-23, 2013 Division X
strain curve consists of a linear elastic portion, post-yield plateau hardening region. The parameters used to define the idealized stress-strain curve are: (i) (iv) yield plateau length mεy, (v) strain
, and (vii) strain corresponding to strain behavior in the strain hardening region of the -true plastic strain (σ−εp)
so that large deformation and large strain behavior can be correctly modeled in the analysis.
(1)
Plates. Figure 3. Stud Force vs. slip relationship used for the connector elements
modeled using nonlinear spring were defined by: (i) connecting the coincident steel plate n the actual structure, and (ii) specifying the displacement relationships for the connected degrees of freedom. The shear stud force-displacement displacement behavior for interfacial slip between the steel plates and
∆) relationship that was the stud strength (Qu) and
, concrete compressive strength (f’c), elastic
(2) (3)
Figure 4.
Analysis Method and Loading Protocol
The finite element analyses were conducted using
approach in ABAQUS (2012). The explicit dynamic analysis approach was used because of significant material nonlinearities (concrete cracking) and complex interactions between the m
and beyond peak load capacity.
applying lateral loading to the upper concrete block as shown in Figure 1. The monotonic analysis was conducted by applying lateral loadi
cyclic analyses were conducted by applying lateral loading in accordance with the experimental cyclic loading history.
SUMMARY OF ANALYSIS RESULTS
Figure 5 compares the res
displacement responses. It includes the results from the monotonic analysis and its comparisons with the envelope of the cyclic lateral load
favorably with the experimental response. Additionally, Figure 5 shows excellent correlation between the cyclic lateral load-displacement responses predicted analytically and those measured experimentally. Thus, the NIFE modeling and analys
walls is benchmarked by using the results from the 1/6
Figure 5.
Figures 6, 7, and 8 and
PSW structure and further compare the analysis results with experimental measurements and observations. Figure 6 shows the progression
and mid-thickness) of the PSW structure steel plates at lateral loads equal to
maximum value corresponding to the yield stress of the steel plates, and all portions with red color are
22nd Conference on Structural Mechanics in Reactor Technology San Francisco, California, USA
Figure 4. Detailed View of FEM Model and Meshing
Analysis Method and Loading Protocol
analyses were conducted using the explicit dynamic
The explicit dynamic analysis approach was used because of significant material nonlinearities (concrete cracking) and complex interactions between the m
Both monotonic and cyclic lateral loading analyses were conducted by applying lateral loading to the upper concrete block as shown in Figure 1. The monotonic analysis was conducted by applying lateral loading (pushing) up to the target displacement from the experiment. The cyclic analyses were conducted by applying lateral loading in accordance with the experimental cyclic
RESULTS AND BEHAVIOR
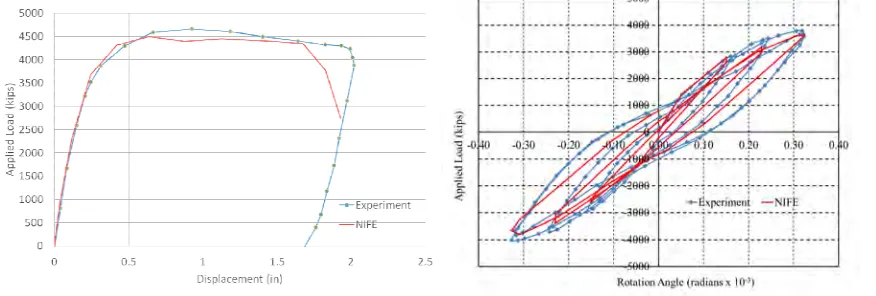
Figure 5 compares the results from the NIFE analyses with the experimental lateral load displacement responses. It includes the results from the monotonic analysis and its comparisons with the envelope of the cyclic lateral load-displacement responses. As shown, the NIFE analysis
with the experimental response. Additionally, Figure 5 shows excellent correlation between the displacement responses predicted analytically and those measured experimentally. Thus, the NIFE modeling and analysis approach for the complex PSW structure consisting of unique SC walls is benchmarked by using the results from the 1/6th scale test conducted by Shodo et al. (2003).
Figure 5. Monotonic and Cyclic Load Displacement Curves
, 7, and 8 and Table 2 provide additional insights into the lateral load behavior of the PSW structure and further compare the analysis results with experimental measurements and
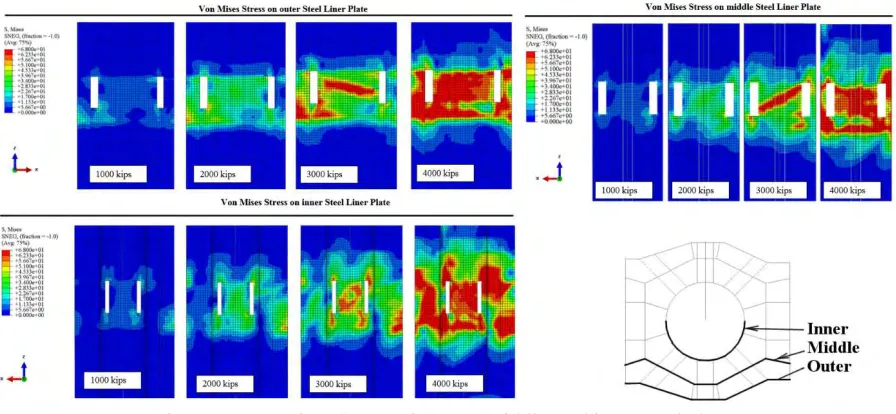
shows the progression of yielding of the steel plates (interior and e thickness) of the PSW structure. The figure shows contour plots of the von Mises stress
at lateral loads equal to 1000, 2000, 3000, and 4000 kips. The contour plots are limited to the g to the yield stress of the steel plates, and all portions with red color are
Conference on Structural Mechanics in Reactor Technology , USA - August 18-23, 2013 Division X
and Meshing
explicit dynamic (quasi-static) analysis The explicit dynamic analysis approach was used because of significant material nonlinearities (concrete cracking) and complex interactions between the model components at Both monotonic and cyclic lateral loading analyses were conducted by applying lateral loading to the upper concrete block as shown in Figure 1. The monotonic analysis was ng (pushing) up to the target displacement from the experiment. The cyclic analyses were conducted by applying lateral loading in accordance with the experimental cyclic
ults from the NIFE analyses with the experimental lateral load-displacement responses. It includes the results from the monotonic analysis and its comparisons with the
displacement responses. As shown, the NIFE analysis results compare with the experimental response. Additionally, Figure 5 shows excellent correlation between the displacement responses predicted analytically and those measured experimentally. is approach for the complex PSW structure consisting of unique SC
scale test conducted by Shodo et al. (2003).
Monotonic and Cyclic Load Displacement Curves
22nd Conference on Structural Mechanics in Reactor Technology San Francisco, California, USA - August 18-23, 2013 Division X
fully yielded. Figure 6 shows that the exterior (outer) steel plate yields at about 3000 kips on the tension side (according to the overturning moment). The middle steel plate also yields at about 3000 kips in the middle segment. At 4000 kips of lateral load all the steel plates (outer, inner, and middle) have undergone significant yielding. These von Mises stress contour plots indicate that all three steel plates participate in the lateral load resisting mechanism, which is an important finding for the complex PSW structure consisting of SC walls with three steel plates.
Figure 6. Von Mises Stresses in outer, middle, and inner steel plates
As mentioned earlier and shown in Figure 1, the PSW structure is separated into four SC wall segments. Each of these SC wall segments has three steel plates (outer surface, inner surface, and mid-thickness) and several web plates. The four SC wall segments are referred as end segments and middle segments for the rest of this discussion. The two end segments are subjected: (i) shear due to the applied lateral loading, and (ii) axial tension or compression due to the overturning moment. The two middle segments are subjected primarily to longitudinal shear due to the applied lateral loading.
Figures 7 and 8 show the progression of concrete cracking and the formation of concrete compression struts in the SC wall segments. Figure 7 shows the magnitude and directions of the minimum principle stresses (compression struts) in the concrete infill of the SC wall segments. The left side of Figure 7 focuses on the middle segments, and the right side focuses on the end segments. As shown, all the SC wall segments develop concrete compression struts and participate in carrying the applied lateral load in shear. This is an important finding for the complex PSW structure consisting of SC wall segments. As the lateral load exceeds 3000 kips, the compression struts in the middle segments exhibit reduction in their stress carrying ability due to excessive diagonal tension cracking (see Figure 8 discussion below), and subsequently the end wall segments resist a larger portion of the applied lateral load.
22nd Conference on Structural Mechanics in Reactor Technology San Francisco, California, USA - August 18-23, 2013 Division X
tension cracking and reduction in their compression strut stress carrying ability as the lateral load exceeds 4000 kips. Thus, all the four SC wall segments contribute significantly to the lateral load carrying capacity of the complex PSW structure, which is an important finding.
Figure 7. Concrete Minimum Principle Stress (Compression Strut) in Middle and End Wall Segments
Figure 8. Concrete Maximum Principle Strain (Cracking Strain) in Middle and End Wall Segments
Table 2: Numerical
Event
(A)Flexural Tension Concrete Cracking in End Segment
(B)Flexural Tension Yielding of End Wall Segment
(C)Shear Yielding of Steel Plate in Segment
Figure 9 Comparison of Experimental and
DESIGN LATERAL LOAD CAPACITY
The results from the benchmarked
end wall and two middle wall segments) participate and contribute to the lateral load capacity of the complex PSW structure. The analysis results further indicate that the SC wall segments: (i) develop diagonal tension cracking and compression struts in the concrete infill, and (ii) von Mises yielding of all three (outer, inner, and middle) steel plates.
loading in shear.
The relative distribution of the
in Figure 10. Figure 10 shows the portion of the base shear resisted by the individual SC wall segments. The plot on the left of Figure 10 shows the results from the NIFE analysis, while the
shows the results from an equivalent linear elastic finite element (LEFE) analysis. The LEFE analysis was conducted using linear elastic material models for the steel and concrete materials and assuming full bond between the steel plates and the concrete. As shown
resisted equal portions (approximately 25%)
which corresponds to an applied lateral load of 4000 kips (see Figure 9). Af displacement, the portion of the
explained earlier, and the portions of the
the LEFE analysis cannot account for this behavior due to its modeling limitations, but it also indicates that each SC wall segment resists
22nd Conference on Structural Mechanics in Reactor Technology San Francisco, California, USA
Numerical Comparison of Experiment and NIFEAnalysis Lateral Load
from Experiment Shodo et al. (2003) Tension Concrete Cracking in End Wall
560 kips
Flexural Tension Yielding of Outer Steel Plate in
2700 kips
of Steel Plate in Middle Wall
3060 kips
Comparison of Experimental and NIFE Analysis
LATERAL LOAD CAPACITY
results from the benchmarked NIFE analyses indicate that all four SC wall segments (two end wall and two middle wall segments) participate and contribute to the lateral load capacity of the
PSW structure. The analysis results further indicate that the SC wall segments: (i) develop tension cracking and compression struts in the concrete infill, and (ii) von Mises yielding of all three (outer, inner, and middle) steel plates. Thus, all the SC wall segments resist the applied lateral
The relative distribution of the lateral load resisted by the individual SC wall segments is shown in Figure 10. Figure 10 shows the portion of the base shear resisted by the individual SC wall segments.
on the left of Figure 10 shows the results from the NIFE analysis, while the
shows the results from an equivalent linear elastic finite element (LEFE) analysis. The LEFE analysis was conducted using linear elastic material models for the steel and concrete materials and assuming full bond
and the concrete. As shown by the NIFE analysis results
(approximately 25%) of the total base shear up to 0.4 in. lateral displacement, which corresponds to an applied lateral load of 4000 kips (see Figure 9). Af
portion of the base shear resisted by the middle segment reduces due to reasons portions of the base shear resisted by the end segments increases. The results of unt for this behavior due to its modeling limitations, but it also indicates that each SC wall segment resists 20-30% of the total base shear. This is an important finding because it
Conference on Structural Mechanics in Reactor Technology , USA - August 18-23, 2013 Division X
Analysis Results
Lateral Load from NIFE analysis
750 kips
2500 kips
3000 kips
Behavior
indicate that all four SC wall segments (two end wall and two middle wall segments) participate and contribute to the lateral load capacity of the PSW structure. The analysis results further indicate that the SC wall segments: (i) develop tension cracking and compression struts in the concrete infill, and (ii) von Mises yielding of all Thus, all the SC wall segments resist the applied lateral
indicates that LEFE analysis results can also be used to estimate the por the individual SC wall segments.
Figure 10. Comparison of Normalized Shear Resistance of Wall Segments
The lateral load capacity of the PSW structure can be calculated the individual SC wall segments.
described above, namely, all SC wall segments contribute almost equally to the lateral load capacity of the PSW structure.
The NIFE analysis results of reinforced concrete squat shear walls
compression struts in the concrete, and von Mises yielding of shear reinforcement (steel wall segments. This behavioral insight
the four individual wall segments shear strength of RC walls.
The relevant ACI 349-Equations Acv, f’c, ρt, and fy
reinforcement ratio, and steel yield strength, respectively. As shown, t
sum of the shear strength contributions of the concrete and the shear reinforcement. contribution to the shear strength depends on the wall aspect ratio (wall height divided by length,
The ACI 349-06 code equations were used for each of th
(Acv) and the aspect ratios were based on the geometric details of each wall segment. As shown in Figure
12, the steel shear reinforcement area was calculated as the summation of the areas of individual steel plates that are almost (approximately) parallel to the di
The total lateral load capacity of the PSW structure
strengths of the individual SC wall segments to be equal to 4500 kips. the each end segment and middle segment
load capacity. Figure 12 includes the comparison of the calculated lateral load capacity with the NIFE analysis results and the experimental results. As shown, the calculated lateral load capacity compares favorably and conservatively with these results.
ACI 349-06 also limits (provides an upper bound for) the in are part of a lateral load resisting system to
conservative, and it does not apply to the PSW structure composed of SC walls.
22nd Conference on Structural Mechanics in Reactor Technology San Francisco, California, USA
indicates that LEFE analysis results can also be used to estimate the portions of the base shear resisted by the individual SC wall segments.
Figure 10. Comparison of Normalized Shear Resistance of Wall Segments
he lateral load capacity of the PSW structure can be calculated by adding
SC wall segments. This is a reasonable design assumption based on the behavioral insight , namely, all SC wall segments contribute almost equally to the lateral load capacity of
he NIFE analysis results show that the behavior of the SC wall segments
of reinforced concrete squat shear walls. This is based on the formation of diagonal tension cracks and compression struts in the concrete, and von Mises yielding of shear reinforcement (steel
behavioral insight leads to an additional design assumption that t
the four individual wall segments can be calculated using the ACI 349-06 code provisions for
-06 code provisions are summarized in Equations (2)
are the area of the concrete, compressive strength, transverse steel reinforcement ratio, and steel yield strength, respectively. As shown, the in-plane shear strength is the
f the shear strength contributions of the concrete and the shear reinforcement. contribution to the shear strength depends on the wall aspect ratio (wall height divided by length,
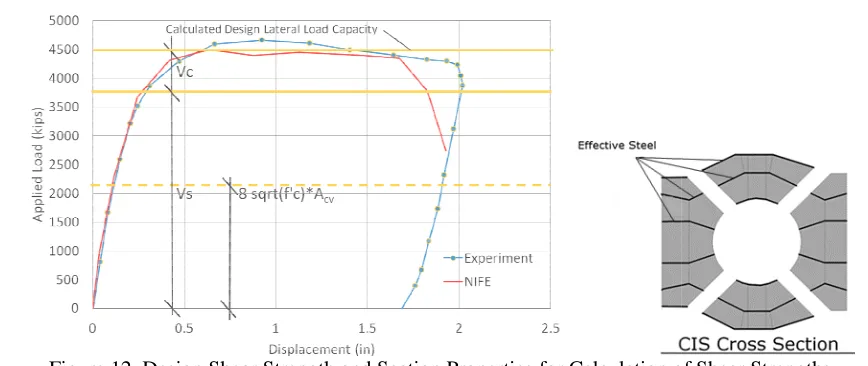
06 code equations were used for each of the SC wall segments. The concrete area ) and the aspect ratios were based on the geometric details of each wall segment. As shown in Figure 12, the steel shear reinforcement area was calculated as the summation of the areas of individual steel
at are almost (approximately) parallel to the direction of the applied loading.
The total lateral load capacity of the PSW structure (Vn) was calculated as the sum of the shear
strengths of the individual SC wall segments to be equal to 4500 kips. The shear strength contributions of and middle segment were equal to 30% and 20%, respectively, of the total lateral Figure 12 includes the comparison of the calculated lateral load capacity with the NIFE ts and the experimental results. As shown, the calculated lateral load capacity compares
with these results.
06 also limits (provides an upper bound for) the in-plane shear strength of RC walls that al load resisting system to 8(f’c)
0.5
Acv. As shown in Figure 12, this limit is extremely
conservative, and it does not apply to the PSW structure composed of SC walls.
Conference on Structural Mechanics in Reactor Technology , USA - August 18-23, 2013 Division X
tions of the base shear resisted by
Figure 10. Comparison of Normalized Shear Resistance of Wall Segments
by adding the shear strengths of This is a reasonable design assumption based on the behavioral insight , namely, all SC wall segments contribute almost equally to the lateral load capacity of
he behavior of the SC wall segments is comparable to that formation of diagonal tension cracks and compression struts in the concrete, and von Mises yielding of shear reinforcement (steel plates) in the SC leads to an additional design assumption that the shear strength of provisions for the in-plane
(2)
(3)
(4) summarized in Equations (2) – (4). In these are the area of the concrete, compressive strength, transverse steel plane shear strength is the f the shear strength contributions of the concrete and the shear reinforcement. The concrete contribution to the shear strength depends on the wall aspect ratio (wall height divided by length, hw/lw).
e SC wall segments. The concrete area ) and the aspect ratios were based on the geometric details of each wall segment. As shown in Figure 12, the steel shear reinforcement area was calculated as the summation of the areas of individual steel
rection of the applied loading.
was calculated as the sum of the shear The shear strength contributions of 30% and 20%, respectively, of the total lateral Figure 12 includes the comparison of the calculated lateral load capacity with the NIFE ts and the experimental results. As shown, the calculated lateral load capacity compares
Figure 12. Design Shear Strength and Section Properties for Calculation of Shear
The overturning moment capacity (Vn) can be calculated as V
moment is resisted by: (i) each of
an axial force couple as shown in Figure 13. The results from the NIFE analysis and the LEFE analyses were further post-processed to identify the portions of the overturning moment resisted by the
segments, and the portion resisted by the axial force couple in the end wall segments.
Figure 13. Overturning Moments Resisted by the PSW Structure and Wall Segments
Figure 14. Portions of the Overturning Moment Resisted by the PSW Wall Segments
Figure 14 presents the results from this post
shown, the axial force couple in the end wall segments resists about 60% of the overturning mo Additionally, the two middle wall segments resist
L"
M1"""""""M2"""""""""M3" T"""""""""""""""""""""""""""C" Vn"
West"wall" segment"
Middle"wall" segment"
Total Overturning Moment (OTM)
Portion of OTM resisted by axial force couple i
Moment at base of middle wall segments
Moment at base of East and West wall end segm
22nd Conference on Structural Mechanics in Reactor Technology San Francisco, California, USA
Design Shear Strength and Section Properties for Calculation of Shear
The overturning moment (MOTM) at base of the PSW structure corresponding to the lateral load
can be calculated as Vn multiplied by the height of the specimen. This total overturning
: (i) each of the four SC wall segments, and (ii) the two end segments by developing an axial force couple as shown in Figure 13. The results from the NIFE analysis and the LEFE analyses
processed to identify the portions of the overturning moment resisted by the segments, and the portion resisted by the axial force couple in the end wall segments.
Figure 13. Overturning Moments Resisted by the PSW Structure and Wall Segments
Portions of the Overturning Moment Resisted by the PSW Wall Segments
the results from this post-processing of the NIFE and LEFE analyses. As shown, the axial force couple in the end wall segments resists about 60% of the overturning mo Additionally, the two middle wall segments resist approximately 25% of the overturning moment, and the
H" East"wall" segment"
MOTM=VnH=M1+M2+M3+(T+C)e where,
MOTM = Total overturning mom
M1, M3 = moment resisted by e M2 = moment resisted by middl T, C = axial force couple in end s resisting MOTM
in end wall segments
gments
NIFE analysis
Total Overturning Moment (OTM)
Portion of OTM resisted by axial forc
Moment at base of middle wall segm
Moment at base of East and West wa
Conference on Structural Mechanics in Reactor Technology , USA - August 18-23, 2013 Division X
Design Shear Strength and Section Properties for Calculation of Shear Strengths
corresponding to the lateral load multiplied by the height of the specimen. This total overturning he two end segments by developing an axial force couple as shown in Figure 13. The results from the NIFE analysis and the LEFE analyses processed to identify the portions of the overturning moment resisted by the four wall segments, and the portion resisted by the axial force couple in the end wall segments.
Figure 13. Overturning Moments Resisted by the PSW Structure and Wall Segments
Portions of the Overturning Moment Resisted by the PSW Wall Segments
processing of the NIFE and LEFE analyses. As shown, the axial force couple in the end wall segments resists about 60% of the overturning moment. 25% of the overturning moment, and the
+C)e/2
oment
d by end segments ddle segment nd segments for
force couple in end wall segments
gments
all end segments
22nd Conference on Structural Mechanics in Reactor Technology San Francisco, California, USA - August 18-23, 2013 Division X
two end segments resist approximately 15% of the overturning moment. These results are reasonably consistent between the NIFE and LEFE analysis results. This is an important finding because it indicates that LEFE analysis results can also be used to estimate the portions of the overturning moments resisted by the individual SC wall segments and the axial force couple in the end segments.
The axial force (Pr) and bending moment (Mr) demands at the base of each wall segment
associated with the total overturning moment (MOTM = Vn H) can be calculated using the distributions and
proportions described above. Additionally, axial force-bending moment capacity interaction curves can be developed for each SC wall segment by conducting section fiber analysis while using rigid-plastic material models for the steel and concrete. This approach for calculating axial force-bending moment capacity interaction curves has been used extensively for composite sections including concrete filled tubes and reinforced concrete sections (Mahin and Bertero 1977).
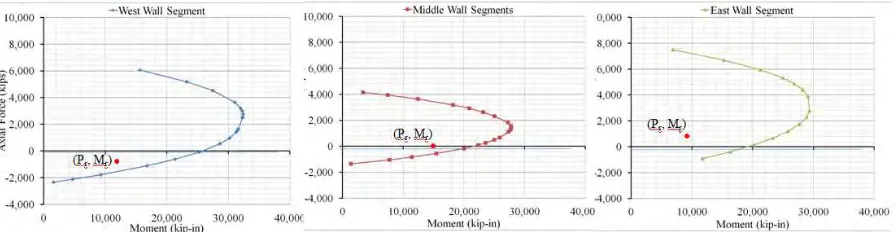
The resulting capacity interaction curves for each of the wall segments are shown in Figure 15. Additionally, the figure includes the data points corresponding to the axial force and moment demands (Pr
and Mr) calculated at the base of each wall segment. As shown, all the data points lie within the
corresponding interaction curves, which means that none of the SC wall segments will fail individually in flexure due to the overturning moment (MOTM) associated with lateral load capacity (Vn) of the PSW
structure. All the SC wall segments will fail in shear, and the lateral load capacity (Vn) of the PSW
structure can be calculated as the sum of the shear strengths of the individual SC wall segments.
Figure 15. Axial Load-Bending Moment Capacity Interaction Curve for SC Wall Segments
CONCLUSIONS
The nonlinear inelastic finite element (NIFE) modeling and analysis approach presented in this paper was benchmarked for predicting the lateral load-deformation behavior of a complex primary shield wall (PSW) structure consisting of SC wall segments with three steel plates (interior and exterior surface, and mid-thickness steel plates).
The NIFE model predicted with reasonable accuracy the cyclic and monotonic lateral load-deformation behavior of the 1/6th scale test of the PSW structure. It also predicted with reasonable accuracy the key events that occurred along the load-deformation path, namely, the flexural tension cracking of the concrete, flexural tension yielding of the steel plates, and the shear yielding of the steel plates.
The NIFE model analysis also provided significant insights into the fundamental behavior of the SC wall segments of the PSW structure including the occurrence of diagonal tension cracking, the formation of concrete compression struts, and the von Mises yielding of all the three (interior, exterior, and mid-thickness) steel plates of each SC wall segment. The NIFE model analysis results indicate that the shear strength of the SC wall segments governs the behavior and strength of the PSW structure.
The insights from the NIFE analysis results were used to develop a simple approach for calculating the lateral load capacity (Vn) of the PSW structure by adding the shear strength of the
22nd Conference on Structural Mechanics in Reactor Technology San Francisco, California, USA - August 18-23, 2013 Division X
of the individual SC wall segments. This design approach was shown to estimate the lateral load capacity of the PSW structure with reasonable accuracy.
REFERENCES
ABAQUS (2011). ABAQUS/Standard Version 6.10 User’s Manuals: Volume I-III, Hibbitt, Karlsson, and Sorenson Inc., Pawtucket, RI.
ACI 349 (2006), “Code Requirements for Nuclear Safety-Related Concrete Structures and Commentary,” American Concrete Institute, Farmington Hills, MI.
JEAG 4618 (2005). “Technical Guidelines for Seismic Design of Steel Plate Reinforced Concrete Structures: Buildings and Structures,” Japanese Electric Association Nuclear Standards Committee, Tokyo, Japan
Mahin, S. A. and Bertero. V. V. (1977). RCCOLA: A Computer Program for R. C. Column Analysis: User’s Manual and Documentation, Department of Civil Engineering, University of California, Berkeley, CA.
Mizuno, J., Koshika, N., Sawamoto, Y., Niwa, N., Yamashita, T., Suzuki, A., (2005). “Investigations on Impact Resistance of Steel Plate Reinforced Concrete Barriers against Aircraft Impact Part 1: Test Program and Results”, Transactions of the 18th International Conference on Structural Mechanics in Reactor Technology (SMiRT-18), Vol. J J05/1.
Ollgaard, J.G., R. G. Slutter, and J.W. Fisher. Shear Strength of Stud Connectors in Lightweight and Normal-weight Concrete, Engineering Journal - American Institute of Steel Construction, 1972. Shodo, A., K. Asao, O. Tetsuya, S. Kunihiko, and T. Kazuaki (2003) “A Study on the Structural
Performance of SC Thick Walls”, Annual Conference of Architectural Institute of Japan.
Varma, A.H., Zhang, K., Chi, H., Booth, P.N., and Baker, T. (2011) “In-Plane Shear Behavior of SC Composite Walls: Theory vs. Experiment.” Transactions of the 21st SMiRT Conference, New Delhi, India, Paper ID 764, IASMiRT, North Carolina State University, Raleigh, NC.