Copyright2000 by the Genetics Society of America
Comparative Sequence Analysis and Patterns of Covariation
in RNA Secondary Structures
John Parsch,
1John M. Braverman
2and Wolfgang Stephan
Department of Biology, University of Rochester, Rochester, New York 14627-0211 Manuscript received June 23, 1999
Accepted for publication October 4, 1999
ABSTRACT
A novel method of RNA secondary structure prediction based on a comparison of nucleotide sequences is described. This method correctly predicts nearly all evolutionarily conserved secondary structures of five different RNAs: tRNA, 5S rRNA, bacterial ribonuclease P (RNase P) RNA, eukaryotic small subunit rRNA, and the 39untranslated region (UTR) of the Drosophila bicoid (bcd) mRNA. Furthermore, covaria-tions occurring in the helices of these conserved RNA structures are analyzed. Two physical parameters are found to be important determinants of the evolution of compensatory mutations: the length of a helix and the distance between base-pairing nucleotides. For the helices of bcd 39 UTR mRNA and RNase P RNA, a positive correlation between the rate of compensatory evolution and helix length is found. The analysis of Drosophila bcd 39UTR mRNA further revealed that the rate of compensatory evolution decreases with the physical distance between base-pairing residues. This result is in qualitative agreement with Kimura’s model of compensatory fitness interactions, which assumes that mutations occurring in RNA helices are individually deleterious but become neutral in appropriate combinations.
M
OLECULES of RNA have a variety of important among diverse taxa (WoeseandFox 1977;Gouyand functions in biological systems, many of which Li 1989; Kumar and Rzhetsky 1996). The relatively depend on the RNA folding into a precise structure. For simple pattern of intramolecular Watson-Crick (WC) example, protein synthesis requires the participation of base-pairing involved in RNA structures has made them tRNAs and rRNAs that have highly conserved structures a suitable model for the study of compensatory evolu-(WoeseandPace1993;Dirheimeret al. 1995). mRNAs tion and epistatic selection at the molecular level ( Ste-are known to contain important structural elements that phanandKirby1993;Scho¨ niger andvon Haeseler affect localization, stability, and translational regulation 1994; Kirby et al. 1995; Rzhetsky 1995;Tillier and (Macdonald andStruhl 1988;Mullner and Kuhn Collins1995;Stephan1996). RNA molecules are also 1988;Macdonald1990;Pandeyet al. 1994). In addi- thought to have been among the first catalytic repli-tion, catalytic RNAs have been identified in both pro- cators in prebiotic evolution under the “RNA world” karyotic and eukaryotic systems (Kru¨ ger et al. 1982; hypothesis (Gilbert1986;JoyceandOrgel1993). Guerrier-Takadaet al. 1983; Paceand Smith1990) Presently, the most reliable method for predicting and have also been engineered in vitro (Odaiet al. 1990; secondary structures of large RNAs from primary DNA EklandandBartel1996;Unrau andBartel1998). sequence data is through phylogenetic-comparative The activity of these RNAs is, not surprisingly, highly analysis of aligned nucleotide sequences (Fox and dependent on proper folding (Pleyet al. 1994;Scott Woese 1975; James et al. 1988;Paceet al. 1989). Theet al. 1995;EklandandBartel1996). A detailed knowl- major assumption underlying this approach is that mu-edge of RNA structure is therefore essential for a com- tations that disrupt the WC base-pairing of a functionally plete understanding of many aspects of molecular and important RNA stem have a deleterious effect, but that cell biology. RNA structures are also of great interest in deleterious effect may be overcome by a second, com-molecular evolution. The structures of tRNAs and pensatory mutation in the other half of the stem that rRNAs are highly conserved among all kingdoms of restores the potential for base-pairing. Compensatory life and these sequences, particularly rRNAs, have been evolution, as mediated by RNA secondary structure, re-widely used to determine phylogenetic relationships sults in a detectable pattern of nucleotide substitutions (“covariations”) in the phylogenetic alignment of ho-mologous RNA sequences from different species. Co-varying sites are defined as those that differ between
Corresponding author: Wolfgang Stephan, Department of Biology,
University of Rochester, Rochester, NY 14627-0211. two or more species but retain the potential for WC E-mail: [email protected]
base-pairing in each species (for example, a GC pair in 1Present address: Department of Organismic and Evolutionary
Biol-species 1 is replaced by an AU pair in Biol-species 2). The
ogy, Harvard University, Cambridge, MA 02138-2020.
2Present address: Le Moyne College, Syracuse, NY 13214-1499. phylogenetic-comparative method has been an effective
albopictus (DA4800), Drosophila melanogaster (DA4840), Strongy-approach to identifying conserved RNA secondary
struc-locentrotus purpuratus (DA5080), Xenopus laevis (DA5120), Rana tures and has been used to generate consensus
struc-catesbeiana (DA5160), Gallus gallus (DA5220), Mus musculus tures for tRNAs, rRNAs, and ribozymes (Paceet al. 1989; (DA5320), Homo sapiens (DA5880), and Bos taurus (DA5360).
WoeseandPace1993;Dirheimeret al. 1995). A draw- Aligned 5S rRNA sequences were downloaded from the
Berlin RNA Databank (Specht et al. 1991; ftp://ftp.embl-back to this method, however, is that the rules for
identi-heidelberg.de:/pub/databases/berlin/). Sequences used for fying potential pairing stems are somewhat ad hoc. For
analysis were H. sapiens, G. gallus, D. melanogaster, Bombyx mori, example, an RNA stem is considered “proven” if two or
X. laevis, Caenorhabditis elegans, Notophthalmus viridescens, Terra-more covariations are present in the aligned sequences pene carolina, and Brachionus plicatilis.
(FoxandWoese1975;Jameset al. 1988). The phyloge- Aligned RNase P RNA sequences were downloaded from
the RNase P Database (Brown1998; http://jwbrown.mbio. netic relationship of the aligned sequences and the level
ncsu.edu/RNaseP/home.html). The following sequences of sequence divergence are not considered. In addition,
were used for analysis: Escherichia coli, Salmonella typhimurium, the phylogenetic-comparative method does not account
Klebsiella pneumoniae, Erwinia agglomerulans, Serratia marcescens, for mismatches or noncanonical base pairs such as GU Pseudomonas fluorescens, Bacillus brevis, Bacillus
stearothermophi-wobble pairs. lus, and Bacillus megaterium.
Drosophila bcd sequences were obtained from GenBank Muse(1995) proposed an alternate method to detect
(release 108.0). The sequences used (followed by their acces-RNA secondary structures from aligned sequence data
sion numbers) were D. melanogaster (X07870), D. simulans that relies on a likelihood-ratio test (LRT) to identify
(M32123), D. sechellia (M32124), D. teissieri (M32121), D. pseu-potential pairing regions showing constraints for WC doobscura (X55735), D. subobscura (X78058), D. virilis interactions. The advantage of this approach is that it (M32122), D. picticornis (M32126), and D. heteroneura (M32125). bcd 39UTR sequences (from stop codon to end of does not rely on the ad hoc rules used in the
phyloge-transcript) were aligned using the ClustalX program ( Thomp-netic-comparative method. The pattern of nucleotide
sonet al. 1997) and then adjusted manually. Manual alignment substitution at paired sites is compared to that of
un-was assisted by previously published alignments of subsets of paired sites and a pairing parameter, l, is estimated. the above sequences (Macdonald1990;Seegerand Kauf-The relative evolutionary conservation of each pre- man1990).
dicted pairing is quantified by calculating an LRT statis- Aligned SSU rRNA sequences were downloaded from the SSU rRNA Database (van de Peer et al. 1998; http://rrna. tic. A drawback to the LRT approach has been the
uia.ac.be/ssu/index.html). The following sequences were requirement to specify the coordinates of potential
pair-used for analysis: Acyrthosiphon pisum, H. sapiens, C. elegans, ing stems before application of the test. Thus, so far, Strongyloides stercoralis, and Saccharomyces cerevisiae.
this method has primarily been used to test structures Identification of potential RNA helices:Potential RNA heli-previously predicted by phylogenetic-comparative analy- ces that are conserved in the aligned sequences were identified using the novel program PIRANAH. This program represents sis (Kirbyet al. 1995;Muse1995;Parschet al. 1997).
an extension of the algorithm of HanandKim (1993). An Muse(1995), however, presents an example of how the
upper triangular n3n matrix, where n represents the length likelihood method may, in principle, be used to predict (in bases) of the aligned sequences, is generated in which secondary structures without a priori knowledge of the the nucleotide state at each site of two aligned sequences is location of paired regions. compared to that of every other site. Comparisons are per-formed in a pairwise fashion; thus an alignment of N sequences Here we present a novel method of RNA secondary
results in (N2 1)N/2 comparisons. There are five possible structure prediction that integratesMuse’s (1995) LRT
states for each cell of the matrix: (i) a conserved WC base approach. The method is applied to five different RNA pair, (ii) a WC covariation, (iii) a GU wobble pair in either molecules that are known to have conserved, function- one or both sequences, (iv) a gap in one of the sequences, ally important secondary structures: tRNA, 5S rRNA, or (v) a mismatch in either one or both sequences. Potential helices are those that consist of a consecutive run of WC or bacterial ribonuclease P (RNase P) RNA, the 39
untrans-wobble base pairs in both sequences (a diagonal line with lated region (UTR) of the Drosophila bicoid (bcd)
slope51 in the n3n matrix). Wobble pairs are permitted mRNA, and eukaryotic small subunit (SSU) rRNA. Fur- only internally; terminal GU pairs are treated as mismatches. thermore, we analyze the covariations occurring in the The user specifies the number of comparisons in which a helices of these RNA structures. The goal of this analysis potential helix must be conserved. This allows mismatches to be included within helices, but only as long as the number of is to identify physical parameters that determine the
sequences containing mismatches falls below the specified evolution of compensatory mutations. Two parameters
threshold. By this rule, the length of a putative helix is defined. are found to be important: the length of a helix and For our examples, we required that helices be conserved in the physical distance between base-pairing nucleotides. 15 out of 36 comparisons (i.e., six out of the nine sequences) for tRNA, 5S rRNA, RNase P RNA, and bcd mRNA 39 UTR, or 6 out of 10 comparisons (four out of the five sequences) for SSU rRNA. The user also specifies the minimum number MATERIALS AND METHODS
of base pairs required per helix. Minimum helix length was set at 3 bp for tRNA, 5S rRNA, RNase P RNA, and bcd mRNA
Sequence collection and alignment:Aligned, mitochondrial
tRNA sequences (UGC anticodon) were downloaded from 39UTR. In the case of SSU rRNA (a much longer sequence) only helices with a minimum length of 5 bp were considered the tRNA Database (Sprinzl et al. 1998;
http://www.uni-bayreuth.de/departments/biochemie/trna/index.html). Se- in order to keep computation time reasonable in subsequent steps.
After all helices meeting the specified criteria have been tions. In addition, GROUPER was applied to each set of pre-dicted helices from the randomizations to predict total struc-identified, LRT values (Muse1995) are calculated for each
helix. Since these calculations can be quite time consuming tures. The P value of an observed structure was estimated as the frequency of obtaining a total structure with LRT$the (depending on the number of helices, the number of
se-quences in the alignment, and the length of sequence), the observed value from the 100 randomizations. user may choose to perform the calculations only for helices
meeting a minimum “pairing score,” which is a simple estimate
of the level of conservation. The pairing score is defined as RESULTS (L1W )/C, where L represents the sum of the helix lengths
(in bases) of every comparison, W represents the sum of the RNA secondary structure prediction: tRNA: The well-number of WC covariations of every comparison, and C
repre-known cloverleaf structure of tRNA molecules has been sents the number of comparisons. Typically, the minimum
established through both structural and comparative score must be increased as sequence length increases in order
analyses (Kimet al. 1974;Sprinzlet al. 1998). To test
to keep computation time reasonable. For our examples, the
minimum score for LRT calculation was set at 1.0 (tRNA and our method of secondary structure prediction, we used 5s rRNA), 1.5 (RNase P RNA), 2.0 (bcd 39UTR), and 3.5 (SSU the programs PIRANAH and GROUPER (see materi-rRNA).
als and methods) to identify conserved RNA helices
Construction of RNA secondary structure model:After
gen-and assemble a secondary structure model for an align-erating a complete list of potential RNA helices and their
respective LRT values with PIRANAH, the helices were assem- ment of nine eukaryotic tRNA sequences. The final bled into a final RNA secondary structure model using another structure included four helices with LRT.15 (Table novel program, GROUPER. This program sorts through the 1; Figure 1A). A representative helix is shown in Figure list of helices and determines subsets that are compatible with
2A. The four helices are in complete agreement with each other. Two helices are considered compatible if either:
the tRNA consensus structure (Sprinzlet al. 1998). Our
(i) there is no overlap between their 59 and 39 coordinates,
or (ii) the 59and 39coordinates of one helix fall between the randomization simulations provide strong support for 59and 39coordinates of a second helix. Thus, several short- the four individual helices, as well as for the total struc-range pairings may be nested within one (or more) long-struc-range ture (Table 2).
pairing. Pseudoknots are not permitted. For each compatible
5S rRNA: 5S rRNA is a small RNA (typically 121 bases)
set of helices a total LRT value is calculated. This represents
that associates with 23S rRNA and ribosomal proteins the sum of the individual LRTs for each helix in the structure.
While the value of total LRT is not necessarily equal to the to form the large ribosomal subunit (Osswaldand Bri-LRT calculated for the entire structure in toto, previous results macombe 1999). 5S rRNA structure has been estab-suggest that this method produces a reliable estimate (Muse lished through extensive comparative analysis (Specht 1995;Parschet al. 1997). The optimum secondary structure
et al. 1991). Application of our programs to an
align-model is defined as the one with the greatest total LRT. As
ment of nine eukaryotic 5S rRNA sequences resulted the number of potential structures increases rapidly with the
number of helices, it soon becomes prohibitive to calculate in a final secondary structure of four helices with LRT total LRT for every possible structure. To overcome this prob- . 15 (Table 1; Figure 1B). A representative helix is lem, GROUPER performs iterations (up to 50,000) of random shown in Figure 2B. All four of these helices are in structure assembly. Structure prediction may be simplified by
agreement with the consensus structure (Spechtet al.
specifying a minimum LRT so that only helices with LRTs
1991). The randomization simulations strongly support exceeding the cutoff are included in the final structure. This
is useful in cases where there are a large number of conflicting the individual helices and the predicted structure as a
helices. whole (Table 2).
Significance tests of LRT values:The distribution of the RNase P RNA: RNase P is an RNA-protein complex
LRT statistic iszx2with one degree of freedom, and it has
that produces mature tRNAs by cleaving the 59ends of been demonstrated that this approximation is good for helices
precursor tRNA molecules. The RNA has been shown to $10 bp in length (Muse1995). Most of our predicted helices,
however, are,10 bp, making thex2approximation question- be the catalytic subunit (Guerrier-Takadaet al. 1983;
able. In addition, there is a problem of multiple tests, as the PaceandSmith1990). Due to its catalytic properties, helices that were subject to LRT calculations were previously the structure of RNase P RNA has received much atten-selected to meet certain length and conservation criteria. Thus
tion and a model of its structure has been developed it is difficult to attach meaningful P values to individual
through both phylogenetic and mutational analyses helices. To get around these problems and estimate P values
for the helices predicted in our analysis, we used a numerical (Haas et al. 1991). We have used the programs
PIRA-resampling approach. A similar approach was used byKirby NAH and GROUPER to identify conserved RNA helices et al. (1995). Since this procedure is very computer intensive, it and assemble a secondary structure model for an align-was only practical to apply it to the two shortest RNA sequences
ment of nine bacterial RNase P sequences. Predicted (tRNA and 5S rRNA). Each observed sequence alignment
helices that are present in all nine species and have was randomly shuffled 100 times. Only the linear order of
nucleotides was permuted; base composition and level of se- LRT . 15 are presented in Table 1. An example is quence conservation remained unchanged. PIRANAH was shown in Figure 2C. The helix 23-29/61-67, originally then applied to each randomization using the same parame- predicted as 26-29/61-64 (LRT520.15) due to an inter-ters that were used for the original alignment and a
distribu-nal mismatch in six of the nine sequences, was extended tion of LRT values was obtained. The P value of an observed
by 3 bp after visual inspection and LRT was calculated helix was estimated as the frequency of obtaining an individual
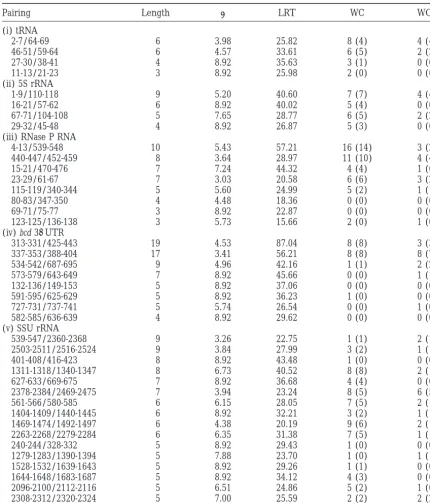
TABLE 1
Results of phylogenetic-comparative and LRT analyses
Pairing Length l LRT WC WOB
(i) tRNA
2-7/64-69 6 3.98 25.82 8 (4) 4 (4)
46-51/59-64 6 4.57 33.61 6 (5) 2 (2)
27-30/38-41 4 8.92 35.63 3 (1) 0 (0)
11-13/21-23 3 8.92 25.98 2 (0) 0 (0)
(ii) 5S rRNA
1-9/110-118 9 5.20 40.60 7 (7) 4 (4)
16-21/57-62 6 8.92 40.02 5 (4) 0 (0)
67-71/104-108 5 7.65 28.77 6 (5) 2 (2)
29-32/45-48 4 8.92 26.87 5 (3) 0 (0)
(iii) RNase P RNA
4-13/539-548 10 5.43 57.21 16 (14) 3 (2)
440-447/452-459 8 3.64 28.97 11 (10) 4 (4)
15-21/470-476 7 7.24 44.32 4 (4) 1 (0)
23-29/61-67 7 3.03 20.58 6 (6) 3 (2)
115-119/340-344 5 5.60 24.99 5 (2) 1 (1)
80-83/347-350 4 4.48 18.36 0 (0) 0 (0)
69-71/75-77 3 8.92 22.87 0 (0) 0 (0)
123-125/136-138 3 5.73 15.66 2 (0) 1 (0)
(iv) bcd 39UTR
313-331/425-443 19 4.53 87.04 8 (8) 3 (3)
337-353/388-404 17 3.41 56.21 8 (8) 8 (7)
534-542/687-695 9 4.96 42.16 1 (1) 2 (2)
573-579/643-649 7 8.92 45.66 0 (0) 1 (1)
132-136/149-153 5 8.92 37.06 0 (0) 0 (0)
591-595/625-629 5 8.92 36.23 1 (0) 0 (0)
727-731/737-741 5 5.74 26.54 0 (0) 1 (0)
582-585/636-639 4 8.92 29.62 0 (0) 0 (0)
(v) SSU rRNA
539-547/2360-2368 9 3.26 22.75 1 (1) 2 (1)
2503-2511/2516-2524 9 3.84 27.99 3 (2) 1 (1)
401-408/416-423 8 8.92 43.48 1 (0) 0 (0)
1311-1318/1340-1347 8 6.73 40.52 8 (8) 2 (1)
627-633/669-675 7 8.92 36.68 4 (4) 0 (0)
2378-2384/2469-2475 7 3.94 23.24 8 (5) 6 (5)
561-566/580-585 6 6.15 28.05 7 (5) 2 (1)
1404-1409/1440-1445 6 8.92 32.21 3 (2) 1 (1)
1469-1474/1492-1497 6 4.38 20.19 9 (6) 2 (1)
2263-2268/2279-2284 6 6.35 31.38 7 (5) 1 (1)
240-244/328-332 5 8.92 29.43 1 (0) 0 (0)
1279-1283/1390-1394 5 7.88 23.70 1 (0) 1 (1)
1528-1532/1639-1643 5 8.92 29.26 1 (1) 0 (0)
1644-1648/1683-1687 5 8.92 34.12 4 (3) 0 (0)
2096-2100/2112-2116 5 6.51 24.86 5 (2) 1 (0)
2308-2312/2320-2324 5 7.00 25.59 2 (2) 2 (2)
The first column gives the coordinates of the pairings, according to the gapped sequence alignment (see materials and methods). The second column gives the stem length (in base pairs). Columns 3 and 4 give values ofland the LRT statistic (Muse1995) for each pairing. The numbers in columns 5 and 6 represent the number of Watson-Crick (WC) and wobble (WOB) covariations observed for each pairing region, with the number of internal covariations given in parentheses.
consistent with the model ofHaas et al. (1991; Figure ure 1C). Overall, the consensus model of Haas et al.
(1991) contains seven helices of length$3 (excluding 1C). The final pairing, 69-71/75-77, is not present in
the model ofHaaset al. (1991); this region forms part pseudoknots and helices not present in Bacillus spe-cies), all of which were predicted by our method, with of a long-range pseudoknot in their model. Pseudoknot
pairings are identified by PIRANAH but are not in- only one potential false positive.
bcd 39UTR: bcd is a maternal effect gene that plays a
(Fig-Figure1.—Results of RNA secondary structure pre-diction for (A) tRNA, (B) 5S rRNA, (C) RNaseP RNA, (D) bcd mRNA 39UTR, and (E) SSU rRNA. The graphs show the n3n matrix for each RNA, where n is the length of the alignment in bases. Helices identified by PIRANAH and meeting the minimum LRT require-ment are plotted as diagonal lines, with the helices included in the final structure prediction by GROU-PER (i.e., the set of compatible helices with the greatest value of total LRT) shown in boldface. The inset shows the consensus structure for each RNA with the con-served helices shown in boldface and numbered corre-sponding to the above graph. Potential false positives (i.e., helices included in the final structure prediction but not present in the consensus structure) are indi-cated by “?.” In (C) the two RNase P pseudoknot pair-ings are indicated (pk1 and pk2).
crucial role in the early development of D. melanogaster. species has identified eight conserved pairings with LRT .25 (Table 1; Figure 2D). Helix 313-331/425-443 (Fig-Proper localization of bcd mRNA to the anterior pole
of the developing embryo is required for formation ure 1D) was initially split into two separate helices, 313-319/437-443 (LRT 5 34.92) and 324-331/425-432 of head and thoracic segments (Berleth et al. 1988;
Driever and Nu¨ sslein-Volhard 1988). Signal se- (LRT5 52.47), by PIRANAH due to the presence of internal mismatches. Similarly, helix 337-353/388-404 quences for bcd mRNA localization are contained within
the 39UTR and form part of an extensive RNA second- was split into 337-348/393-404 (LRT536.10) and 351-353/388-390 (LRT515.08). In both cases, the helices ary structure that is conserved in the genus Drosophila
Figure1.—Continued.
originally predicted as 537-542/687-692 (LRT530.48) support for the long-range pairings suggested by Mac-donald (1990; regions I, II, and the lower portion of due to an internal mismatch in species of the
melanogas-ter subgroup, was extended by 3 bp and LRT was calcu- IV in his model). These pairings were predicted by ther-modynamic folding of individual bcd 39UTR sequences, lated for the extended helix. Seven of the predicted
helices in our final structure are consistent with the followed by comparison of the folded structures ( Mac-donald1990)—not by strict phylogenetic comparison. model of Macdonald (1990). This model has been
confirmed in large part by mutational analysis (Ferran- It appears that even though similar structures are pre-dicted for the bcd 39UTRs of several Drosophila species, donet al. 1997;MacdonaldandKerr1998). The one
helix not present in the consensus model, 132-136/149- the pairings are not between homologous regions. Such pairings would not be detected by our method or by 153, is a perfectly conserved short-range pairing for
Figure1.—Continued.
complete consensus structure makes it difficult to evalu- 2096-2100/2112-2116), which contained either a termi-nal mismatch or termitermi-nal GU wobble pair, were ex-ate the accuracy of our predictions in this case. However,
the thermodynamically predicted secondary structure tended by 1 bp after visual inspection and LRT was recalculated for the extended helix. The SSU rRNA of the D. melanogaster bcd 39UTR contains seven helices
of length$3 that are conserved in the nine Drosophila consensus structure contains 15 helices of length$5 that meet the conservation criteria used in our analysis. species, all of which were identified in our analysis.
SSU rRNA: SSU rRNA is an integral part of the transla- Thus our method detected 87% of the consensus heli-ces, with three potential false positives. One consensus tional machinery of the cell and has a highly conserved
structure in Bacteria, Eukarya, and Archaea (van de helix that was not included in our final structure is a 5-bp helix, 1588-1592/2295-2299, which contains an internal Peeret al. 1998). The SSU rRNA secondary structure
has been predicted from extensive phylogenetic com- GU wobble pair in all five species. The LRT value for this helix was 13.72; thus it did not meet our condition parison; there are over 2800 aligned sequences presently
available (van de Peeret al. 1998). Due to the relatively of LRT . 20. The reason for this low LRT value is that inMuse’s (1995) algorithm GU wobble pairs are large sequence length, the high level of conservation,
and the vast number of represented taxa, we chose to considered as mismatches. The other consensus helix that was not included in our final structure is a 7-bp focus our analysis on five diverse eukaryotic species for
which the phylogenetic relationship is unambiguous. helix, 1575-1581/2339-2345, which has a 1-base gap in the S. stercoralis sequence, but is otherwise perfectly con-Species included represent arthropods, nematodes,
mammals, and fungi. The same five species were pre- served. This helix did have a relatively high LRT (40.52) but was not included in the final structure due to its viously used in a study of SSU rRNA nucleotide
substitu-tion rates (Rzhetsky1995). Because application of the lack of WC covariations. Each of the three potential false positives (helices 539-547/2360-2368, 1528-1532/ PIRANAH program to the aligned sequences resulted
in a large number of potential helices (over 650 with 1639-1643, and 1279-1283/1390-1394) is supported by only a single WC covariation occurring in one out of length$5), we used a hierarchical approach for final
structure prediction by GROUPER. An original struc- the five species.
Analysis of covariations:In this section we investigate
ture was generated using helices of length$6, LRT.
25, and at least one WC covariation. Helices with length whether the patterns of covariations observed in the inferred helices can be described by simple parameters. $5, LRT . 20, and at least one WC covariation that
were compatible with the helices determined above One interesting parameter that may affect the rate of compensatory molecular evolution is the length of heli-were then added to the structure. The final structure
was composed of 16 helices (Table 1), 13 of which are ces in which compensatory substitutions occur. Thus, for each helix in the final secondary structure models, consistent with previous models of eukaryotic SSU rRNA
structure (Figure 1E;Maidaket al. 1997; van de Peer we determined the number of WC and wobble covaria-tions present in the aligned sequences (Table 1). As
et al. 1998). An example is shown in Figure 2E. Three of
TABLE 2
Significance of LRT values
Type of RNA LRT Pa
(i) tRNA
Individual helices 35.63 0.00
33.61 0.00
25.98 0.04
25.82 0.04
Total structureb 121.04 0.00
(ii) 5S rRNA
Individual helices 40.60 0.00
40.02 0.00
28.77 0.02
26.87 0.02
Total structureb 136.26 0.00
aThe frequency of obtaining an LRT statistic$the observed
value from 100 random permutations of the original align-ment.
bTotal structures were predicted using a minimum LRT of
15. Total structure prediction using a minimum LRT of 10 produced identical results.
found for the Drosophila bcd 39 UTR mRNA and for the bacterial RNase P RNA, although in both cases only eight helices were identified. Both correlations are tighter for the internal covariations. A significant corre-lation was also observed for the internal covariations occurring in tRNA (which consists of four helices), but not for all covariations. For the ribosomal RNAs (both 5S and SSU), however, correlations between stem length and the number of covariations per pair were not found. In Figure 3A, the number of internal covariations per pair is plotted against stem length for the bcd 39UTR mRNA helices. To increase the data set, two Adh pre-mRNA helices were included. The latter two helices were identified in the adult intron and in intron 1 of Drosophila Adh and are well supported statistically (Kirbyet al. 1995) based on a similar set of sequences
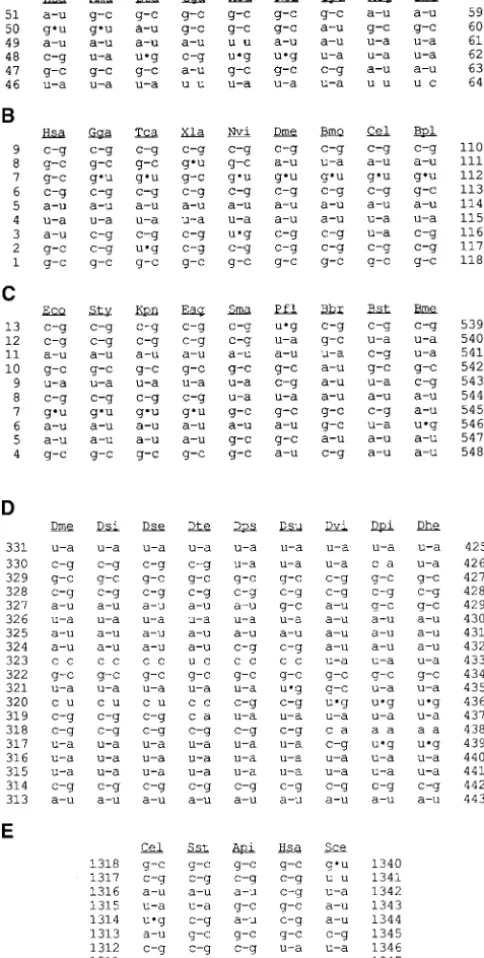
as the bcd analysis. Similarly, the number of internal covariations (per pair) of the RNase P RNA helices as a function of stem length is shown in Figure 3B. In both cases, the regression line describes the relationship Figure 2.—Examples of RNA secondary structures
pre-dicted by PIRANAH/GROUPER. Representitive helices from (A) tRNA, (B) 5S rRNA, (C) RNaseP RNA, (D) bcd mRNA
39 UTR, and (E) SSU rRNA are shown. The 59 coordinates TABLE 3 (according to the gapped alignment) are indicated at the far
Results of regression analysis
left; the 39coordinates at the far right. Species abbreviations are given at the top of each structure; complete species names
are given in materials and methods. Watson-Crick pairs Type of RNA R2 P
are shown connected by straight lines. GU wobble pairs are
tRNA 0.78 (0.95) 0.12 (0.02) indicated by dots.
5S rRNA 0.75 (0.59) 0.14 (0.23) RNase P RNA 0.66 (0.92) 0.01 (0.0002) bcd 39UTR 0.82 (0.95) 0.002 (0.00003) different selective constraints than internal pairings, we
SSU rRNA 0.01 (0.02) 0.68 (0.51) also determined the number of internal covariations.
Table 3 summarizes the results of our regression anal- The results of linear regression analyses for the numbers yses. Highly significant correlations between the num- of covariations per pair vs. stem length are presented for total
esis can be investigated further by defining a normalized number of covariations per pair for longer helices such that the number of covariations in a helix is scaled by the square of the stem length (instead of the stem length, as above). This definition is suggested by the proportional-ity between the number of covariations per pair and stem length for longer helices (see Figure 3, A and B). Thus, the normalized number of covariations per pair is expected to be nearly independent of differences in selective pressure for helices of different lengths. For pairings in RNA helices that are subjected to similar selection pressure,Kimura’s (1985) model of compen-satory evolution predicts that the rate of compencompen-satory changes depends critically on the physical distance be-tween the interacting nucleotides. If selection against mutations that destabilize a helix is much stronger than genetic drift, the rate of compensatory evolution is ex-pected to decrease with physical distance (Kimura1985; Stephan1996).
We explored this prediction for the Drosophila mRNA and the bacterial RNase P RNA structures. In Figure 4, A and B, we plotted the total number of covari-ations (divided by the square of the stem length) for the longer helices of the Drosophila mRNA (both bcd 39UTR and Adh) and the bacterial RNase P RNA struc-tures, respectively. To increase the number of helices containing covariations, the total number of covaria-tions was considered (instead of internal covariacovaria-tions). In both cases, the six helices that exhibit covariations are shown. One longer helix (length5 7 bp) was re-moved from the bcd data because it did not have any covariations and may thus be under stronger selective constraints. For the Drosophila mRNA helices, a signifi-cantly negative correlation between physical distance and the normalized number of covariations per pair was found (R2 5 0.89, P , 0.005); for the bacterial
structures, no correlation was observed (R2 5 0.201,
not significant). For internal covariations, qualitatively Figure3.—Number of covariations per pair vs. stem length. similar results were obtained.
The data are from (A) eight helices of Drosophila bcd mRNA
Based on predictions of Kimura’s model (Stephan and two helices of Adh pre-mRNA (see text) and (B) eight
1996) and estimates of Drosophila recombination rates helices of bacterial RNase P RNA. The numbers of internal
(Lindsley and Sandler 1977), these results suggest covariations are plotted.
that selection pressure on individual WC pairs in the longer Drosophila mRNA helices is relatively strong. The results for bacterial RNase P RNA are harder to between the number of covariations per pair and stem
length well. For longer helices, the number of covaria- interpret because the rate and pattern of recombination in bacteria are not well understood. Assuming that selec-tions is roughly proportional to stem length. Short
heli-ces (with total length#4) show no internal covariations, tion pressures are comparable in Drosophila and bacte-ria, the results may be explained by a lack of recombina-however, so that the regression lines of Figure 3, A and
B, intersect with the x-axis at positive values. tion in bacteria (seediscussion). Our results suggest that compensatory evolution in
the Drosophila mRNA and bacterial RNase P RNA
struc-DISCUSSION tures occurs faster in longer helices. The most likely
explanation for this observation is that selective con- Method of RNA secondary structure prediction:Our approach to RNA secondary structure prediction has straints are relaxed in longer helices, because mutations
hypoth-ation. Previous methods (e.g.,HanandKim1993) used simple measures, such as number of paired bases or number of mismatches, to rank helices for structure assembly. It is important to note that our method re-quires no a priori knowledge of the location of pairing regions, which was a limitation to most previous applica-tions of LRT (Kirbyet al. 1995;Muse1995;Parschet al. 1997). In addition, our method does not rely on
the ad hoc rules used by the phylogenetic-comparative method (Fox and Woese 1975;James et al. 1988). In
fact, covariations need not be present for a helix to be identified and included in the final structure (although helices containing covariations can be given additional weighting).
In four of our examples, tRNA, 5S rRNA, RNase P, and bcd 39UTR, we identified 100% of the conserved pairings in the established consensus structures. In the fifth example, SSU rRNA, the success rate was 87%. The number of false positives (predicted pairings that are not present in the consensus structure) was quite low for all five RNAs. Perhaps the most striking example of successful structure prediction is that of SSU rRNA. This is by far the longest of the five RNAs (1761–2487 nt depending on the species; 2533 nt in the gapped align-ment) and also the one for which we used the fewest representative sequences (five). A previous study using the thermodynamic folding algorithm of Jaegeret al.
(1990) reported a success rate ofz30% for eukaryotic SSU rRNA consensus helix prediction (Konings and Gutell 1995). It should be noted, however, that our method differs from thermodynamic prediction in that the former is designed to identify evolutionarily con-served helices from an alignment of homologous se-quences, while the latter is designed to predict the sec-ondary structure of a single RNA sequence.
An important consideration when using the above Figure4.—Number of covariations per pair (scaled by stem method is the choice of parameter values. Parameters length) vs. physical distance (in nucleotides). The data are
must be chosen for both the initial identification of from (A) four helices of Drosophila bcd mRNA and two helices
helices by PIRANAH and the assembly of the final sec-of Adh pre-mRNA and (B) six helices sec-of bacterial RNase P RNA.
Only helices that are longer ($5 bp) and have covariations are ondary structure by GROUPER. Since the most time-shown (see text). Here the numbers of total covariations are consuming part of the process is LRT calculation during plotted. the initial identification step, we chose parameter values
consider-helices were overlooked due to the choice of parameter may be relaxed, allowing more potential helices to be identified and considered in final structure predic-values in this initial step.
For the second step, assembly of the final secondary tion. It may also be possible to integrate sequence align-ment with secondary structure prediction. Currently, structure model, the major parameter value is minimum
LRT. Typically, this value must be increased as the se- alignment and structure prediction are completely separate procedures. Alignments are typically adjusted quence length increases. In the case of short sequences,
such as tRNA, 5S rRNA, or RNase P RNA, the LRT cutoff manually so that potential pairing stems are at corre-sponding positions in all sequences (Jameset al. 1988).
may be set relatively low (15 in our examples) because
there are few conflicting helices. In these cases, nearly This process could be automated by calculating LRT for each potential stem under several different alignment all of the helices in the final structure have LRT values
well above the cutoff (see Table 1), so our choice of schemes and choosing the alignment that maximizes LRT. Finally, increased computer processing power will minimum LRT was a conservative one. In addition, for
the two short sequences that were used for randomiza- make randomization simulations, such as those used for tRNA and 5S rRNA (Table 2), practical for longer tion simulations (tRNA and 5S rRNA; Table 2) the
re-sults were identical for LRT cutoffs of 15 and 10. This sequences. This will allow meaningful P values to be assigned to the LRT statistics of individual helices and suggests that the choice of minimum LRT does not
greatly affect the significance of the predicted structure. total structures.
Effect of stem length: Our analysis of covariations
For very long RNA sequences, the hierarchical approach
of the SSU rRNA example may be used. Here the first identified two parameters that are important for the evolution of compensatory mutations: the length of a helices assembled by GROUPER were those that had a
high LRT value and a long stem, i.e., helices whose helix and the physical distance between base-pairing residues. Positive correlations between the number of pairing potential was evolutionarily most conserved and
that were thermodynamically most stable. In subsequent covariations (per pair) and stem length were observed for the Drosophila bcd 39UTR RNA, bacterial RNase P steps, helices with shorter lengths and lower values of
LRT were added to the structure. Also, the number of RNA, and tRNA (Table 3 and Figure 3). The observed correlations may be explained by differences in selective potential helices may be reduced by requiring that at
least one WC covariation be present in each helix. Such constraints. Selective constraints in longer helices ap-pear to be relaxed because single mutations occurring constraints can greatly simplify structure prediction in
cases where there are many conflicting helices. This in these helices result in less helix destabilization than those occurring in short stems.
approach, however, may lead to structures that are
in-compatible with each other, depending on what the It is noteworthy that a similar correlation was not found for the ribosomal RNAs, in particular SSU rRNA. cutoff value of LRT for individual helices is. It may also
overlook helices that are perfectly conserved and thus A plot (not shown) of the helices of SSU rRNA (which includes also the helices of shorter length that were not have no covariations. More work is required to explore
this potential problem. considered in our analysis) suggests that there is an increase in the number of covariations for shorter stems The above examples revealed another problem
inher-ent in idinher-entifying potinher-ential helices by sequence compari- and a decrease for longer ones, with a maximum rate for an intermediate stem length (of 6 bp). The increase sons; that is, the length of homologous pairing regions
may differ among species due to internal or terminal in the number of covariations with stem length for shorter stems may be due to the relaxation of selective mismatches. PIRANAH uses a set of strict rules about
mismatches in searching for potential helices and may, constraints with increasing helix length, as discussed above for the other types of RNA. However, other mech-for instance, find two helices where there would be only
a single one if internal mismatches were allowed (see anisms, possibly related to the specific function of this type of RNA, have to be invoked to explain the decrease the bcd 39 UTR example). PIRANAH may also fail to
include the terminal base pair of a helix in cases where in the rate of compensatory evolution for longer SSU rRNA helices (Golding1994).
a mismatch or a GU wobble pair is present (see the SSU
rRNA example). It is therefore advisable to inspect the Distance effect:For the two larger RNAs (Drosophila mRNA and bacterial RNase P RNA) that showed a posi-output of PIRANAH before it is subjected to GROUPER.
The rule we followed during visual inspection of the tive correlation between stem length and the rate of covariation, we found that the number of covariations PIRANAH output was as follows: a helix was extended
by including mismatches or GU wobble pairs only if the (per pair) scaled by stem length decreases with the physical distance between base-pairing nucleotides (Fig-extended helix produced a greater value of LRT than
the originally predicted helix. ure 4). In contrast to bacterial RNase P RNA, for the Drosophila mRNA helices this negative correlation was Improvements to our method of secondary structure
prediction will certainly be possible as computer pro- found to be highly significant.
Kimura’s (1985) model of compensatory evolution cessing time becomes less limiting. For example, the
1991 Long-range structure in ribonuclease P RNA. Science 254:
things being equal (in particular, selection pressure on
853–856.
base-pairing residues), this model suggests that the dif- Han, K.,andH.-J. Kim,1993 Prediction of common folding struc-ference may be due to a lack of recombination in bacte- tures of homologous RNAs. Nucleic Acids Res. 21: 1251–1257.
Jaeger, J. A., D. H. TurnerandM. Zuker,1990 Predicting optimal
ria. Indeed, using reasonable estimates of Drosophila
and suboptimal secondary structure for RNA, pp. 281–306 in
recombination rates (LindsleyandSandler1977) and Molecular Evolution: Computer Analysis of Protein and Nucleic Acid of effective population size, N, and assuming sufficiently Sequences (Methods in Enzymology, Vol. 52), edited byR. F.
Doo-little.Academic Pres, San Diego.
strong selection on individual WC pairs, Stephan’s
James, B. D., G. J. Olsen, J. LiuandN. R. Pace,1988 The secondary
(1996) formula (8c) predicts a substantial decay in the structure of ribonuclease P RNA, the catalytic element of a ribo-rate of compensatory evolution over a distance of 100 nucleoprotein enzyme. Cell 52: 19–26.
Joyce, G. F.,andL. E. Orgel,1993 Prospects for understanding
nucleotides, as applies to these data (Figure 4A). [In
the origin of the RNA world, pp. 1–25 in The RNA World, edited by
formula (8c) mentioned above, A may be approximated R. F. GestelandandJ. F. Atkins.Cold Spring Harbor Laboratory by 2/3 N;W. Stephan,unpublished result.] Press, Cold Spring Harbor, NY.
Kim, S. H., F. L. Suddath, G. J. Quigley, A. McPherson, J. L. This theory suggests that the strength of selection on
Sussmanet al., 1974 Three-dimensional tertiary structure of
individual WC pairs, measured by the parameter 2Ns
yeast phenylalanine transfer RNA. Science 185: 435–440.
(where s is the selection coefficient), is on average much Kimura, M.,1985 The role of compensatory neutral mutations in molecular evolution. J. Genet. 64: 7–19.
larger than one for the Drosophila data. On the other
Kirby, D. A., S. V. MuseandW. Stephan,1995 Maintenance of
hand, the occurrence of wobble pairs and mispairings
pre-mRNA secondary structure by epistatic selection. Proc. Natl.
in the helices (see Figure 2D and Table 1) indicates Acad. Sci. USA 92: 9047–9051.
Konings, D. A. M.,andR. R. Gutell,1995 A comparison of
thermo-that the strength of selection may vary substantially
dynamic foldings with comparatively derived structures of 16S
among base pairs and that some stem evolution
pro-and 16S-like rRNAs. RNA 1: 559–574.
ceeds through slightly deleterious intermediates. A sta- Kru¨ ger, K., P. J. Grabowski, A. J. Zaug, J. Sands, D. E. Gottschling
et al., 1982 Self-splicing RNA: autoexcision and autocyclization
tistical method is needed to estimate the parameter 2Ns
of the ribosomal RNA intervening sequence of Tetrahymena.
directly from comparative sequence data.
Cell 31: 147–157.
We are grateful to K. Han and S. Muse who kindly made their Kumar, S., andA. Rzhetsky,1996 Evolutionary relationships of eukaryotic kingdoms. J. Mol. Evol. 42: 183–193.
programs and C code available. Furthermore, we thank two reviewers
Lindsley, D. L.,andL. Sandler,1977 The genetic analysis of meio-for their critical comments and helpful suggestions. The programs
sis in female Drosophila melanogaster. Philos. Trans. R. Soc. Lond. and sequence alignments used in our analyses, as well as additional
B 277: 295–312. documentation, are available at http://maple.lemoyne.edu/zbraverjm/
Macdonald, P. M.,1990 bicoid mRNA localization signal:
phyloge-ss.html. This research was supported in part by a National Science
netic conservation of function and RNA secondary structure. Foundation/Sloan Foundation postdoctoral fellowship to J.M.B., and Development 110: 161–171.
National Institutes of Health grant GM-58405 to W.S. Macdonald, P. M.,andK. Kerr,1998 Mutational analysis of an RNA recognition element that mediates localization of bicoid mRNA. Mol. Cell. Biol. 18: 3788–3795.
Macdonald, P. M.,andG. Struhl,1988 Cis-acting sequences
re-LITERATURE CITED sponsible for anterior localization of bicoid mRNA in Drosophila embryos. Nature 336: 595–598.
Berleth, T., M. Burri, G. Thoma, D. Bopp, S. Richsteinet al., 1988
Maidak, B. L., G. J. Olsen, N. Larsen, R. Overbeek, M. J.
McCaugh-The role of localization of bicoid RNA in organizing the anterior
heyet al., 1997 The RDP (ribosomal database project). Nucleic pattern of the Drosophila embryo. EMBO J. 7: 1749–1756.
Acids Res. 25: 109–111.
Brown, J. W.,1998 The ribonuclease P database. Nucleic Acids Res.
Mullner, E. W.,andL. C. Kuhn,1988 A stem-loop in the 39
untrans-26:351–352.
lated region mediates iron-dependent regulation of transferrin
Dirheimer, G., G. Keith, P. DumasandE. Westhof,1995 Primary,
receptor mRNA stability in the cytoplasm. Cell 53: 815–825. secondary, and tertiary structures of tRNAs, pp. 93–126 in RNA:
Muse, S. V.,1995 Evolutionary analyses of DNA sequences subject
Structure, Biosynthesis, and Function, edited by D. So¨ lland U.
to constraints on secondary structure. Genetics 139: 1429–1439.
Rajbhandry.American Society for Microbiology, Washington,
Odai, O., H. Kodama, H. Hiroaki, T. Sakata, T. Tanaka et al.,
DC.
1990 Synthesis and NMR study of ribo-oligonucleotides forming
Driever, W.,andC. Nu¨ sslein-Volhard,1988 A gradient of bicoid
a hammerhead-type RNA enzyme system. Nucleic Acids Res. 18: protein in Drosophila embryos. Cell 54: 83–93.
5955–5960.
Ekland, E. H.,andD. P. Bartel,1996 RNA-catalysed RNA
polymer-Osswald, M.,andR. Brimacombe,1999 The environment of 5S ization using nucleoside triphosphates. Nature 382: 373–376.
rRNA in the ribosome: cross-links to 23S rRNA from sites within
Ferrandon, D., I. Koch, E. WesthoffandC. Nu¨ sslein-Volhard,
helices II and III of the 5S molecule. Nucleic Acids Res. 11: 1997 RNA-RNA interaction is required for the formation of
2283–2290. specific bicoid mRNA 39UTR-STAUFEN ribonucleoprotein
parti-Pace, N. R.,andD. Smith,1990 Ribonuclease P: function and varia-cles. EMBO J. 16: 1751–1758.
tion. J. Biol. Chem. 265: 3587–3590.
Fox, G. E., andC. R. Woese,1975 5S RNA secondary structure.
Pace, N. R., D. K. Smith, G. J. OlsenandB. D. James,1989 Phyloge-Nature 256: 505–507.
netic comparative analysis and the secondary structure of
ribo-Gilbert, W.,1986 The RNA world. Nature 319: 618.
nuclease—a review. Gene 82: 65–75.
Golding, B., 1994 Using maximum likelihood to infer selection
Pandey, N. B., A. S. Williams, J. H. Sun, V. D. Brown, U. Bondet
from phylogenies, pp. 126–139 in Non-neutral Evolution: Theories
al., 1994 Point mutations in the stem-loop at the 39end of mouse
and Molecular Data, edited byB. Golding.Chapman & Hall, New
histone mRNA reduce expression by reducing the efficiency of York.
39end formation. Mol. Cell. Biol. 14: 1709–1720.
Gouy, M.,andW.-H. Li,1989 Molecular phylogeny of the kingdoms
Parsch, J., S. TandaandW. Stephan,1997 Site-directed mutations Animalia, Plantae, and Fungi. Mol. Biol. Evol. 6: 109–122.
reveal long-range compensatory interactions in the Adh gene of
Guerrier-Takada, C., K. Gardiner, T. Marsh, N. PaceandS.
Alt-Drosophila melanogaster. Proc. Natl. Acad. Sci. USA 94: 928–933.
man,1983 The RNA moiety of ribonuclease P is the catalytic
Pley, H. W., K. M. FlahertyandD. B. McKay,1994 Three-dimen-subunit of the enzyme. Cell 35: 849–857.
Rzhetsky, A.,1995 Estimating substitution rates in ribosomal RNA Thompson, J. D., T. J. Gibson, F. Plewniak, F. JeanmouginandD. G.
genes. Genetics 141: 771–783. Higgins, 1997 The CLUSTAL X windows interface: flexible
Scho¨ niger, M.,andA. von Haeseler,1994 A stochastic model for strategies for multiple sequence alignment aided by quality analy-the evolution of autocorrelated DNA sequences. Mol. Phylogenet. sis tools. Nucleic Acids Res. 25: 4876–4882.
Evol. 3: 240–247. Tillier, E. R. M., andR. A. Collins,1995 Neighbor-joining and
Scott, W. G., J. T. FinchandA. Klug,1995 The crystal structure maximum likelihood with RNA sequences: addressing interde-of an all-RNA hammerhead ribozyme: a proposed mechanism pendence of sites. Mol. Biol. Evol. 12: 7–15.
for RNA catalytic cleavage. Cell 81: 991–1002. Unrau, P. J., andD. P. Bartel, 1998 RNA-catalysed nucleotide
Seeger, M. A.,andT. C. Kaufman,1990 Molecular analysis of the synthesis. Nature 395: 260–263.
bicoid gene from Drosophila pseudoobscura: identification of con- van de Peer, Y., A. Caers, P. de RijkandR. de Wachter,1998
Data-served domains within coding and noncoding regions of the base on the structure of small ribosomal subunit RNA. Nucleic
bicoid mRNA. EMBO J. 9: 2977–2987. Acids Res. 26: 179–182.
Specht, T., J. WoltersandV. A. Erdmann,1991 Compilation of Woese, C. R.,andG. E. Fox,1977 Phylogenetic structure of the 5S rRNA and 5S rRNA gene sequences. Nucleic Acids Res. 19: prokaryotic domain: the primary kingdoms. Proc. Natl. Acad. Sci.
2189–2191. USA 74: 5088–5090.
Sprinzl, M., C. Horn, M. Brown, A. IoudovitchandS. Steinberg, Woese, C. R.,andN. R. Pace,1993 Probing RNA structure, function,
1998 Compilation of tRNA sequences and sequences of tRNA
and history by comparative analysis, pp. 91–117 in The RNA World, genes. Nucleic Acids Res. 26: 148–153.
edited byR. F. GestelandandJ. F. Atkins.Cold Spring Harbor
Stephan, W.,1996 The rate of compensatory evolution. Genetics
Laboratory Press, Cold Spring Harbor, NY.
144:419–426.
Stephan, W.,andD. A. Kirby,1993 RNA folding in Drosophila Communicating editor:G. B. Golding shows a distance effect for compensatory fitness interactions.