FURTHER ANALYSIS OF COMPLEX ALLOZYME POLYMORPHISMS I N A BARLEY POPULATION
B. S. WEIR
Department of Mathematics, Massey Uniuersity, Palmerston North, N e w Zealand
R. W. ALLARD AND A. L. KAHLER
Department of Genetics, University of California, Davis, California 95616
Manuscript received April 15, 1974
ABSTRACT
New theory has recently been developed for two-locus models. In the light of this theory, an earlier analysis of esterase allozyme data from an experi- mental barley population has been modified to take proper account of initial gametic phase (linkage) disequilibria. The results show that the directions in which two-locus genotypic frequencies deviated from products of one-locus frequencies in this population followed those predicted by neutral descent theory. The observed departures were, however, much larger in size than pre- dicted by the new descent measure theory, indicating that selection is operating in the population.
E
have recently reported (KAHLER and ALLARD 1970; ALLARD, KAHLER Wand WEIR 1972;WEIR,
ALLARD and KAHLER 1972) the results of the analysis of extensive esterase allozyme data for Composite Cross V, a n experimental barley (Hordeum uulgare L.) populatioa. It was evident from the third paper of the series, which was particularly concerned with joint frequencies at two loci, that two-locus properties could not be deduced solely from one-locus properties. Striking interactions were found between pairs of loci and this was a contributing factor to our hypothesis that selection was involved in the evolution of the population.During the same time period the senior author was engaged, i n collaboration
with PROFESSOR C. CLARK COCKERHAM, in constructing a new set of parameters to describe two-locus behavior (COCKERHAM and WEIR 1973; WEIR and COCKER- HAM 1973). Among other things, this theory enables the magnitude of the deviations of two-locus frequencies from the products of appropriate one-locus frequencies to be predicted in the neutral situation. These two-locus deviations depend on properties of a n initial population, and in particular on initial gametic phase (linkage) disequilibria. The original analyses of the data for Composite Cross V did not take proper account of such initial values and it is the purpose of the present note to rectify this. I t will be shown that the direction of the deviations is no longer surprising, but that the size of the deviations becomes much larger than predicted for neutral alleles.
9 1 2 B. S. WEIR, R. W. ALLARD A N D A. L. K A H LER
Two-Locus Deviations in the Neutral Case
The theoretical development of the amount by which two-locus frequencies are expected to deviate fro" products of one-locus frequencies is cast in terms of descent measures (COCKERHAM and
WEIR
1 9 7 3 ) . The use of these measures for loci A and B, with alleles ai and bi, respectively, that are linked to a n extent X (A is one minus twice the recombination fraction) is outlined below. The popu- lation will be supposed to be infinite and to practice a constant amounts of selfing and an amount 1 -s of random outcrossing.The descent measure F for an individual that receives gametes alb, and a,b,
is a n eight-component vector defined as
prob (a,
=
a,=
bl = b,) prob ( a , z a,, b, b,) prob ( a ,=
b,, a, b,) prob ( a ,=
b,, a2=
b,)%
prob (a,=
b,=
b,) f%
Frob (a,=
b,=
b,)+
prob ( a , a, b,)4-
$& prob ( a ,=
a,=
b,)%
prob ( a ,=
a,) f1/2
prob ( b ,=
b,)%
pmb ( a ,=
b,)f
%
prob (a,=
b,)%
pmb (a, E b,)+
%
prob (a,=
b,)where the equivalence relation z y means that genes z and y are descended from one initial gamete. The first component F:: is the most restrictive. The next three joint components F,,, F", ,,F each refer to descent from one or two initial gametes. The quantities averaged in each of the last fonr components are equal in the present case.
We now suppose that the initial population can be regarded as being drawn from a n infinite randomly mating population. This population has gametes aibj
in frequency pij, and genes ai, bi in frequencies p i , qj respectively so' that
pi =
z
pij7 and qi =7
pij. The initial gametic phase disequilibrium functions are thenThese initial values, together with the descent measure F allow the expression olf genotypic frequencies pi{ for individuals formed by the union of gametes aibj
and akbl and having descent status F (COCKERHAM and
WEIR
1 9 7 3 ) . Appropri-ate sums give one-locus frequencies, such as the usual expressions for frequencies of homozygotes aiai and bjbi:
The deviation of double ho'mozygote frequencies from the products of single homozygote frequencies has been shown (WEIR and COCKERHAM 1 9 7 3 ) to be:
A . . = p . . - piqi.
1.3 23
PI'
I.
- - p:f
pi ( 1 - p i ) F,, P:; = 4:f
~j (1-
q j ) F,.D::
= P i : -pi:
P:;
-
- ( F n - F t ) p i ( 1 - p i ) qi ( 1 - q j )
4-
A i j [ F t i+
2piqi (F1+
,F-
4,F; f 2F::)f
2 ( p i+
S i ) ( I F : - Ft:>I
COMPLEX ALLOZYME POLYMORPHISMS 913 These deviations are seen to depend on the initial gametic phase disequilibria and on the descent measures. We consider each of these in turn for the barley population.
Initial Gametic Phase Disequilibria
The synthesis of Composite Cross V has been described in detail by
KAHLER
and ALLARD (1970). In brief, the population was formed by crossing thirty varieties in pairs and paircrossing the F, hybrids for three cycles to form a grandF,
hybrid. Plants from the grandF,
hybrid were allowed to reproduce by the natural mating system (> 99% of self fertilization) to form anF,
generation from which Composite CrossV
was initiated in 1941. The population has since been propagated in large plots each year under standard agricultural practice without conscious selection. Seeds of theF,
generation are no longer available SO the properties of the initial generation of Composite CrossV
were inferred from the properties of the thirty parental varieties. Specifically, appropriate averages of the gamete frequencies observed in samples of each of the parents were taken and these averages were used to estimate gamete frequencies in the initial generation.Four esterase loci, denoted A,
By
C and D, were studied. LociA
and D had four alleles each while B and C each had three. It is convenient here to work with three alleles at each of the loci. In terms o l earlier notation (KAHLER and ALLARD 1970) these alleles are written asa, = A1.8 a2 = A1.0
b - B1.6
a, = AO.2 f A2 6
b
-
B3.9 3 -b, = B2 2 -
c, =
P 4
CZ = c 4 . 4 c3 = c4.9d , = D + j 4 d 2 - - D6.6 d , = D6.5
f
DNThe superscripts refer to migration distances and DN is a null allele.
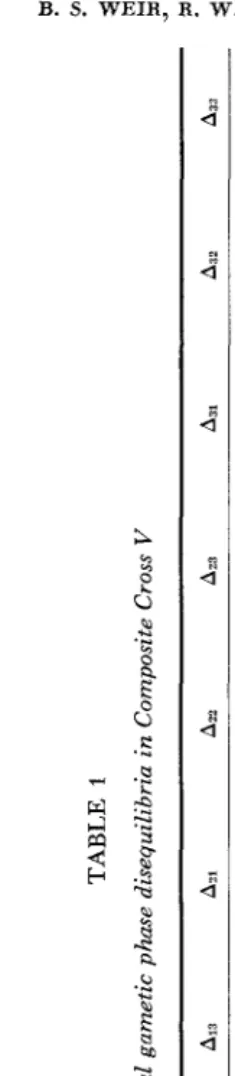
The values inferred for the initial gametic phase disequilibria are displayed in Table 1. The same symbol, A,j, is used for each pair of loci to denote the disequilibrium associated with allele i at the first locus and the jth allele at the second locus. The A,, values are the A values used f o r the earlier two-allele analysis (WEIR, ALLARD and KAHLER 1972). Note that the A i J sum to zero as required over each subscript:
2 A . = 2 A . . = 2 2 A , j = 0.
2 f 2 3 2 1 Descent Measures
Details for the evaluation of the descent measures have been given in full for mixed selfing and random mating by WEIR and COCKERHAM (1973). The measures are functions only of X and s. The linkage values for locus pairs A B , AC,
BC, AD, BD, CD are 0.9954, 0.9904, 09882, 0.0, 0.0, 0.0, respectively (KAHLER
and ALLARD 1970) and the estimate of s for Composite Cross V is 0.9943 (ALLARD, KAHLER and WEIR 1972).
TABLE
1
Initial
gametic
phase
disequilibria
in
Composite
Cross
V
1,oLi
Ai1
biz
A13
AII
A22
A23
A31
A32
A33
m
I”0.0135
-0.Ou50
-0.0085
0.0084
-0.0063
-0.0021
AB
-0.0219
0.0113
0.0106
AC
0.0071
-0.0Q.83
0.0212
0.0363
0.0471
-0.0834
-0.04.34
-0.01188
0.0622
BC
0.0276
-0.041
1
0.0135
-0.0145
0.0269
-0.0124
-0.0131
0.0142
-0,001
1
AD
-0.0124Q
-0.0414
0.0663
0.0423
0.0121
-0.0544
-0.0174
0.05293
-0.0119
BD
-0.0218
0.0096
0.0122
0.0172
-0.0067
-0.0105
0.0046
-0.0029
-0.0017
CD
-0.0897
0.0294
0.0603
0.0638
-0.0299
-0.0339
0.0259
0.0005
COMPLEX ALLOZYME POLYMORPHISMS
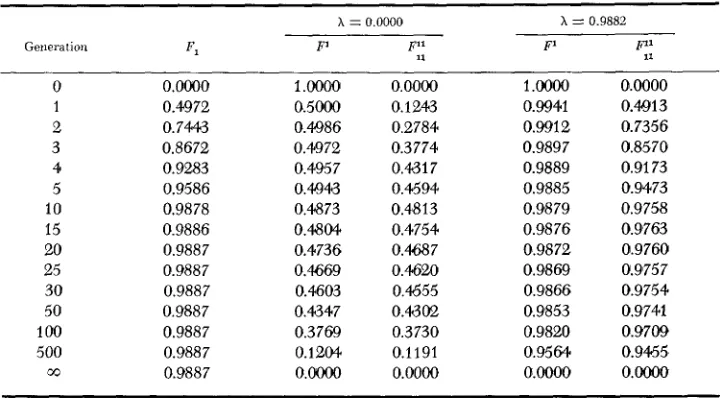
TABLE 2
Values of descent measures for 99.43% selfing
915
X = 0.0000 X = 0.9882
PI
11
F' F::
Generation Fl F'
0
1 2
3
4
5
10
15
20
25
30 50 100 500
00
o.ooy)o
0.4972 0.7443 0.8672 0.9283 0.9586 0.9878 0.9886 0.9887 0.9887 0.9887 0.9887 0.9887 0.9887 0.9887
1
.oooQ
0.5000 0.4986 0.4972 0.4957 0.4043 0.4873
0.4804
0.4736 0.4669 0.4603 0.4347 0.3769 0.1204
0.oyX)o
0.000(4 0.1243 0.2784 0.3774 0.4317 0.4594 0.4813 0.4754 0.4687 0.%u) 0.4555
0.4302
0.3730 0.1191
0.0000
1 .oom 0.9941 0.w12 0.9897 0.9889 0.9885 0.9879 0.9876 0.9872 0.9869 0.9866 0.9853 0.9820 0.9564
0.0000
0.0000 0.W13 0.7356 0.8570 0.91 73 0.9473 0.9758 0.9763 0.9760 0.9757 0.9754 0.9741 0.9709 0.9465
0. ou")
2 shows values of F , and
P,
F1l for i = 0.9882 and i = 0.0000. This table was constructed on the assumption that members of the initial population were non- inbred and unrelated, and that s = 0.9943.Obserued and Expected Two-Locus Disequilibria
With numerical values established (initial gene frequencies were given in ALLARD, KAHLER and
WEIR
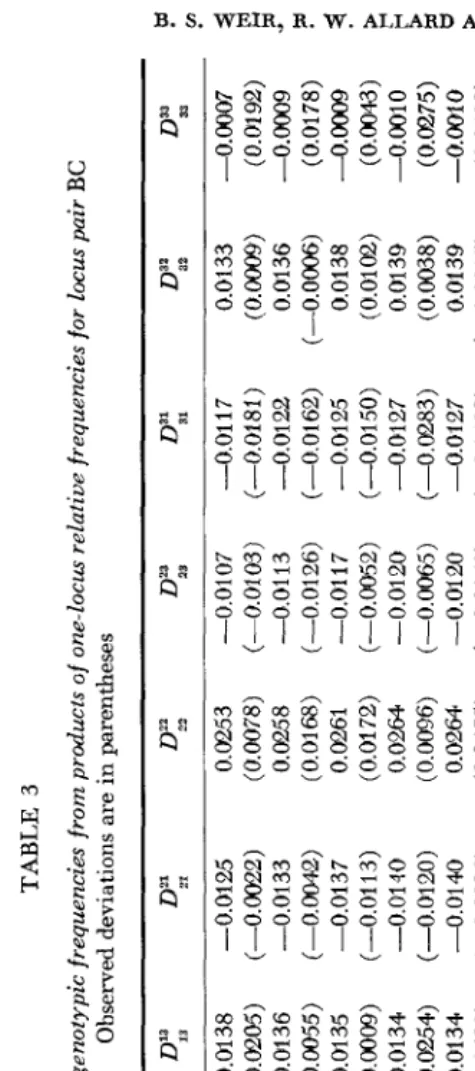
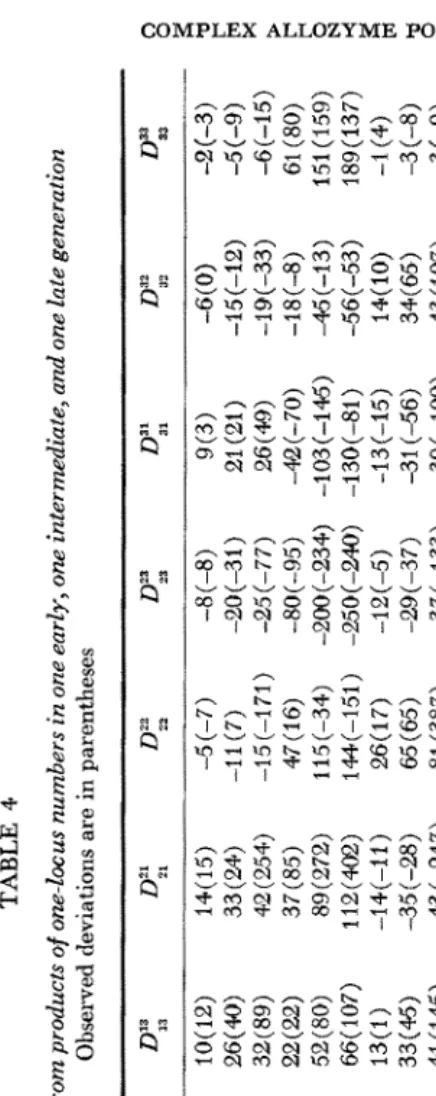
1972) we use equation (1) to calculate the two- locus deviations expected on the basis of no selection. Results are presented in a manner analogous to that used previously (WEIR, ALLARD and KAHLER 1972,Tables 9 and 10). Table 3 gives expected and observed deviations for frequencies for each of the ten generations studied for loci B and C . Table 4 gives expected and observed deviations of numbers (rounded to the nearest integer) for three generations for each of the six pairs of loci.
DISCUSSION
We need first to take account of the various assumptions made in obtaining the results displayed in the tables. The main assumptions were made in inferring the properties of the initial population. As expected, each of the thirty parental lines was highly homozygous (e.g., for loci B and C , the thirty samples yielded
4,523 double homozygotes, 33 single heterozygotes and 1 double heterozygote).
Any error that may result from equating frequencies of coupling and repulsion double heterozygotes (WEIR, ALLARD and KAHLER 1972) to obtain gametic frequencies is therefore negligible. For the three tightly-linked locus pairs AB,
TABLE
3
Expected
deviations
of
two-locus
relative
genotypic
frequencies
from
products
of
one-locus
relative
frequencies
for
locus
pair
BC
Observed
deviations
are
in
parentheses
Generation
4 5 6 14 15 16
17 24 25 26 0.0288 (0.0421
)
0.0282 (0.0261) 0.0279 (0.0~263) 0.0275 (0.0496) 0.0275 (O.GQ71) 0.0275 (0.0334) 0.0275 (0.0339) 0.0275 (0.0762) 0.0275 0.0275 (0.1
149)
(0.1
WO)
-0.0379 -0.0390 (-0.01
56)
-0.0396 (-0.06274) -0.0400 (-0.01
35
)
-0.0401 (-0.0425) -0.0401 (-0.m98) -0.0401 (-0.0529) -0.0401 (-0.0537) --0.(14.011 (-0.1208) -0.0401 (-0.1597)
(-0.W77)
0.0138
(-0.0205)
0.0136
(-0.0055)
0.0135 (0.0009) 0.0134
(-0.0254)
0.0134
(-0,0593)
0.0134 (0.033) 0.0134 (0.0184) 0.0134
(-0.0053)
0.0134 (0.01
67)
0.0134 (0.0472) -0.0125 (-O.OQ22) -0.0133 (-0.0042) -0.0137 (-0.0113) -0.0140 -0.0140 (-0.0326) -0.0140 (-0.01
24)
-0.0140 (-0.01
14)
-0.01
40
(-0.01321
)
-0.0140 (-0.0733) -0.014Q
(-0.01
20)
(-0.osOO)
0.0253 (0.0078) 0.0258 0.0261 (0.01
72)
0.0264 (0.00!36) 0.0264 (0.0475) 0.0264 (0.0309) 0.0264 (0.0266) 0.0264 (0.0579) 0.0264 0.0264 (0.1256)
(0.01
68)
(0.1191)
-0.01
07
(-0.01
013)
(-0.01
26)
-0.01
13
-0.01
17
(-0.0052) -0.0120 (-0.0065) -0.0120 (-0.01
50)
-0.0120 (-0.0128) -0.0120 (-0.0149) -0.0120 (-0.0408) -0.0120 (-0.0462) -0.0120 (-0.0432)
-0.01
17
(-0.01
8
1
)
-0.0122 (-0.01
62)
-0.0125 (-0.01
50)
-0.0127 (-0
,0283)
(-0.M3) -0.0127 -0.0127
-0.0127 (-0.0146) (-0.0229) -0.0127 (-0.0356) -0.0127 (-0.03
14)
(-0.0325)
-0.0127
0.0133 (0.W) 0.0136
(-0.000s)
0.0138 (0.0102) 0.0139 (0.0038) 0.0139 0.0139
(-0.0005)
0.0139 (0.0264) 0.0139
(-0.003
1)
0.0139 (0.0034) 0.0139 (0.0346)
(-0.0015)
-0.0007 (0.01
92)
-0.craO9 (0.01
78)
4.m
(0.001LE3) -0.0010 (0.0275) -0.0010 (0.a4.98) -0.0010
(0.0147)
-0.m10 -0.0010 -0.0010 (0.0272) -0.0010 (-0.003
1
)
(-0.0033)
TABLE 4 Expected deuiations of two-locus numbers from products of one-Locus numbers in one early, one intermediate, and one late generation Observed deviations are in parentheses Imus Gener- Sample pair ation size
D'? 39
6 1006 AR 17 2461 26 3083 6 1006 AC 17 2451 26 3083 6 1000 BC 17 2461 26 3083 6 1006 AD 17 2468 26 3082 6 10% BD 17 2458 26 3080 6 1006 CD 17 2458 26 3082 -21 (-21) -53 (-47) -67 (-301)
8(-IO) 1 9 (-124)
24 (-31 4) 28 (26) 68 (84) 85 (354)
-12(6) -28(18) -34(82) -11(4) -25 -&(-IO)
(-30)
-31
(-147)
-104(43) -127(-101)
11 (9) 28 (6) 35 (212) -26 (4) -67 (49)
-84(213) -4Q(-28) -99
(-130) -1 24 (-492) -20 (-6) -47 (-33) 5(-5) -58 (-73)
ll(16) 14(66) 15(7) 35 43(49)
(-67)
lO(l2) 26(4Q) 32 22(=)
(89)
52
(80)
66(
107)
13s) 33(45) 41
(145)
78(22) 96(1) 6(1)
33
(-2)
15(13) 18(75) 71
(20)
87(45)
14(15) 33
(24)
42
(254)
37(85) 89
(272)
112(4O2) -14(-11) -35
(-28) 21 (-5) 8(-5) 20 (20) -43 (-247)
50(15) 62(-83) 25
(141)
72(5O) 92(163)
31 (-10) -5 (-7) -11 (7)
-15(-171) 47(16) 1 15
(-34)
144.(-151) 26(17) 65(65) 81
(387)
6(13) 1518) 18(96) -3 (6)
-8(-21) -9(-76) -14(9) -34(-10) -42(-88)
-8 (-8) -20 (-3 1 ) -25 (-77)
-8O(-95) -200
(-234)
-250(-240) -12(-5) -29(-37) -3
7
(-1
33)
-26(-5) -62
(-3 1 ) -77 (-24) -5 (0)
-12(2) -15(-57) -18(2) -39(-38) -48
(-68) 9(3) 21 (21) 26 (49) -42(-70) -13O(-81)
-103(-145) -13(-15) -31
(-56)
-39(-100) -8
(-4) -1 0 (-36) -24 ( 7)
%(I) 6(11) 7 (4) 13(16)
31
(-96)
38
(-60)
--WO) -15(-12) -1 9
(-33)
-IS(-8) -a(-13) -56(-53) 14(
10)
34(65) 43(107) 14(-6) 42
(-21
)
34(25) -1
(-1)
-3
(4)
-4(10) O(-15) l(77) 1(M)
D::
-2(-3) -5
(-9)
-6(-15) 61
(SO) 151 (159) 189( 137) -1 (4) -3 (-9) -3 (-8)
-6(10) -17(17) -14(12) -1
(-1)
-2(-15) -2(-18) -13(-2) -37(21)
918 B. S. WEIR, R . W. ALLARD A N D A. L. KAHLER
gametic frequencies will have been very close to the averages of gametic fre- quencies among the thirty parents. On the other hand, considerable recombi- nation would be expected to occur among the unlinked locus pairs A D , BD, and
C D during the synthesis of the population; so we are not justified in saying that
initial gametic frequencies are represented by the average of the parental gametic frequencies. Exactly the same remarks apply to the initial linkage disequilibria, thus providing a basis for the better agreement between observations and pre- dictions for the first three locus pairs than the last three pairs in Table 4.
Use of the descent measure theory also implies that initial genotypic fre- quencies can be regarded as those for a sample from a n infinite randomly mating population, i.e., that they correspond to an average over all possible pairings of the initial gametes. Since large numbers of seeds were used from each cross in the synthesis of the population, this assumption seems appropriate and correction for finite population size seems unnecessary.
The descent measures themselves depend on the estimated values of the selfing parameter s and the linkage parameters A. These parameters were estimated from very large samples and the estimates have small standard errors (KAHLER and
ALLARD 1970; ALLARD, KAHLER and WEIR 1972) ; consequently the estimates
can be used with confidence.
Turning to the implications of the results in Tables 3 and 4, we note first the good agreement between predictions and observations with regard to the sign of the deviations. This reflects the sign of the appropriate initial gametic phase disequilibrium, since for the present values of s, equation (1) is approximated by
after the first few generations. For loci A and B there is almost perfect agreement in sign. For loci A and C there is agreement in six out of nine classes, and two of the disagreeing classes have observed deviations which change sign over time, suggesting a sampling phenomenon. For loci B and C there is agreement in six out of nine classes in Table 3 (eight out of nine in Table 4) and again the dis- agreeing classes have changing signs. As expected, the agreement is not as good for locus pairs A D , B D and CD. Notice that we have not considered the heterozy- gous classes. Such small numbers of heterozygotes were observed that any trends would be obscured by sampling effects. Although the deviations are phased in terms of A,j, they are, of course, just a consequence of the way in which allelic pairs entered the population.
With respect to size of deviations, the results reported in Tables 3 and 4 show the agreement between predicted and observed values is good in the early genera- tions. However, agreement becomes increasingly poor in later generations and it becomes very large in the latest generations. This indicates that neutral descent theory does not adequately describe the behavior of the esterase alleles. Indeed, we already know that this must be the case since allelic frequencies change significantly i n Colmposite Cross V over time (ALLARD, KAHLER and WEIR 1972),
COMPLEX ALLOZYME POLYMORPHISMS 919
the original conclusion that selection is the predominant force responsible f o r the development of genetic organization in Composite Cross
V.
ments on an earlier draft of this paper.
We are grateful to DRS. A. H. D. BROWN, M. T. CLEGG and D. R. MARSHALL for their com-
LITERATURE CITED
ALLARD, R. W., A. L. KAHLER and B. S. WEIR, 1972
COCKERHAM, C. CLARK and B. S. WEIR, 1973
KAHLER, A. L. and R. W. ALLARD, 1970
WEIR, B. S., R. W. ALLARD and A. L. KAHLER, 1972
WEIR, B. S. and C. CLARK COCKERHAM, 1973
The effect of selection on esterase allo-
Descent measures for two loci with some appli-
Genetics of isozyme variants in barley. I. Esterases.
Analysis of complex allozyme polymor-
Mixed self and random mating a t two loci. Genet.
Corresponding editor: T. PROUT zymes is a barley population. Genetics 72: 489-503.
cations. Theoret. Pop. Biol. 4: 30CL330.
Crop Science 10: 444-448.
phisms in a barley population. Genetics 72 : 505-523.