Article 1
Do Bus Rapid Transit Systems improve accessibility to
2job opportunities for the poor? The case of Lima, Peru
3Daniel Oviedo1, Lynn Scholl2 Marco Innao3, Lauramaría Pedraza4 4
1 Lecturer Development Planning Unit, university College London, UK; [email protected] 5
2 Senior Transport Specialist, Inter-American Development Bank, Washington D.C. USA. [email protected] 6
* Correspondence: [email protected]; Tel.: 1-202-623-2224 7
3 Senior Transportation Planner, Louis Berger, 96 Morton St, New York. USA. [email protected] 8
4. Transportation Planner, Inter-American Development Bank, Washington D.C. USA. [email protected] 9
10
Academic Editor: name 11
Received: date; Accepted: date; Published: date 12
13
Abstract: Investments in public transit infrastructure in Latin America and the Caribbean often aim to reduce spatial 14
and social inequalities by improving accessibility to jobs and other opportunities for vulnerable populations. The 15
Metropolitano, Lima’s Bus Rapid Transit (BRT) project had as one of its central goals to connect low-income 16
populations living in the peripheries to jobs in the city center. We examine the contribution of Lima’s BRT system to 17
accessibility to employment in the city, particularly for low-income public transit users. Building on secondary 18
datasets of employment, household socio-demographics and Origin-Destination surveys before and after the BRT 19
began operations, we assess its effects on potential accessibility to employment, comparing impacts amongst lower 20
versus higher income populations. Findings suggest that the BRT line reduced travel times to reach jobs, in 21
comparison with traditional public transport in the city, amongst populations living within walking distance of the 22
system. However, we also find that the coverage of the BRT declines in areas with high concentrations of poor and 23
extreme poor populations, limiting the equitability of the accessibility improvements. We analyze the distributional 24
effects of BRT infrastructure and services, discussing policy avenues that can improve the prospects for BRT system 25
investments to include the poor in their mobility benefits. 26
27
Keywords: Bus Rapid Transit; employment; accessibility, equity 28
29
1. Introduction 30
Bus rapid transit (BRT) systems are recognized in international policy circles as efficient, cost-effective, 31
public transport solutions for cities facing mobility challenges associated with rapid urbanization and 32
motorization, particularly in cities of the Global South. Implemented in various cities across Latin America, 33
searching to restructure transport networks to improve operational inefficiency and address large levels of 34
informality in public transport services, such systems typically aim to increase overall mobility while also 35
reducing negative externalities such as traffic accidents and emissions of local and global pollutants. In 36
addition, they often seek to improve mobility and access to jobs, goods, and services for the poor. 37
The extent to which the poor and vulnerable groups are included in these benefits is a growing area 38
of research relevant to objectives of promoting social inclusion while fostering environmentally sustainable 39
economic development. Low-income populations often bear the highest burdens related to negative 40
transport externalities in cities, including longer travel times, and higher exposure to pollution and risk of 41
traffic accidents. A lack of access to affordable and efficient transport generates social exclusion, impeding 42
access to employment opportunities, services, and markets. As poor populations often live on the periphery 43
of Latin American cities, they tend to have the longest travel times and to incur more transfers, generating 44
high transport costs to reach employment opportunities. 45
Reduced travel times to reach destinations within a city afforded by investments in faster and more 46
efficient public transport can make previously inaccessible job markets accessible, within given monetary 47
and time budgets, thereby increasing the likelihood of formal employment, increased income and potential 48
accumulation of assets for populations living within the area of influence of the systems. However, little 49
research exists on the extent to which these benefits are realized and what policy measures are needed to 50
improve the distributional outcomes of such transit investments, particularly in the developing country 51
context. 52
In 2010, the first BRT corridor began operations in Lima, Peru. One of the key objectives of the project 53
was to connect low-income populations living in the far-flung outreaches of the sprawling and congested 54
metropolitan area to jobs in the center. Prior to the opening of the line, the corridor, and city was plagued 55
by an oversupply of polluting and unregulated minivan transit providers, leading to lengthy commutes of 56
up to 2 hours in each direction for those living in the periphery. Although prior research on the system has 57
found that the system carries a fair number of lower income groups, coverage in areas in extreme poverty 58
is limited. Nevertheless, the poor and extreme poor tend to use the system for longer trips and to reach 59
work or education. In this paper, we assess the extent to which Lima’s BRT system increased access to 60
employment measuring potential accessibility and the spatial distribution of opportunities in the city. 61
Utilizing data on employment, socio-economic status, and other demographic variables at the 62
household level before and after the BRT system we assess the effects on accessibility to employment for 63
lower income groups. We hypothesize that reduced travel times of Lima’s urban poor living near BRT 64
stations and feeder lines, because of the project, may increase access to a wider array of opportunities and 65
jobs, leading to increased rates of employment, and an overall reduction of generalized costs of travel, 66
which may support economic affordability and alleviate time poverty. We analyze the spatial distribution 67
of opportunities for employment in Lima and how these patterns are influenced by land-use and other 68
features of the city. Next, we explore the changes in potential accessibility to employment opportunities 69
attributable to the BRT in low-income areas of Lima. Finally, we discuss policies to improve the prospects 70
for BRT system investments to include the poor in their mobility benefits through increasing the 71
understanding of factors that contribute or impede access to employment via mass transit. The results of 72
this analysis draw lessons for future urban transport projects aimed at improving mobility and accessibility 73
for the urban poor. 74
Our findings suggest that, while overall the BRT line, in comparison with traditional public transport 75
in the city, reduced travel times to reach jobs amongst populations living within walking distance of the 76
system, the coverage of the BRT is limited in areas with high concentrations of poor and extreme poor 77
populations, reducing the equitability of the accessibility improvements associated with the project. Our 78
scenario analysis of the accessibility gains in the system suggests reductions in travel times for trips longer 79
than 6 km. Such trips are usually made by the poor. Given that the system is the first of several planned 80
lines, it carries a small fraction of the total city’s public transit demand, limiting the role of the system in 81
2. Background 83
Although over 72 million people in the Latin America and the Caribbean region have transitioned out 84
of poverty and nearly 94 million have joined the middle class, since 2003, 42% of the region’s population 85
(140 million) still live in economic poverty, while nearly 67 million people are below the poverty line of 86
US$2.5 per day. In Latin American cities, poverty tends to be concentrated in peripheral areas far from jobs 87
and other economic activities. From 1950 to 2014, the share of the population in Latin America living in 88
urban areas increased from 40% to around 80% and is expected to increase to 90% by 2050 [1]. This spatial 89
segregation of the poor from skill-appropriate job centers has been theorized to decrease the affordability 90
of job search and access, and thus increases unemployment [2]). Reduced access to a wider job market may 91
in turn contribute to the persistence of poverty by reinforcing the restrictions on the availability of resources 92
and disposable income for household travel. 93
People experiencing economic poverty often must negotiate the allocation of limited disposable income 94
for transport and other essential needs, which can significantly reduce their mobility and accessibility to 95
employment, education and other relevant social and cultural opportunities such as education, leisure and 96
healthcare. This may in turn hinder their ability to accumulate assets needed to overcome poverty. As low-97
income populations are often captive users of public transport or rely on non-motorized travel because of 98
affordability barriers, travel expenditures can consume 30% or more of daily wages of the poor, adding to 99
the already-high travel time costs, which in some cases can exceed two hours [3] 100
Data from the Development Bank of Latin America (CAF) (2012) shows that in the largest 15 101
metropolitan areas in Latin America people consume 1.1 hours per trip per day, which adds to over 118 102
million hours per day. However, the distribution of travel times is not uniform across social groups. By 103
being farther from the city center, lower income citizens, who are the social group that uses public transport 104
the most, are forced to experience longer travel times because of larger distances, congestion, and often 105
poor local coverage of public transport that requires long walking times to bus and train stations. For 106
example, while bus users spend on average 58.8 minutes per trip, car users in the region spend on average 107
25.5 minutes per trip [4]. These longer trips and excessive walking and travel times can result in time 108
deprivation for opportunities such as higher education, as well as leisure and, in some cases, social 109
interactions [5]. 110
Higher travel expenditures and long travel times can also often lead to immobility and social exclusion 111
among vulnerable members of poor households, as resources are prioritized to pay for work, or income 112
generating trips. For example, transit users buying up to 50 tickets per month can spend up to 20% of their 113
income, while car users tend to spend on average below 10% [6 -10]. As a result, the poor tend to sacrifice 114
trips, with the majority of the poor in the cities of developing countries make on average between one-fifth 115
and one-third fewer trips per capita than the non-poor [6, 7, 8, 11]. This can reduce available resources 116
among non-working household members for travel, who may also suffer from acute time poverty, since 117
they assume more household responsibilities such as home making and caring for children and the elderly 118
[6]. 119
Finally, gaps in infrastructure supply and quality can exasperate the barriers created by spatial gaps 120
between housing and jobs. Although there are approximately 245,000 km of roads available for circulation 121
in metropolitan areas of Latin America (17km/km2), their quality is precarious in most cities [7]. In addition, 122
public transport modes tend to have lower priority in the allocation of road space [10], with between 98% 123
and 99% of total road space in cities of Latin America being dedicated to private vehicles and scant 124
provision of exclusive roads for pedestrian circulation, which in the region represents only 0.4% of built 125
cyclist spaces, tend to be concentrated in and around the Central Business Districts (CBD) of the different 127
metropolises and higher income neighborhoods, while most of the damaged and unsurfaced roads are in 128
low-income (and often peripheral) areas [7, 12]. 129
2.1 Accessibility: Policy relevance, concepts, measurement, and the links with social exclusion 130
The concept of accessibility has occupied an increasingly relevant position in modern urban transport 131
theory and practice, leading to a change in urban policy objectives throughout the Global North and 132
South[13] The new agenda for sustainable development recognizes the transformative role of cities as 133
catalysts for the development of not only more sustainable societies, but ones that can be more inclusive 134
and resilient [15]. Such agenda does not only recognize the role of cities in human development, but also 135
the role of transport in urban development, social equity and inclusion. 136
Measuring accessibility can be a key factor in equity analysis, for example when evaluating the 137
distribution of access benefits of new transport systems across income or spatial groups [6, 15, 16]. Its 138
measurement requires robust definitions of accessibly and adequate data to measure the characteristics and 139
expected benefits of such interventions. Nearly all accessibility definitions and measurements consider the 140
potential range of interactions within transportation networks and the spatial and economic constraints of 141
movement within an urban area. Definitions of accessibility in the literature vary widely and include: the 142
potential opportunities for interaction [17], the ease of reaching areas of activities within a given transport 143
system [18], and the overall benefits provided by a given transport system [19]. More recent literature 144
defines accessibility as the ease of reaching desired destinations and available opportunities, given 145
available resource constraints for travel [6]. Framing the concept at different scales, from individual to 146
neighborhoods and communities, van Wee, Geurs & Chorus [20] identify four components of accessibility: 147
land-use, transportation, temporal, and individual. 148
Research suggests that accessibility to employment is significantly affected when competition factors, 149
understood as the matching between abilities, education and experience between an individual and a given 150
job position, are incorporated in the estimation of accessibility indicators [21]. The interaction between these 151
components is argued, in turn, to influence access. For instance, the distribution of activities in space (land-152
use) is a determining factor in travel demand (transport), and it can also produce time constraints 153
(temporal) and influence people’s opportunities (individual). 154
The linkages between better connectivity brought about by investments in transport infrastructure 155
(transport), the subsequent consolidation of land uses, and changes in land market (accessibility surplus), 156
act together to influence the distribution of activities and travel costs along the land-use, transport and 157
individual components of accessibility. Additionally, urban transport interventions can foster significant 158
changes in access to social and economic opportunities available in cities and, in turn, can affect travel 159
demand, influencing performance and capacity requirements of transport infrastructure and services [22] 160
Finally, the individual component interacts with other determinants of accessibility because they may affect 161
the subjective interpretation and valuation of the variables considered in transport disutility, preferences 162
for activities and the availability of time for specific activities. 163
Various measures of accessibility have been developed to assess these potential interactions between 164
the cost of travel and opportunities [23]. Infrastructure-related measures link the effects of transport 165
infrastructure and services over the connectivity of people and activities [24]. Activity-related measures 166
account for land uses and the locations of opportunities, estimating the number of activities that can be 167
[25], which are calculated from the perspective of origin zones to all other zones of the area of study. 169
Measuring accessibility requires data on generalized travel costs, demand characteristics such as number 170
of households, job clusters, commercial activities, and origin-destination interaction. 171
Accessibility-oriented transport planning focuses on the role of transport as an enabling agent to reach 172
destinations where needs can be met, opening the door not only to better transport planning but also to 173
interventions in terms of location and proximity, as well as communication and ‘electronic connectivity’ 174
[26]. Thus, policies and urban planning that foster accessibility entail the consideration of a myriad of 175
factors from street characteristics and barriers to network arrangements and efficient public transport 176
development. In this regard, the concept of accessibility, from a policy perspective, encourages multi-177
modal solutions with larger considerations for individual and collective conditions for mobility, paying 178
special attention to vulnerable groups such as the elderly, disabled and poor. 179
Several studies have examined the impacts of transport investments on accessibility with a focus on 180
equity in Latin American cities, finding that transport access is highly unequal among socioeconomic 181
groups. Bocarejo and Oviedo [6] find for the city of Bogotá that high-income populations had potential 182
access to one or more employment positions per inhabitant at costs equal or below their preferred 183
expenditure, while the poor had access to 0.2 to 0.5 jobs per inhabitant even when expending more than 184
their desired budgets for time and money to invest in transportation. Another study finds that low-income 185
homemakers and employed women in Recife, Brazil, walk up to 2 km for accessing shopping, 1.2 km for 186
education, 1.5 km for healthcare and 4.3 km for work. In Montevideo, Uruguay, Hernandez and Roseli [28] 187
find that long waiting times for public transport and high tariffs prevent low-income families from 188
accessing adequate healthcare for their children, and that peripheral households tended to trade-off 189
distance for cost in choosing where to address their healthcare needs. 190
While some have estimated changes in access to work opportunities from BRT systems, very few 191
studies to date have estimated the effect on labor market participation in Latin American cities. Some 192
examples include research on the impact of accessibility, both to BRT stations and to travel destinations 193
through the BRT. The proximity of BRT routes to the residential location of low-income communities 194
strongly affects equity impacts of accessibility gains. Most trunk routes are initially deployed along high-195
volume corridors in and near city centers, where they tend to serve older, better-off neighborhoods better. 196
For example, the first phases of the Masivo Integrado de Occidente (MIO) BRT system of Santiago de Cali 197
(Colombia) covered only 9% of city districts, located mostly in the central parts of the city [28], and skewing 198
benefits in favor of the middle and upper-middle strata (Delmelle and Casas, 2012). 199
2.2 Urban Transport and Poverty in Lima, Peru 200
Lima, the capital of Peru, is one of the fastest growing urban areas in Latin America. Its population of 201
slightly above 9.9 million1 represents about one-third of the population of the country.2 Between 2007 and 202
2012 Lima’s population increased by 11%. General trends of economic growth in Lima and Peru have led 203
to a relatively stable increase in individual income since 2007. The distribution of socio-economic groups 204
reflects historic development patterns of Lima. New rural migrants typically settled in the urban periphery 205
while the middle-class and elites moved to the city center [29]. Today, Lima’s low-income population still 206
1 Instituto Nacional de Estadística e Informática (INEI). Available online: https://www.inei.gob.pe/prensa/noticias/cerca-de-10-millones-de-personas-viven-en-lima-metropolitana-8818/ (accessed January 20th, 2018).
live mainly in the periphery of the city in the northern and southern cones, while high-income populations 207
are concentrated in the central and south-central areas of the city. Forty-two percent of the extreme poor 208
(Stratum E) and 19% of the poor population (Stratum D) live at least 9 km from the city center. The extreme 209
poor also frequently live in informal settlements characterized by a general lack of infrastructure and public 210
services [30]. 211
Many low-income neighborhoods are outside the immediate area of coverage of the mass transit lines 212
in the north and west of the city.3 In 2014, 11.5 million Peruvians (72.8%) were directly or indirectly 213
involved in informal employment, with 8.8 million (55.9%) working within the informal sector and 2.7 214
million (17.0%) working as informal workers in the formal sector [31]. Lower-income groups in Lima tend 215
to have longer travel times and higher comparative rates of public transit use. They have lower per capita 216
vehicle ownership rates and make the largest share of their daily trips on foot—28% of trips in Stratum D 217
and 35% in Stratum E—followed by trips on traditional buses4 [32]. Public transit services in the traditional 218
system encompass a mix of formal and informal supply. Approximately 30% of public transit services are 219
categorized as informal (or unregulated), which is associated with poor service quality as well as high levels 220
of traffic accidents and air pollution [33]. 221
Lima’s BRT project, “El Metropolitano”, was the first line of a city-wide mass transit solution planned 222
for the city. The corridor comprises 28.6 km of segregated busway connecting the northern and southern 223
areas of Lima with the financial district, major universities, and the city’s historic downtown. The line also 224
integrates feeder routes that extend up to 14 km and connect the two terminals with the surrounding and 225
primarily low-income neighborhoods in the north and south. 226
The system opened (in 2010) with only 22% of the planned articulated buses and five feeder routes in 227
operation due in part to low demand and unfinished infrastructure [34]. A year and half later (mid-2012), 228
only 64% of the trunkline fleet was operating. Reforms that impacted service quality and demand, such as 229
the reorganization of existing bus routes and removing direct competitors from the corridor were also 230
significantly delayed.5 Moreover, the tariff policy was restructured several times to attract more demand 231
from the feeder areas. 232
Despite the initial implementation challenges, the system has improved over time, expanding the fleet 233
of buses and the number of feeder lines and seeing substantial corresponding increases in passenger 234
demand. Ridership grew from just under 200,000 passengers per day in the first year to over 600,000 per 235
day in 2016. By 2013 it also achieved its design goal of 60% of ridership of lower and middle socioeconomic 236
strata, however, the share of ridership by poor and very poor (43%) people is lower than that from the 237
middle class (57%).6 Although usage by the extreme poor is lower than the poor and middle class, a recent 238
study of the system found that BRT is much more likely (12.4 percentage points more) to be used among 239
3 GIS analysis for this study using data from INE, 2007 (also see Annex II).
5 Traditional buses include Combis, Colectivos, Omnibus and Microbus which are types of informal and traditional
collective transport vehicles that range in size (e.g. a combi is an informal mini-bus, while an omnibus is a larger bus with capacity to carry 90 passengers or more.
5 The administration’s zero-impact policy and several agreements between bus owners and the municipality stalled the removal of the competing service.
lower income groups when making a trip for work or education purposes, indicating that users are willing 240
to pay more for income- (or future income-) generating trips [35]. 241
3. Data 242
We estimate the impacts of BRT systems on access to work utilizing available data on economic 243
activities, socio-economic status, and other demographic variables at the household level or at the smallest 244
geographic level available before and after the BRT system. We utilize data from the 2004 and 2012 Lima 245
Metropolitan travel surveys [36, 38], which includes geo-referencing coordinates on the location of 246
surveyed household which allows the estimation of the distance of households to the nearest BRT station, 247
and the 2008 Economic Census from the National Institute of Statistics and Information (INEI, in its Spanish 248
Acronym), which contains information on 1.43 million jobs in Lima, distributed in over 358,000 (formal) 249
firms.7 The travel survey data includes detailed household surveys on household characteristics, travel 250
patterns, including stated travel times and monetary costs, employment status in 2004, before the BRT for 251
the Lima-Callao Metropolitan area, and after the BRT began operating (July of 2010). Data from the 252
economic census enables a general analysis of the spatial distribution of the formal job market in Lima, 253
which will be used as a proxy for the distribution of the overall employment supply. Although data on 254
informal jobs locations is not available, it may serve as a proxy for informal activities, as the literature 255
suggests a high correlation between locations of informal activities and large clusters of formal 256
opportunities [37]. As job location information is available only for the year 2008, an analysis of the 257
evolution of the job market throughout Lima is not possible. Finally, we map the locations of opportunities 258
and services in the city relative to housing locations using geocoded data from the Lima’s Plan 259
Metropolitano para Lima y el Callao -PLAM- 2035. 260
4. Methodology 261
We use a three-step method to measure accessibility changes associated with the BRT investment in 262
Lima that includes the characterization of individuals and opportunities, and an estimation of potential 263
accessibility. To examine how the configuration of land use and transportation infrastructure in Lima 264
impact accessibility we conduct a spatial analysis of the coverage of employment as a percentage of the 265
total land use areas in the city within four catchment areas of BRT. Utilizing the 2008 economic census, we 266
produce a heatmap8 of the blocks with the higher concentration of jobs in Lima (400 jobs or more). Four 267
buffers were defined for this analysis to have a better understanding of land-use changes with increasing 268
distances from the mass transit lines. The defined distances are 500 meters (equivalent to approximately 5-269
10 minutes walking), and 1,500 meters (equivalent to 15-20 minutes walking). 270
Next, the impacts of the BRT on accessibility to employment for social and transport disadvantaged 271
groups compared to non-disadvantaged groups are estimated. Specifically, two approaches for the 272
estimation of location-based accessibility to employment are considered: distance decay function and 273
potential (gravity) accessibility. As the research is concerned with the evolution of accessibility to 274
7 According to INEI, the Economic Census only accounts for formally constituted firms. Databases of informal employment were not available at a representative scale for the city level.
employment attributable to the Metropolitano, indicators are estimated and compared between two years 275
(2004 and 2012) and between control and treatment groups. 276
Our accessibility measure is based upon an origin-based distance decay function, following the 277
approach suggested by Bocarejo & Oviedo [6]. This method considers the distance to jobs, weighted by the 278
attributes of a location -in this case measured in terms of their supply of opportunities-, and estimates the 279
potential accessibility to opportunities from a zone (i), to all other areas (j), considering that fewer or farther 280
opportunities are less attractive or more difficult to reach. We compare the measure in areas with and 281
without access to the Metropolitano and control for changes in travel patterns, economic growth, and 282
spatial re-configuration of opportunities by maintaining employment constant in the baseline year and 283
assessing only those trips for which there is information before and after implementation of the system. 284
Treatment areas are defined as areas within 1,000 m and 1,500 m, approximately 15-20 minutes walking 285
distance, of the BRT system.9 The accessibility indicator for public transit trips for a given area, where 286
accessibly increases in direct proportion to the number of opportunities and decays exponentially with 287
generalized travel costs to reach those opportunities, as follows: 288
= ∑ ( ∙ ) (1) 289
where is the total potential accessibility from travel analysis zone i using a given public transport mode, 290
m, to all other zones j; Oj represents the number of employment opportunities in each destination zone j, 291
and Cijm is the generalized travel cost between zones i and j for mode m, and βim is a calibration parameter 292
by origin zone and transport mode m. The term generalized travel costs, Cijm,, expressed in minutes, can be 293
decomposed as follows: 294
= + (2) 295
Where tijm is the reported travel time in minutes and cijm is reported monetary cost between i and j by 296
transport mode m in Peruvian New Soles (PNS); VOT is the estimated average value of time for commuting 297
trips in PNS per minute by socio-economic strata [40]. Monetary cost, , is divided by the value of time. 298
The accessibility impedance for mode m between each origin destination pair can be expressed as the ratio 299
of the total number of work trips between zones i and j by mode m to the total jobs in zone j as a function 300
of generalized travel costs: 301
/ = ( ∙ ) (3) 302
We estimate the βim parameters for the accessibility measure, equation (1) for each year (before and 303
after the BRT is implemented) in the treatment and control areas by regressing the log of accessibility 304
impedance as expressed by the left-hand side of equation (3), for work trips using public transit [41] on 305
generalized travel costs: 306
( / ) = − ∙ ( + ) + eij (4) 307
Employment opportunities (Oj) in each traffic analysis zone are held constant (in 2008) to control for 308
potential changes in the job market in Lima and the accessibility index is divided by population of the 309
origin zone to compare the relative difference in accessibility between different zones of the city or specific 310
social groups.10 Only data on trips for which there is information before and after implementation of the 311
system are used. Differences in estimates are compared among lower and higher socio-economic groups 312
before and after the system’s implementation. 313
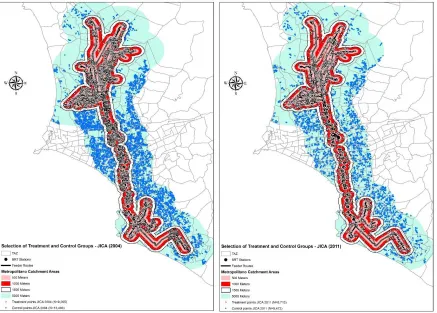
Treatment areas include all data points for the Japan International Cooperation Agency (JICA) 314
databases located between 0 and 1,000 meters from the Metropolitano trunk stations or feeder lines. We 315
assign to the control areas all data points in the travel survey (JICA) databases that fall between 1,500 and 316
5,000 meters from the BRT (Figure 1). Low Socioeconomic status (SES) areas in the data source are identified 317
by cross-referencing the geo-referenced data of the travel survey with the shapefile of socioeconomic strata 318
by census block from INEI. Low-SES are those households that fall within a census block with a stratum of 319
D or E. 320
The estimates of the impedance parameters are applied to the travel costs in the same origin-321
destination pairs for work trips by public transit in the JICA databases for 2004 and 2012 for treatment and 322
control group.11 Because of differences in the sample size for the JICA survey in both years, the number of 323
common origin-destination pairs available for the accessibility estimations is reduced in comparison with 324
the original sample used for the OLS regression used to estimate baseline accessibility parameters. The 325
effective sample of O-D pairs for the analysis was 6,585 O-D pairs for the treatment group and 3,257 O-D 326
pairs for the control group in both samples of 2004 and 2012. Sample sizes are considerably reduced when 327
segmenting by feeder and trunk catchment areas, rendering the samples sizes not sufficient for a reliable 328
regression, particularly in the control group. For treatment, the trunk and feeder samples are 4,610 and 329
1,976 O-D pairs respectively, while for the control group samples are 2,606 and 651 O-D pairs for trunk and 330
feeder areas, respectively. 331
Recall that the accessibility index is an exponential combination of travel costs and system demand, 332
and therefore cannot be scaled up linearly to project changes for a doubling of ridership. However, we 333
estimate a scenario where public transport trips between origin-destination pairs served by Metropolitano 334
in the database, with the assumption that riders within the area of influence of the system choose the BRT 335
over other forms of public transport was examined. 336
337
10 Normalized results provide better grounds for comparison as even comparatively large absolute numbers of potentially
accessible opportunities in relation to the rest of the city may be lower than the actual demand in such zone for activities such as working and studying, which can be an indicator of accessibility deficits.
338
Figure 1. Selection of treatment and control areas. Source: This study using JICA, 2007 OD survey data and 339
Protransporte, 2015. 340
More specially, to isolate the effects of the Metropolitano on travel conditions, we carried out an 341
additional analysis comparing only the O-D pairs in 2004 with those with trips involving Metropolitano in 342
2012. This comparison leads to an analysis of travel conditions to the same destinations, allowing us to 343
compare access characteristics between BRT users and non-users to the same opportunities. The number of 344
common origin-destination pairs available for the accessibility estimations in the Metropolitano-only 345
scenario is reduced to 224 O-D pairs for the treatment group and 154 O-D pairs for the control group. Travel 346
costs and times in Metropolitano between origins and destinations were replaced in trips covering the same 347
pairs by other forms of public transport. For instance, travel costs of trips in the treatment and control 348
groups closer to the feeder cones will incorporate the additional resources and time required to transfer 349
from feeder to trunk services. 350
5. Results 351
5.1 Employment Access 352
Figure 2 shows that most of the low-income population in the area of influence of the BRT are only 353
access to the system (Figure 2).12 Also notable is a consistent increase in poorer residents in areas far from 355
concentrations of productive land. 356
Figure 3 shows the distribution of employment in Lima and a heatmap of large job suppliers (400 jobs 357
or more) throughout the city. Most of the job supply in the city is provided by small businesses13 distributed 358
throughout the city, with larger employers (400 jobs or more) located in areas with high concentrations of 359
industrial land use and pockets of large businesses along some of the main transportation links in the city. 360
361
Figure 2. Percentage of low-income residents per Transport Analysis Zone (TAZ). Source: This study using data from 362
JICA and INEI (2007). 363
12 The population of Lima is divided into five strata by socioeconomic status as estimated by the Peruvian Association of Enterprises Market Investigation (also known by its Spanish acronym, APEIM), using household survey data from Peruvian National Household Survey (also known by its Spanish acronym ENAHO). In 2013, 7.6% of the population was classified as Stratum E (roughly half the share in 2007 of 16.4%), 30.3% Stratum D (compared with 34% in 2007), 38.4% Stratum C, 18.5% Stratum B, and 5.2% Stratum A. Some of the highest concentrations of population from Strata D and E are in the districts of Puente Piedra, Comas, and Carabayllo in the north; Villa El Salvador, Villa María del Triunfo, Lurín, and Pachacamác in the south; Ate and Lurigancho to the east; and Callao to the west. See http://www.apeim.com.pe/wp-content/themes/apeim/docs/nse/APEIM-NSE-2013.pdf
Over half (54%) of jobs are concentrated in middle to high-income areas, or middle to upper 364
socioeconomic status (strata B and C), while 19% are in areas characterized as lower income (stratum D), 365
25% in predominately extremely poor areas (stratum E), and 2% in wealthier areas (stratum A). 366
367
Figure 3. Distribution of employment in Lima & heatmap of businesses with higher job supply - Lima, 2008. 368
Source: This study using census data [41]. 369
The heatmap analysis of employment distribution in the city is consistent with the analysis of land use 370
in the city discussed above (See Figure 2 - right). The 1,500 m catchment area around the Metropolitano 371
network, which covers approximately 35 percent of total land surface area in Lima, encompasses many of 372
Lima’s employment hotspots, providing connectivity to nearly 80% of formal jobs in the INEI’s economic 373
census (2008) within 1,500 m of its trunk stations and feeder routes. The trunk-line stations alone cover 60% 374
of employment within the buffer. The close links between coverage of the BRT system and the main 375
employment clusters in Lima point towards potential positive effects in access to employment for public 376
transit users living near the system. This may also reinforce already consolidated high-value areas in the 377
city, contributing to centralization of economic opportunities and increase in land values around the BRT 378
stations. This analysis of the BRT’s impact on access to jobs has two limitations. As information is available 379
only for the year 2008, a detailed analysis of the evolution of the job market throughout Lima was not 380
possible for this paper. In addition, data on information that would enable the analysis of the skills and 381
training requirements for formal jobs within the system’s catchment and potential (mis-) matches with 382
skills and training of people in strata D and E was not available. 383
385
Figure 4 – Employment concentration in BRT catchment areas. Source: This study using census data [44]. 386
6. Accessibility Analysis Results 387
Table 1 shows summary statistics of work-related trips in public transit in 2004, six years prior to the 388
opening of the BRT line. Work trips within walking distance to the BRT (or the treatment area) are 389
characterized by lower average travel times but higher monetary costs in comparison with both the city’s 390
average and that of trips originating from the control areas, implying increased access (in terms of travel 391
times) to employment in the treatment group before implementation of the Metropolitano. However, 392
higher monetary costs may indicate an increased willingness to trade-off economic costs for shorter travel 393
times (i.e. higher value of time) and be related to the clustering of more formal jobs close to major 394
transportation infrastructure. 395
Table 1. Average travel costs and sample sizes for work trips in public transit - Lima, 2004. Source: This 396
study using JICA, 2004. 397
Sample Mean Travel time
(minutes)
SD Travel time (minutes)
Mean generalized
travel cost
(PNS*)
SD generalized
travel cost
(PNS)
N
(Origin-Destination
pairs)
City* 43.1 22.8 2.7 2.1 3,358
Control 42.1 21.3 2.7 2.5 1,447
Treatment 43.9 23.9 2.6 1.6 1,911
Calculations include all observations from the control group, treatment group and others. *Peruvian Nuevo Sol (PNS). 398
399
22% 24%
14%
5%
2% 2%
2% 3% 2%
0% 5% 10% 15% 20% 25% 30%
500 meters 500 meters - 1,000 meters1,000 meters - 1,500 meters
Percentage of jobs in Lima within the area of influence of the BRT
400
401
402
403
404
405
406
407
408
Figure 5. Fitted line: Accessibility index (ratio of jobs accessed to jobs available) as a function of generalized travel 409
costs (full sample model) – Lima, 2004. Source: This study using JICA, 2004. 410
The scatter plot of estimated accessibility index and generalized travel costs for each origin-destination 411
pair in the baseline year (2004) reveals a curve that is consistent with distance decay functions found in 412
previous studies on the subject [6, 44] \ (Figure 5). We next regress the ratio of job-related trips to total jobs on 413
the generalized travel cost for work trips by public transit in the baseline year as discussed above. The estimate 414
of the parameter (-1.025) on general travel cost is statistically significant at the 1% level (Figure 9 and Table 5 (t 415
= -183.8)).14 Moreover, the model estimate has high explanatory power (R2 = 0.72). 416
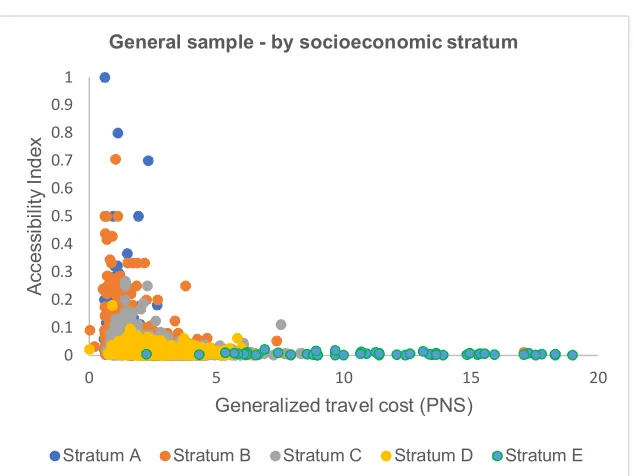
Baseline information for Lima is also used to identify general accessibility patterns by socioeconomic 417
stratum before the project. Strata D and E had higher generalized costs and lower accessibility indices, 418
while mid strata such as C had lower travel costs and comparatively higher accessibility indices (Figure 6). 419
Conversely, data points with higher values of accessibility correspond primarily to more well-off socio-420
economic groups, strata A and B. These observed accessibility indices show a consistent tendency with past 421
studies- that lower income groups tend to have higher travel expenditure and lower accessibility indices 422
[6, 40, 44]. 423
14 This initial estimation, although not used for the accessibility analysis between groups of analysis, is a relevant
424
Figure 6. Fitted line: Accessibility index (ratio of jobs accessed to jobs available) as a function of generalized travel 425
costs by socioeconomic stratum (full sample model) – Lima, 2004. Source: This study using JICA, 2005. 426
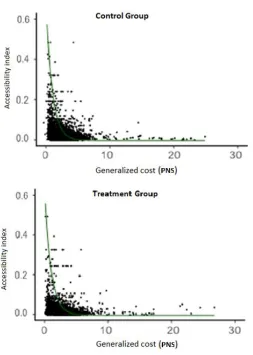
Comparisons of the estimates of accessibility curves by treatment and control groups show a steeper 427
curve in the control group and thus more rapid changes in accessibility with smaller changes in travel costs 428
(Figure 7). The two groups show a similar distribution of travel costs and observed ratios of jobs accessed 429
to jobs offered at different destination zones, with slightly higher mean generalized travel costs in the 430
treatment group (8% higher) and no significantly different accessibility indices.15 431
15 The general trends observable in both groups are consistent with the patterns observed in the aggregated sample
and the literature.
0 0.1 0.2 0.3 0.4 0.5 0.6 0.7 0.8 0.9 1
0 5 10 15 20
A
c
c
e
s
si
b
il
it
y
I
n
d
e
x
Generalized travel cost (PNS) General sample - by socioeconomic stratum
432
Figure 7. Observed accessibility index (ratio of jobs accessed to jobs available) as a function of generalized travel costs 433
by groups of interest – Lima, 2004. Source: This study using JICA, 2004. 434
Table 2. Estimation results for the accessibility index impedance parameter (generalized travel cost) – samples by 435
groups of interest model (2004). 436
Standard Error
t Value N Adjusted
R-Squared
Accessibility index (full sample) -1.025 0.006 -184 13,250 0.720
Accessibility index (control) -1.014 0.009 -120 3,257 0.684
Accessibility index (treatment) -0.979 0.010 -92 6,568 0.720
Note: The accessibility index is the ratio of jobs accessed to jobs available. Source: This study using JICA, 437
2004. 438
The impedance parameters for treatment and control groups differ by 4%, showing a marginally higher 439
negative effect of changes in the generalized cost of travel in the control group. This is coherent with 440
previous studies that suggest better-off areas tend to have a lower marginal response to changes in travel 441
Tables 3 to 4 show tests of differences in mean travel costs and time between income levels and year 443
for the control and treatment groups for work trips. Work trips via public transit in the treatment area in 444
the year 2004, prior to the BRT line opening, were slightly shorter but more expensive in comparison with 445
those originating from the control area. The share of users of the Metropolitano in the sample is 446
comparatively low compared with other public transit alternatives in the year of the survey. According to 447
the JICA survey for 2012 the BRT accounted only for 3.6% of trips in public transport and 2.7% of all trips 448
in the city, however, since the treatment and control groups are much closer to the area of influence of the 449
BRT, the percentage of trips in Metropolitano is comparatively higher in the study sample. In the treatment 450
group, out of the total number of work trips by public transit, over 9% involve the Metropolitano in at least 451
one stage of the trip, while in the control group only 5% of work trips involve the BRT in combination with 452
other forms of public transport. 453
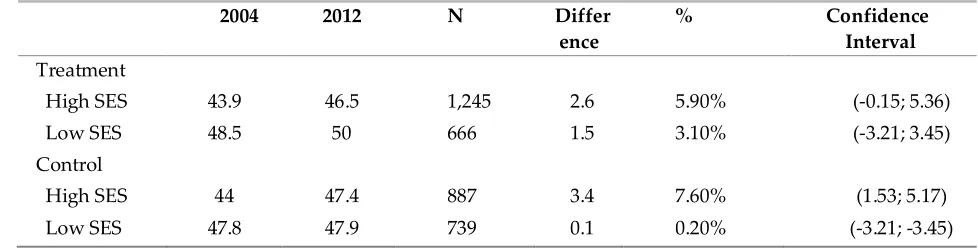
Increases in travel costs and times are observed in both the treatment and control areas. Most of the 454
increase is related to increases in the economic costs between 2004 and 2012. Travel times increased slightly, 455
but insignificantly for lower income groups, and more markedly amongst the higher income group. The 456
marginal changes in reported travel times in the JICA survey of 2012 compared to those in 2004 suggest 457
there have not been significant changes in travel conditions by public transport (Table 5). In addition, 458
statistically significant differences are only detectable amongst the higher-income group. Increases in traffic 459
and other network-related variables not measured in this study may have dampened gains in travel time 460
associated with the introduction of the Metropolitano. This is likely compounded by the small percentage 461
of the demand being served by the system in 2012, as mentioned above. 462
Table 3. Differences in mean travel times (minutes) between socioeconomic groups for treatment and control. 463
2004 2012 N Differ
ence
% Confidence
Interval Treatment
High SES 43.9 46.5 1,245 2.6 5.90% (-0.15; 5.36)
Low SES 48.5 50 666 1.5 3.10% (-3.21; 3.45)
Control
High SES 44 47.4 887 3.4 7.60% (1.53; 5.17)
Low SES 47.8 47.9 739 0.1 0.20% (-3.21; -3.45)
Source: This study using JICA, 2004 and 2012. 464
After the introduction of the Metropolitano, the largest percentage increase in monetary costs amongst 465
those in the treatment area were incurred by higher income public transport users. Reported costs increased 466
by 0.71 PNS, or 27% in 2012 relative to 2004 for this group. In comparison, higher income transit users in 467
the control group saw a rise of 8% in monetary expenditures. In contrast, monetary expenditures for work 468
trips in public transit for the low-income treatment groups increased, but considerably less in percentage 469
terms, than among those in the control area, or by 14%, while low-income public transit users in the control 470
areas experienced much larger percentage increases in travel costs.16 471
472
Table 4. Differences in mean monetary costs (2004 PNS) of travel by socioeconomic groups and treatment and control. 473
2004 2012 N Difference % Confidence
Interval
P-value
Treatment
High SES 2.59 3.30 1,245 0.71 27.4% (0.53; 0.89) 0.00
Low SES 3.12 3.55 666 0.43 13.9% (0.03; 0.84) 0.03
Control
High SES 2.86 3.11 887 0.25 8.8% (0.57; 0.81) 0.00
Low SES 2.86 3.60 739 0.74 26.2% (0.28; 1.21) 0.00
Source: This study using JICA 2004 and 2012. 474
This could be attributable to the fare structure of the Metropolitano compared to other forms of public 475
transport in Lima. The Metropolitano has a higher fare for the trunk services than other forms of public 476
transport, although the integrated fare when using the feeder routes in combination with the trunk, is 477
comparatively cheaper than two or more transfers in traditional public transit. In addition, the introduction 478
of the system led to some the restructuring of some public transport routes, which may have led some 479
lower-income users of traditional public transport to require more transfers for longer trips, hence 480
increasing the travel costs, particularly for those in the control areas where public transit services charge 481
by trip distance.17 482
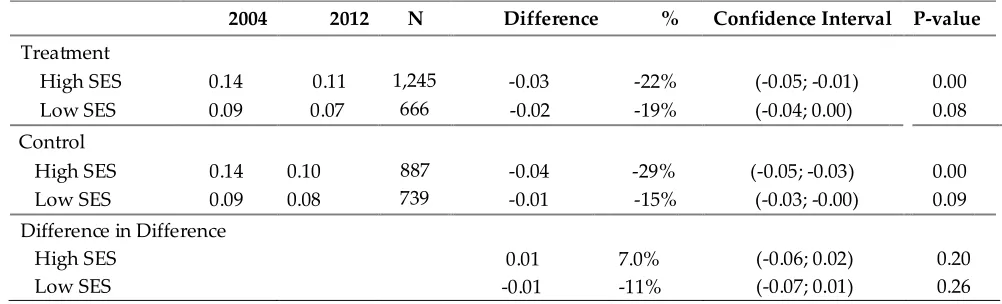
Table 5. Differences in mean accessibility indices by socioeconomic and treatment and control groups. 483
2004 2012 N Difference % Confidence Interval P-value
Treatment
High SES 0.14 0.11 1,245 -0.03 -22% (-0.05; -0.01) 0.00
Low SES 0.09 0.07 666 -0.02 -19% (-0.04; 0.00) 0.08
Control
High SES 0.14 0.10 887 -0.04 -29% (-0.05; -0.03) 0.00
Low SES 0.09 0.08 739 -0.01 -15% (-0.03; -0.00) 0.09
Difference in Difference
High SES 0.01 7.0% (-0.06; 0.02) 0.20
Low SES -0.01 -11% (-0.07; 0.01) 0.26
Source: This study using data from JICA, 2004 and 2012. 484
As shown in Table 5, between 2004 to 2012, baseline accessibility indices are highly similar in the 485
treatment and control groups. The accessibility indices decreased in both the treatment and control areas 486
and for both SES groups over the study period. The high-SES subgroup experienced a larger and 487
statistically significant decrease in accessibility overall compared to lower SES populations, however, it 488
declined substantially less, 22 percent, in the treatment area than in the control, where it declined by 29 489
percent. Overall, the BRT appears to have counteracted declines in accessibility among higher SES transit 490
users living within 1 km of the system. 491
The combined effect of both longer and more expensive work trips in 2012 in comparison with the 492
baseline leads to a decrease in potential accessibility to jobs in both the treatment and control areas and for 493
both SES groups. The changes in accessibility can be attributed primarily to increases in monetary travel 494
costs; travel time in the two periods of analysis increased only slightly, while monetary travel costs 495
increased more dramatically (Table 6). The t-tests of differences in mean accessibility indices show that 496
higher SES transit users in the control group experience the highest accessibility losses (29%); in 497
comparison, accessibility declined by 22 percent for the same SES group in the treatment group. In contrast, 498
in the lower SES groups in the control area experience the lowest loss of accessibility of 15%, while in the 499
treatment area, accessibility declined even more significantly, by 19%. 500
The analysis of differences in differences within SES sub-groups suggests a positive effect of the 501
Metropolitano in potential accessibility in the higher SES group. Relative to the control group accessibility 502
increased in the 1 km boundary area of the BRT by 0.01, a 7% increase relative to the treatment baseline 503
accessibility index. In other words, while accessibility declined, it declined seven percent less so in the area 504
of the BRT area of influence. In contrast, in the lower-SES group, the double difference is -0.01, an 11% 505
decrease relative to the baseline accessibility index (0.09).18 However, as shown in Table 6, these results are 506
not statistically significant. 507
Examining the changes in travel time in the treatment versus control groups among lower SES 508
commuters, the results appear to be driven by larger increases in travel times in the treatment area versus 509
the control areas. Increases in travel times for the poor within the treatment area could be related to lower 510
BRT ridership among the poor as found in a prior study [48]. Longer travel times could also be related to 511
the restructuring of traditional bus operators in the area of influence of the system. Such restructuring of 512
routes of the traditional transit operators could imply longer travel times for the same trips. In addition, 513
since the tariff was not yet integrated at the time of the survey, it would be more expensive for a lower SES 514
rider coming from the periphery to a feeder and trunk trip, relative to a trip on a traditional public transit 515
mode, potentially discouraging low SES riders from using the system and a continued reliance on 516
competing modes. Moreover, as the coverage of the system has higher coverage for the Transport Analysis 517
Zones -TAZ- characterized as primarily middle class (strata C) and above, it provides connectivity to 518
employment hotspots, and has higher tariffs that can be better-absorbed by populations with higher 519
purchasing power. 520
Despite overall increases in travel expenditure, the results imply better accessibility for higher SES 521
TAZs in the treatment zones than for those of poorer strata in the same group, calling into question the 522
contribution of the Metropolitano to the mobility and inclusion of the poor at the time of the survey. 523
Although these results should be taken with caution as at the time of the survey the system had not yet 524
reached its projected ridership levels, had fewer feeders and trunkline buses in operation than planned, 525
and had a tariff structure that made the feeder system considerably more expensive, than it is today. 526
The results suggest changes in travel conditions for the groups in the area of influence of the 527
Metropolitano did not have a positive effect on accessibility compared to the baseline year, at least in 2012. 528
18 It should be noted that statistical power is higher for the higher income sub-groups, as they represent a larger percentage
These results are influenced not only by the changes in travel attributes, but the elasticities of different SES 529
groups to changes in both time and cost. The use of generalized travel costs also reflects the value of time 530
for different sociodemographic groups, which influences accessibility. Both the aggregated and 531
disaggregated accessibility estimations reflect variations in socioeconomic characteristics and therefore in 532
the value of time. In general, households living in areas closer to the trunk line of the Metropolitano near 533
the city center tend to be of higher socio-economic stratum. Higher SES travelers tend to have less tolerance 534
for longer travel times and higher willingness to pay economically to reduce travel duration, compared to 535
lower-SES groups, and therefore, are usually more likely to benefit more directly from investments in mass 536
transit systems, where speed and efficiency are relevant design features. However, in the case of the Lima 537
BRT, these benefits seem to be outweighed by the increase in costs and travel times associated with the rise 538
in congestion and waiting times for other modes. 539
These findings can also be partly explained by a limited share of the transport demand under study 540
served by the BRT system. As ridership was less than half of what was projected and half the ridership in 541
2016 (over 600,000 per day), in the initial stages of the system’s operation, the Metropolitano seems to have 542
played a palliative rather than transformative role in reducing the travel costs to work of transit users 543
within its area of influence. However, it is important to note that the 2012 survey period may be too early 544
to detect the full impacts.19 545
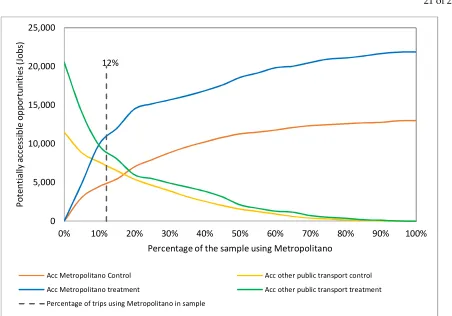
Figure 9 shows the ratio of total accessibility in 2012 as a function of changes in the percentage of trips 546
to work served by the Metropolitano and the total accessibility in a scenario where 100% of the trips are 547
served by other forms of public transit. As shown below, the combined accessibility gains when 10% of the 548
demand in the treatment area use BRT and 90% use other public transit are marginally higher than the total 549
accessibility in a scenario where collective transit serves all the travel demand of destinations covered by 550
the Metropolitano. In the control area, this is only achieved after replacing travel attributes of 30% the 551
demand of other public transport with the features of the BRT. With a 60% substitution in demand, the 552
accessibility in the treatment group would be 10% higher than the accessibility in the baseline scenario. The 553
additional distance to the system and more limited coverage in the control area may explain these trends 554
as higher costs of accessing the BRT produce loses in accessibility compared with other transit alternatives. 555
Nevertheless, considering the increase in travel costs between 2005 and 2012, and the results observed in 556
Figure 13, even marginal gains in accessibility in this scenario have a positive effect in comparison to the 557
control group (assuming that all transit users in this group used other public transit options). 558
559
19 Metropolitano ridership was 404,202 validations a day in mid-2012, two thirds of the expected ridership that was
560
Figure 8. Potential accessibility for users of public transit Vs. percentage of trips in BRT, 2012 (Metropolitano only 561
sub-sample). Source: This study using OD survey data from JICA 2004 and 2012. 562
Results reflect that despite that accessibility in the control groups is 86% of the level of accessibility in 563
2004 under a scenario of 100% substitution, this would still be nearly 7% higher than the accessibility if 564
users continued traveling only by other forms of public transit. This is a relevant finding in terms of policy 565
and planning of the system, as it supports the need to increase ridership and transit supply, and to provide 566
incentives for substitution of trips in traditional forms of transit for trips in the BRT, particularly for those 567
trips directed to destinations in the area of influence of the system. However, the limitations of these 568
benefits are circumscribed to specific areas of the city and, as shown in the employment and land-use 569
analysis, specific types of opportunities. 570
12%
0 5,000 10,000 15,000 20,000 25,000
0% 10% 20% 30% 40% 50% 60% 70% 80% 90% 100%
P
o
te
n
ti
al
ly
a
cc
essi
b
le
o
p
p
o
rt
u
n
it
ie
s
(Jo
b
s)
Percentage of the sample using Metropolitano
Acc Metropolitano Control Acc other public transport control
Acc Metropolitano treatment Acc other public transport treatment
571
Figure 9. Potential accessibility ratio Vs. percentage of trips in BRT, 2012 (Metropolitano only sub-sample) Source: This 572
study using JICA (2012) and Peruvian Economic Census Data (2008). 573
7. Discussion and Conclusions 574
Our analysis explores the underlying components of accessibility to employment related to the 575
development of Lima’s Metropolitano system from a social inclusion perspective. In relation to land use 576
and coverage of opportunities, the findings suggest that the Metropolitano achieved positive impacts with 577
respect to the physical coverage and improvements in travel conditions within its area of influence. One of 578
the main considerations in transport policy from a social perspective is the issue of affordability, which our 579
results suggest worsened over time for those in the area of influence of the system, affecting particularly 580
low-SES groups. Lack of an integrated fare policy in 2012, the post-Metropolitano year of analysis is likely 581
to have an effect on the results as travel costs reflect the additional economic burden of full-fare transfers, 582
reducing availability of disposable income and limiting the ability of the poor to afford travel to non-583
income-generating opportunities, shortening the path to social exclusion. 584
The layout of the Metropolitano network was planned to serve one of the highest demand corridors 585
of the city, and as such, naturally coincides with the areas of higher concentration of formal opportunities 586
and economically productive land uses in the city. Thus, it increases the connectivity of already high-value 587
areas in the city. The system provides an extended coverage of the city from north to south, despite having 588
only one trunk line, which is aligned with a significant share of formal job opportunities in the city. 589
While this may be beneficial for those with access to the system, the limited coverage of the 590
Metropolitano in zones with high concentrations of poor and extreme poor populations restricts most of 591
its connectivity benefits to middle and higher-SES residents closer to the BRT infrastructure. Nevertheless, 592
Lima’s BRT line has one of the longest feeder networks in the region, increasing considerably the coverage 593
of the system in areas otherwise served only by paratransit modes, with variable fares and no physical or 594 0.85 0.9 0.95 1 1.05 1.1 1.15 P o te n ti al a cc es si b ili ty r a ti o 2 0 12 x%/ 10 0% M e tr o p o lit an o
% of trips in Metropolitano
Potential accessibility ratio Vs. % of trips in Metropolitano
Baseline = 100% of trips in other public transit
fare integration. The comparison between potential accessibility analysis for both the total demand for 595
work trips by public transit and the Metropolitano only scenario shows the contribution the system makes 596
to improving travel conditions throughout its area of influence. Lower SES users, who tend to make longer 597
trips may benefit from the reductions in travel times (of over 23%). However, the number of low-SES users 598
that can benefit from making those trips seems to represent only a limited share of the demand. 599
The reduced coverage in comparison to other areas in the city in the lowest socio-economic areas is a 600
significant constraint for achieving wider social inclusion. In addition, the marked division between the 601
degree of accessibility provided by the BRT and traditional public transport in the city suggests a 602
disadvantage in travel conditions for users of traditional transit. Such disadvantage is reflected by the 603
aggregated accessibility analysis within constraints of limited ridership at the time of collection of the data. 604
Given the low-ridership, reflected by the JICA 2012 database, the Metropolitano seems to have played 605
the role of stemming the tide of an otherwise generalized increase in travel costs for work trips by public 606
transport. This suggests the need for increased integration between mass transit other forms of public 607
transport to extend benefits in travel time reductions to other destinations in the city. Examples of 608
integrated fare collection and complementary operational designs incorporating mass and collective 609
transport systems in the region such as Bogotá, Santiago, and Cali have shown that increasing coverage 610
can be compatible with a reduction in transfer costs and commuting fares. In the case of Lima, consideration 611
should also be given to differentiated fares for those of lower income in peripheral areas of the city that 612
enable better access at more affordable prices. Recent examples in the literature suggest that alleviating 613
travel costs for longer trips for the poor can enable better physical access a higher disposable income for 614
low-SES users. 615
Our accessibility analysis reflects the potential access to formal job opportunities without considering 616
skills matching. This is an important limitation of the study that although restrict scaling up and cross-617
sectorial policies for improving access to employment, reflect a spatial and social segregation that produces 618
economic exclusion for those worse-off. Considering the land-use patterns and concentration of formal 619
employment around the Metropolitano, as well as the high number of productive housing, actual job 620
accessibility benefits may be limited to those in higher SES brackets. However, due to limited data on jobs, 621
the effect of the BRT on firm creation and location of employment centers could not be analyzed within the 622
scope of this paper. 623
Future research should consider how the BRT systems may affect firm, and thus job locations and the 624
potential role for complementary land-use strategies that support accessibility of opportunities with 625
various skills requirements in lower-SES areas, particularly those not yet covered by the mass transit 626
system. In particular, the integration of transit infrastructure with the formal-informal continuum 627
observable in housing, transport supply and employment in Lima needs to become a policy priority in 628
relation to enabling asset accumulation and access to income-generating opportunities. Creation of 629
dedicated and quality spaces around the stations for informal commerce, relocation of informal activities 630
and incentives for small firm’s development in proximity to the BRT in line with the concept of TOD are 631
relatively low-cost actions that can increase the social and economic benefits of the infrastructure 632
investments already in place. 633
In this line, the scaling up of the potential benefits of the Metropolitano for accessibility requires not 634
only transport-related interventions, but also integrated policies in the land-use and employment sectors 635
accessible after the implementation of the system. From a policy perspective, it is necessary to acknowledge 637
the social value of investments such as BRT and their integration with the structure of the city and socially 638
differentiated needs. If access to efficient transit is approached as a social policy, it may be possible to devise 639
new forms for improving access to the system supported by results such as the ones in the Metropolitano-640


![Figure 4 – Employment concentration in BRT catchment areas. Source: This study using census data [44]](https://thumb-us.123doks.com/thumbv2/123dok_us/8062330.1343838/13.595.131.463.91.303/figure-employment-concentration-catchment-areas-source-study-census.webp)