pISSN 2320-1770 | eISSN 2320-1789
Original Research Article
A study to evaluate the causes of stillbirths according to the
ReCoDe classification
Bharti Choudhary Parihar*, Abhilasha Goyal
INTRODUCTION
Stillbirths are the largest contributor to perinatal mortality. Most of the studies on pregnancy outcomes, maternal mortality rates and stillbirths in India are hospital based and do not reflect the true picture of the situations in the community.
Foetal death has been defined by WHO as the death of the conceptus before complete expulsion or extraction
from its mother, irrespective of the gestational age.1
In India, a stillbirth is defined as the birth of a new born after twenty eight completed weeks of gestation weighing 1000 grams or more, with baby showing no sign of life after delivery as indicated by the absence of breathing, heart beats, pulsation of the umbilical cord or definitive movement of voluntary muscles. Such death includes
both antepartum and intra-partum death.2,3
There are intensified demands on medical, political and epidemiological grounds for proper determination and classification of cause of perinatal death. The largest
ABSTRACT
Background: Foetal death or stillbirth is a major obstetrical complication and a devastating experience for the pregnant patients and relatives. Worldwide an estimate of at least 3.2 million stillbirths occurs each year. There are intensified demands on medical, political and epidemiological ground for proper determination and classification of causes of perinatal death. The aim of this study was to test a new classification system- Re. Co. De. Classification (Relevant Condition at Death) for stillbirths to improve our understanding of the main causes and conditions associated with foetal deaths.
Methods: This study was a hospital based Prospective study conducted in department of obstetrics and Gynaecology, SZH, Bhopal. The study included 463 women who were admitted with Intra Uterine Foetal Demise. All cases were evaluated and after delivery the stillborn baby, the placenta and cord were examined. The causes were classified according to Re. Co. De. System.
Results: The analysis of the new classification system Re. Co. De. Allowed attributable causes to about 90.72% of causes of still births explained where 9.28% were unexplained. The commonest cause was found to be class F4-Toxaemia of pregnancy (13.17%) followed by class A7- IUGR (10.58%), class C1-Abruptio placentae (10.36%), class E3-Obstructed labour (9.8%) and class A1- Lethal congenital malformations (8.42%).
Conclusions: The Re. Co. De. Classification system gives us a better understanding of antecedents of stillbirths and the clinical practices, which need to be addressed to reduce perinatal mortality and have a better obstetric result in the next pregnancy.
Keywords: Intrauterine growth restriction, Perinatal mortality, Pre-eclampsia, Relevant condition at death, Stillbirth Department of Obstetrics and Gynecology, Gandhi Medical College and Sultania Zanana Hospital, Bhopal,
Madhya Pradesh, India
Received: 07 March 2017
Accepted: 14 March 2017
*Correspondence:
Dr.Bharti choudhary Parihar,
E-mail: [email protected]
Copyright: © the author(s), publisher and licensee Medip Academy. This is an open-access article distributed under the terms of the Creative Commons Attribution Non-Commercial License, which permits unrestricted non-commercial use, distribution, and reproduction in any medium, provided the original work is properly cited.
subgroup of perinatal mortality worldwide is the stillbirth
group consisting of intrauterine foetal deaths.
Classification of IUFD is complex due to the complicated pathophysiological processes encountered in the mother, foetus and placenta and as a result of their interaction. The multiplicity of contributing factors and the different background of the clinicians involved, adds to the complexity.
Our goal for this study is to investigate underlying cause of death for an IUFD group based on a new classification system, Re. Co. De classification (Relevant Condition at Death) after evaluation of clinical and diagnostic information. This classification system, given by Gardosi et al in 2005, helps us in understanding better the various
causes of stillbirths in 85% cases.4 The Re. Co. De
system gives us a better understanding of antecedent of stillbirths and the clinical practice which needs to be addressed to reduce perinatal mortality and have a better obstetric result in next pregnancy.
METHODS
The present study was a hospital based prospective observational study done in the department of obstetrics and gynaecology, Gandhi Medical College, Sultania Zanana Hospital, Bhopal, Madhya Pradesh, India from 1st September 2012 to 31st August 2013.
The study was done after approval from the institutional ethical committee.
Inclusion criteria
All pregnant females with IUFD diagnosed antepartum or intrapartum after 28 weeks of gestation or birth weight more than 1000 grams.
Exclusion criteria
[image:2.595.52.547.429.494.2]Pregnant females less than 28 weeks of gestation with IUFD or birth weight less than 1000 grams. The study included 463 women who were admitted with intrauterine deaths. A detailed history was taken including the age, parity, body mass index, booking status, socio-economic status, and obstetric history, history of present illness and personal history regarding any drug intake or any medical or surgical illness. Following a general, systemic and obstetric examination, the women were subjected to the following investigations; Haemoglobin, Blood grouping and Cross matching, Blood Urea and Sugar, Urine routine & microscopy, Coagulation Profile. After delivery, the stillborn baby, the placenta and the cord were examined for the following abnormalities. Lastly the cause found for each stillbirth was classified according to the Re. Co. De classification. Women were then counselled accordingly for their future pregnancy.
Table 1: Abnormalities.
Baby Cord Placenta and membranes Amniotic fluid
Congenital malformations Prolapse Weight Meconium
Maceration Entanglement Meconium Blood
Anaemia Haematomas Oedema Volume
Plethoric or not Number of vessels Infarcts
RESULTS
The total number of deliveries between 1st September
2012 to 31st August 2013 in Sultania Zanana Hospital,
Bhopal was 10,397. Out of these, 463 were still births and hence the stillbirth rate in our hospital was found to be 44.5 per thousand live births.
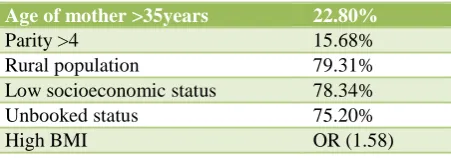
Table 2: Demographic profile.
Age of mother >35years 22.80%
Parity >4 15.68%
Rural population 79.31%
Low socioeconomic status 78.34%
Unbooked status 75.20%
High BMI OR (1.58)
Maximum numbers of stillbirths were found in age group of 19-35 years, as maximum number of women attending
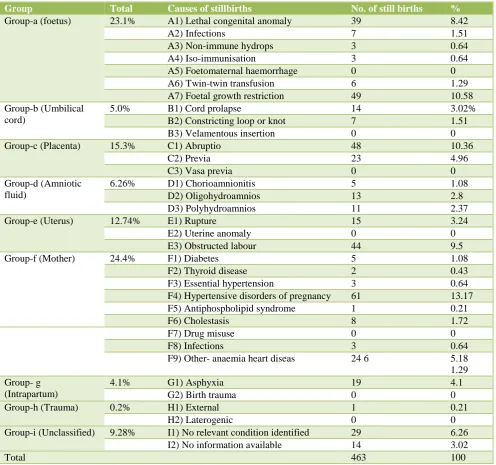
[image:2.595.55.281.642.721.2]Table 3: Classification of etiological factors according to Re. Co. De. Classification.
Group Total Causes of stillbirths No. of still births %
Group-a (foetus) 23.1% A1) Lethal congenital anomaly 39 8.42
A2) Infections 7 1.51
A3) Non-immune hydrops 3 0.64
A4) Iso-immunisation 3 0.64
A5) Foetomaternal haemorrhage 0 0
A6) Twin-twin transfusion 6 1.29
A7) Foetal growth restriction 49 10.58
Group-b (Umbilical cord)
5.0% B1) Cord prolapse 14 3.02%
B2) Constricting loop or knot 7 1.51
B3) Velamentous insertion 0 0
Group-c (Placenta) 15.3% C1) Abruptio 48 10.36
C2) Previa 23 4.96
C3) Vasa previa 0 0
Group-d (Amniotic fluid)
6.26% D1) Chorioamnionitis 5 1.08
D2) Oligohydroamnios 13 2.8
D3) Polyhydroamnios 11 2.37
Group-e (Uterus) 12.74% E1) Rupture 15 3.24
E2) Uterine anomaly 0 0
E3) Obstructed labour 44 9.5
Group-f (Mother) 24.4% F1) Diabetes 5 1.08
F2) Thyroid disease 2 0.43
F3) Essential hypertension 3 0.64
F4) Hypertensive disorders of pregnancy 61 13.17
F5) Antiphospholipid syndrome 1 0.21
F6) Cholestasis 8 1.72
F7) Drug misuse 0 0
F8) Infections 3 0.64
F9) Other- anaemia heart diseas 24 6 5.18
1.29 Group- g
(Intrapartum)
4.1% G1) Asphyxia 19 4.1
G2) Birth trauma 0 0
Group-h (Trauma) 0.2% H1) External 1 0.21
H2) Laterogenic 0 0
Group-i (Unclassified) 9.28% I1) No relevant condition identified 29 6.26
I2) No information available 14 3.02
Total 463 100
The analysis of still births occurring over a period of one year according to Re. Co. De. Classification showed that 90.72% of cases of SB could be assigned a relevant condition, leaving only 9.28% as unclassified or unexplained. According to this classification, the highest number of SB in this study were attributed to Group-F: Mother (24.4%) followed by Group A: Foetus (23.1%), Group-C: Placenta (15.3%), Group-E: Uterus (12.74%), Group-I: Unclassified (9.28%), Group-D: Amniotic fluid (6.26%), Group-B: Umbilical cord (5%), Group-G: Intrapartum (4.1%) and lastly, Group-H: Trauma (0.21%). The largest category of SB belonged to class F4: Hypertensive disorders of pregnancy (13.17%) followed by class A7: Foetal growth restriction (10.58%), class C1: Abruptio placenta (10.36%), class E3: Obstructed labour
(9.5%) and class A1: Lethal congenital anomaly (8.42%). Information on classification of a secondary condition was available only in 86 cases (18.57%). A wide spread of secondary conditions can be observed for several of the primary classifications. In particular, this analysis showed that some proportion of congenital anomalies were also growth restricted. Among the primary foetal growth restriction group (A7), the most common secondary codes
were maternal hypertension, placental abruption,
Table 4: Etiological factors according to primary and secondary conditions of the Re. Co. De. Classification. Secondary conditions Primary conditions No of s tillb irt h prima ry co nd it io n F et a l g ro wt h r estr ict io n
Abruptio Pre
v ia O lig o hy dra mn io s P o ly hd ra mn io s Dia bet es E ss e ntia l h y nert ens io n H y pert ens iv e in p re g g na ncy Anemia Asp hy x ia Group –A Foetus
A1) Lethal congenital anomaly 39 11 1 4
A2) Infections 7 2
A3) Non-immune hydrops 3
A4) Iso-immunisation 3
A5) Foetomaternal haemorrhage 0
A6) Twin-Twin transfusion 6 2 2 3
A7) Foetal growth restriction 49 7 1 2 1 23 4 3
Group-B Umbilical cord
B1) Prolapse 14
B2) Constricting loop or knot 7 2
B3)Velamentous insertion 0
Group-C Placenta
C1) Abruptio 48 9 4
C2) Previa 23
C3) Vasa previa 0
Group-D Amniotic fluid
D1) Chorioamnionitis 5
D2) Oligohydroamnios 13 2
D3) Polyhydroamnios 11 1
Group-E Uterus
E1) Rupture 15
E2) Uterine anomaly 0
E3) Obstructed labour 44
Group-F Mother
F1) Diabetes 5
F2) Thyroid disease 2
F3) Essential hypertension 3
F4) Hypertensive disorders of pregnancy 61 12
F5) Antiphospholipid syndrome 1
F6) Cholestasis 8
F7) Drug misuse 0
F8) Infections 3
F9) Other- Anaemia 24
Group-G Intrapartum
G1) Asphyxia 19
G2) Birth trauma 0
Group -H Trauma
H1) External 1
H2) Iaterogenic 0
Group-I Unclassified
I1) No relevant condition identified 29
I2) No information available 14
Total 463
In present study, 50.96% of SB belonged to gestational age group of 28-36 weeks. This indicates that preterm deliveries have more adverse outcome than term and post term deliveries.
resistance to withstand external environment due to their genetic makeup. About 62.41% of stillborn foetuses were fresh indicating the importance of intra natal factors.
Table 5: Foetal characteristics.
Table 6: Mode of delivery.
Mode of delivery Total stillbirths %
Vaginal delivery 381 82.29%
Caesarean delivery 61 14.47%
Laparotomy 15 3.24%
Total 463 100%
In present study, 82.29% stillbirths delivered vaginally. 14.47% stillbirths were delivered by caesarean section and rest 3% underwent laparotomy for rupture uterus. Caesarean sections were done for indications like obstructed labour, transverse lie, CPD, Placenta Previa etc. Of those delivered vaginally, cephalo-centesis was done in 12 cases and breech extraction was done in 5 cases.
DISCUSSION
The stillbirth rate in our hospital was found to be 44.5%. It is much higher than the stillbirth rate of 26 reported by a multicentric study of ICMR (5). The National Family Health Survey (6) has reported still birth rate of 23 per 1000 for India. The reason of such high stillbirth rate in our hospital is probably our status as a tertiary care referral centre draining the large urban slum and rural population.
In our study, the maximum numbers of SB were in maternal age group >35years. In the study by Reddy et al the relationship of maternal age with stillbirth risk was calculated in approximately 5000 gestations. The risk in women >35 years was found to be 1.32 folds greater than in the younger women. Another study done by Saha et al also concluded that advance maternal age is considered to have more adverse pregnancy outcomes as compared to
the younger age groups.7,8
On analysis, our results found a connection between high BMI and stillbirths. In a study done by Stephansson et al, this association was investigated. They found that maternal overweight and raised BMI increased the risk of
antepartum SB.9
In our study, maximum numbers of SBs were associated with multiparous women (52%) and in grandmultipara (15.68%). In another study done by Vaishali KN et al
2010 the percentage of stillbirths occurring in multipara
women was found out to be 51.16%.10 In this study,
women from rural area were more likely to be associated with stillbirth than those from urban area. It may be due to lack of facilities providing antenatal care or emergency obstetric care and lack of awareness for antenatal checkup. Abdel Latif ME et al, 2008 found that patients living in rural areas are at disadvantages in accessing
tertiary health care.11
The analysis of stillbirths occurring over a period of one year according to the Re. Co. De. Classification showed that 90.72% cases of stillbirths could be assigned a relevant condition, leaving only 9.28% as unclassified or unexplained. Classification of stillbirths in West Midlands by Jason Gardosi et al revealed that 15% of stillbirths were left unclassified by the Re. Co. De. Classification and on the same data, the conventional Wigglesworth classification left 66% of stillbirths
unexplained.4
According to the Re. Co. De. Classification, the highest number of stillbirths in this study were attributed to Group F-Mother (24.4%) followed by Group A-Foetus (23.1%), Group C-Placenta (15.3%), Group E-Uterus (12.74%), Group I-Unclassified (9.28%), Group D-Amniotic fluid (6.26%), Group B-Umbilical cord (5%), Group G-Intrapartum (4.1%) and lastly, Group H-Trauma (0.21%).
The largest category of stillbirths belonged to class F4-Hypertensive disorders in pregnancy (13.17%), followed by class A7- Foetal growth restriction (10.58%), class C1-Abruptio placenta (10.36%), class E3-Obstructed labour (9.8%) and class A1- Lethal congenital anomaly (8.42%).
In this study, the maternal causes of stillbirths formed 24.4% of all SBs. Of these, hypertensive disorders formed the largest group (13.17%) followed by severe anaemia (5.18%), cholestasis (1.72%), diabetes (1.08%) and other maternal diseases. In the study conducted by Bhattacharya S et al (2010), the maternal causes were present in 14.13% whereas in the study by Korde- Nayak N et al (2009), 20.9% stillbirths were attributable to
maternal causes.10,12
In a study by Villar et al in a WHO antenatal care trial, analysis of 39,615 pregnancies, they found that foetal death was slightly higher in pre-eclampsia i.e. 2.2% in
comparison to gestational hypertension i.e. 1.4%.13
Severe anaemia as a cause of SB was present in 5.68% of our women. This figure is quite low in comparison to a study done in sub-saharan Africa by John W et al 2009, where 63% SBs were attributable to anaemia in mothers. According to a study done by Singh A. et al, severe anaemia was the cause of stillbirths in 6.89% of women,
which is comparable to the results found in our study.14,15
Gestational age (< 36 weeks) 50.96%
Foetal weight (< 2.5kgs) 69.11%
Sex variation (male) 56.34%
Among the foetal causes (23.1%), foetal growth restriction forms the largest group (10.58%) and lethal congenital anomaly forms the largest group (8.42%), with infective causes (1.51%), twin-to-twin transfusion (1.29%). Of the 7 infective causes of stillbirths, there were 3 TORCH, 2 HIV and 2 chicken pox. The most common congenital anomaly was open neural tube defects in which Hydrocephalus was the commonest followed by Anencephaly.
Jason Gardosi et al (4) found foetal causes of stillbirths in 64.3% cases, with maximum numbers among being attributed to foetal growth restriction (43%) and lethal congenital anomaly (14.95%).
Wapner et al 2012 found a very high percentage i.e. 25%
of stillbirths caused by congenital malformations.16
In present study, placental causes formed15.3% of all stillbirths, consisting of abruptio placenta (10.36%) and placenta previa (4.96%).
Jason Gardosi et al found 8.95% placental causes in his study. In a study by Robert M. Silver et al, placental diseases were the leading cause of ante partum
stillbirths.14,17
In this study, the uterine causes of stillbirths formed 12.74% of all stillbirths. Of these, about 3/4th was because of obstructed labour and the rest 1/4th were because of rupture uterus. This is comparable to study conducted by Bhattacharya et al 2010 in which uterine
causes formed 11.38% of all stillbirths.12
In our study, about 51% of SBs belonged to the gestational age 28-36 weeks. Similar results were found in the study conducted by Saha et al (8) 2000 where about 70% stillbirths were preterm.
Birth weight was also one of the influential factors for unfavorable outcome. For birth weight, 1-1.5 kg, SB rate in our study was 26.72%, whereas for birth weight 2.5-2.9 kg, it was reduced to 9.48%. Savvas et al 2004 also found a strong relationship between SBs and small for gestational age. They found half the stillborn were <10th
percentile for weight.18
In our study, about 52% of stillborn babies were males and rest 48% were females. Chan A and S O Ogunniyi 2004 conducted a study on still born in New Zealand and found that the outcome in female babies, in terms of perinatal mortality and first week survival rates, was
generally better than their male counterparts.19
In the present study, 62% of stillborn babies were fresh indicating the importance of intranatal factors of stillbirths. A population based study in rural Pakistan in 2002 with a stillbirth rate of 47/1000, 75% were fresh stillbirths which are similar to our study. The occurrence of an intrapartum stillbirth in developed country is
considered the result of inadequate care whereas in developing country it may represent inadequate access to
essential obstetric care and inadequate care.20
CONCLUSION
Still births contribute significantly to perinatal loss. It is important to evaluate stillbirths and to identify the preventable causes for future pregnancy. The available classification systems either depend on extensive
investigations or leave two-third of stillbirths
unexplained.
Re. Co. De. Classification is a clinically based classification system appropriate for a developing country like India, where minimal investigations are done. We found unexplained stillbirths in 9.28% women only.
Every hospital should audit their stillbirths and identify the preventable causes. Classification of stillbirths will give them a chance for recognizing the need for a close surveillance of women in future.
Funding: No funding sources Conflict of interest: None declared
Ethical approval: The study was approved by the Institutional Ethics Committee
REFERENCES
1. World Health Organisation. International Statistical
Classification of Diseases and Related Health Problems. 10th revision. Geneva: WHO. 1993
2. Stanton C, Lawn JE, Rahman H,
Wilczynska-Ktetnde K, Hill K. Stillbirth rates: delivering estimates in 190 countries. Lancet. 2006;367:1487-94.
3. Fretts RC, Boyed ME, Usher RH, Usher HA. The
changing pattern of fetal death. 1991-2013.Obstet Gynaecol. 2013;79:35-39.
4. Gardosi J, Kady SM, McGeown P, Francis A, Tonks
A. Classification of stillbirth by relevant condition at death (ReCoDe): population based cohort study. Bmj. 2005;331(7525):1113-7.
5. Bhatia BD, Mathur NB, Chaturvedi B, Dubey AP.
Neonatal mortality pattern in rural based medical college hospital. Indian J Pediatr. 2004;51:309-12.
6. Butler NR, Bound JP, Spector WG. Classification
and causes of perinatal mortality. British medical Journal. 1996;2(5003):1191-6.
7. Reddy U, KO CW, Willinger M. Maternal age and
the risk of stillbirth throughout pregnancy in the united states. AJOG. 2006;195;764-70.
8. Sahu M, Agrawal A, Das V. Advanced maternal age
and obstetric outcome. J Obstet Gynaecol.
2007;57:320-3.
9. Stephansson O, Dickman P, Johansson A. Maternal
10. Nayak VN, Gaikwad R. Causes of stillbirths. J Obstet Gynaecol India. 2008;58(4).
11. Abdel ME, Latif, Bajuk B, J Oei, Vincent T, Sutton
L and Lui K. Does rural or urban residence make a difference to neonatal outcome in premature birth? A regional study in Australia Arch Dis Child Fetal Neonatal Ed. 2006;91(4):251-56.
12. Bhattacharya S, Mukhopadhyay G, Mistry PK, Pati
S, Saha SP. Stillbirth in a tertiary care referral hospital in north Bengal-A review of causes, risk factors and prevention strategies. Online Journal of Health and Allied Sciences. 2011;9(4).
13. Vilar J, Carroli G, Wojdyla D. Preeclampsia,
gestational hypertension and intrauterine growth restriction related to independent conditions. AJOG. 2006;194: 921-31.
14. Watson-Jones D, Weiss HA, Changalucha JM, Todd
J, Gumodoka B, Bulmer J, et al. Adverse birth outcomes in United Republic of Tanzania: impact and prevention of maternal risk factors. Bulletin of the World Health Organization. 2007;85(1):9-18.
15. Singh A, Alpana T, Re.Co. De.; A better
classification for determination of still births. The
Journal of Obstetrics and Gynaecology of India. 2011;61(6):656-58.
16. Wapner RJ, Lewis D. Genetics and metabolic causes
of stillbirths. Semin Perinato. 2002;26:70-4.
17. Robert M, Silver . Causes of death among stillbirths.
JAMA. 2011;306(22):2459-68.
18. Savvas E, Evangelos A. Case control study of factors
associated with intrauterine foetal deaths. Med Gen Med. 2004;6-53.
19. Chan A, King JF, Flenady V, Haslam RH, Tudehope
DI. Classification of perinatal deaths, Development of the Australian and New Zealand classifications. J Paediatric Child Health. 2004;40(7);340-7.
20. Korejo R, Bhutta S, Noorani KJ, Bhutta ZA. An
audit and trend of perinatal mortality at the Jinnah Postgraduates Medical Centre, Karachi. J Pak Med Assoc. 2007;57:168 -7.