Finger Vein Authentication Using Biometric Graph Method
Mrs. D.DEEPIKA ; Mr. A.KRISHNA KUMAR ; Ms. K.SWETHA REDDY ; Mr. K.SHIVA ADITHYA
Assistant Professor Dept. of Computer Science, Mahatmagandhi Institute Of Technology Assistant Professor Dept. of Ece Chaithanya Bharathi Institute Of Technology
3-4 B.Tech, H. T. No: 14261A0588 Dept. of Computer Science, Mahatma Gandhi Institute Of Technology
E-mail:[email protected] ; E-mail:[email protected] ABSTRACT:
The main objective of this mini project is to find out how well the biometric graph matching method for authentication of finger vein biometrics works. Finger vein recognition is a method of biometric
authentication that uses pattern-recognition
techniques based on images of human finger vein patterns beneath the skin's surface. Finger vein recognition is one of many forms of biometrics used to identify individuals and verify their identity. Finger Vein ID is a biometric authentication system that matches the vascular pattern in an individual's finger to previously obtained data. Blood vessel patterns are unique to each individual, as are other biometric data such as fingerprints or the patterns of the iris. Unlike some biometric systems, blood vessel patterns are almost impossible to counterfeit because they are located beneath the skin's surface.
The basic principle of biometric graph matching authentication technique is when the finger vein image captured from an infrared camera undergoes several image processing steps to be represented as a graph. The graph captured and the graph present in the database is aligned for matching the edges of the graphs. The amount of matched edge pairs are a measure for the similarity of the graphs. At the end of the project we would be able to answer the following.
1. Is the biometric graph matching method a suitable method for comparing finger vascular patterns, given that we use the best performing existing vein vessel network
extraction method?
2. How can we improve the performance of our
implementation of the biometric graph
matching method?
3. How can we make the biometric graph matching method more specific to finger vein authentication in order to improve the recognition performance?
INTRODUCTION TO FINGER VEIN BIOMETRICS
Finger vein ID is a biometric authentication system that matches the vascular pattern in an individual's finger to previously obtained data. Hitachi developed and patented a finger vein ID system in 2005. The technology is currently in use or development for a wide variety of applications, including credit card authentication, automobile security, employee time and attendance tracking, computer and network authentication, end point security and ATM machines.
person so it is more difficult to fool unlike the complex iris systems, high decision faux facial styles or false recordings.
1.2 INTRODUCTION TO BIOMETRIC GRAPH MATCHING TECHNIQUE
In modern day many users of electronic equipment store sensitive information on their computers. To ensure privacy of this information, a need for biometric security systems, for example finger print comparison and iris comparison, has risen. In a biometric comparison two samples are examined to see similarity score, on which we can perform a threshold to determine whether or not the two samples are from the same instance.
The past few years finger print authentication has become very popular for unlocking devices like computers and mobile phones. However, since copying fingerprints has proven to be possible, the need for a more secure non-invasive system for personal identification has risen. With vascular finger vein pattern recognition we aim to develop a more secure, yet reliable alternative for biometric authentication solutions like finger print comparison.
Finger vein pattern comparison for authentication has several potential advantages. Finger veins are internal features of the finger, so they will be harder to copy than external features. Also we can perform liveliness detection. Previous research has shown several methods have been developed and succeeded in obtaining error rates below 1%. We decided to investigate the biometric graph matching (BGM) method, which has been developed for retina vein images where EERs(equal error rates) of 0.5%. The BGM method is a structure based method which does not look at the vein image as an image, but actually looks at the structure of the veins.
2. FINGER VEIN BIOMETRICS
2.1
METHOD
HOW THE HITACHI SYSTEM WORKS?
To obtain the pattern for the database record, an individual inserts a finger into an attester terminal containing a near-infrared LED (light- emitting diode) light and a monochrome CCD(charge-coupled device) camera.
The hemoglobin in the blood absorbs near-infrared LED light, which makes the vein system appear as a dark pattern of lines.
The camera records the image and the raw data is digitized, certified and sent to a database of registered images.
For authentication purposes, the finger is scanned as before and the data is sent to the database of registered images for comparison. The authentication process takes less than two seconds.
Fig 2 steps in which finger vein images are
stored
2.2
HOW
IS
FINGER-VEIN
RECOGNITION IS BETTER.
● Finger vein patterns are unique to each individual, even among identical twins. The false acceptance rate is very low (close to zero).
● Placing a hand or finger is less intrusive compared to other biometric technologies.
● Because veins are located inside the body, it is extremely difficult to read or steal. There is little risk of forgery or theft.
● Finger veins do not leave any trace during the authentication process and so cannot be duplicated.
● Finger vein patterns remain relatively constant through the adult years so that re-enrollment of the vein pattern will not be required once enrolled.
● Finger veins are less likely to be influenced by changes in the weather or physical condition of the individual.
3.
AUTHENTICATION
USING
BIOMETRIC
GRAPH
MATCHING
TECHNIQUE
3.1 METHOD
Biometric graph matching is a method for matching two graphs to determine whether it’s from the same instance or not. It is a vein vessel network-based method that uses graphs to represent the structure of the vein vessel networks. The different image samples might vary due to noise, rotation, translation, scaling, illumination or other
Factors, so called capture imperfections. This leads to noisy spatial graphs. This means graphs that are
similar but not exactly the same. The BGM method was chosen as it is an error- and noise tolerant matching algorithm.
Fig 3 flow of authentication process
Firstly a skeleton of the veins must be extracted. This is then converted into a graph. After this the biometric graph matching is performed, which gives a similarity score. This similarity score is a measure for how similar the graphs are. These steps will now be explained in more detail.
1) Skeleton creation
2) Graph creation
3) Graph alignment and matching
3.1.1 SKELETON CREATION
enhancement taking place to enhance contrast of the given image. An example of this can be found in Figure below. Now the image is enhanced in such a way that the vessels are more clearly visible, the skeleton extraction takes place.
Fig 4: finger vein image before and after enhancement
Fig 5: flow to convert from vein image to skeleton image
The skeleton has termination points (endpoints of edges), Y-splittings (bifurcations) and X-splittings (crossovers) (the latter two being two types of branch points). Termination point paths might be due to noise if they are small, and can be removed if their branches are smaller than a certain amount of pixels.
Fig 6: before and after removing small edges
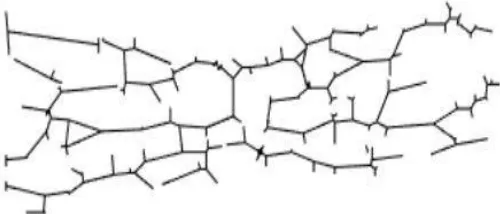
3.1.2 GRAPH CREATION
Once the skeleton is found, it is going to be represented as a more abstract graph, where small noisy fluctuations in edges are not relevant anymore.
Fig 7: steps to convert skeleton image to graph
The skeletons are converted to a graph by looking at the connected branch- and endpoints in the graph. In order to match two graphs, we need to define graphs in a uniform way. The graph representation is defined as:
g = (V,E,µ, v) (1)
In this V is our set of feature points (bifurcation-, end- and branch points) and E is the set of connected pairs of vertices, which form an edge (so which points are connected by a edge). Bifurcation points are a special type of branch points, specifically where 1 vein splits to two veins. µ : V → R 2 maps each vertex (point in a graph) v to the corresponding Cartesian coordinates (q1,q2) (this is
feature points has a length l and a slope θ.
Fig 8: A finger vein graph
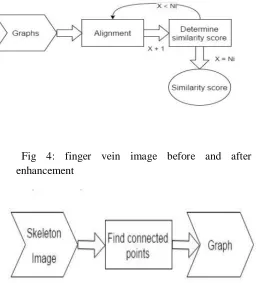
The different image samples might vary due to noise, rotation, translation, illumination or other factors, so called capture imperfections. This leads to noisy spatial graphs. This means graphs that are similar but not exactly the same. The Biometric Graph Matching algorithm is a noisy spatial graph matching technique involving 2 parts: graph alignment and error-tolerant graph matching. A schematic overview can be found in the below Figure. Two graphs are input, and will be aligned for the Ni best matching edge pairs.
Every time a similarity score is calculated, and the score representing the best matching will be our similarity score. We will briefly discuss the alignment and similarity score now.
Fig 9: calculation of similarity score from graph
3.1.3 GRAPH ALIGNMENT AND
MATCHING
Graph registration is done to ensure that both graphs are on same spatial frame, free from rotation and translation. Every pair of edges is scored using a dissimilarity score based on the edge labels (length and orientation are used, but not the exact location,
as this may be different due to the translation of the
graphs).
In which la and lb are the lengths of the respective edges in graph a and graph b and θa and θb are their respective angles. When the lengths are equal and the angles are equal, the square root will go to zero, giving a distance between the edges of 0.The distance is normalized for the length by dividing by the sum of the lengths. The angle difference is not weighted compared to the length difference, which is why we have doubts on how this distance measure will reflect the reality. Therefore we will later introduce a new dissimilarity score, which we will explain in subsection III-D.
With this dissimilarity score sab we aim to find most similar edge pairs, these are considered to give the best alignment of the graphs we want to compare. For each of these edge pairs, the compared graphs are translated and rotated to make these two edges lay horizontal, starting in the origin. The vertices of the translated and rotated graphs are compared using an Euclidean distance. If this distance is less than certain tolerance ε, we have a match. The number of matched edges ( C ) is used to calculate the similarity score (also called distance score)
Here dk is the similarity score between two graphs (0
being a total match, 1 being no match at all), C being the number of matching edges, amax and bmax being the
alignment of the graph. The minimum distance score that is found among these matches is used as the distance score between graphs. From all Ni possible rotations that are tested, the one with smallest distance score is kept and used.
Once the similarity scores are calculated for all genuine matches and the impostor matches, we can threshold the
Distance scores. If the score is below the threshold value we decide that we have a match. With this we can find the equal error rate.
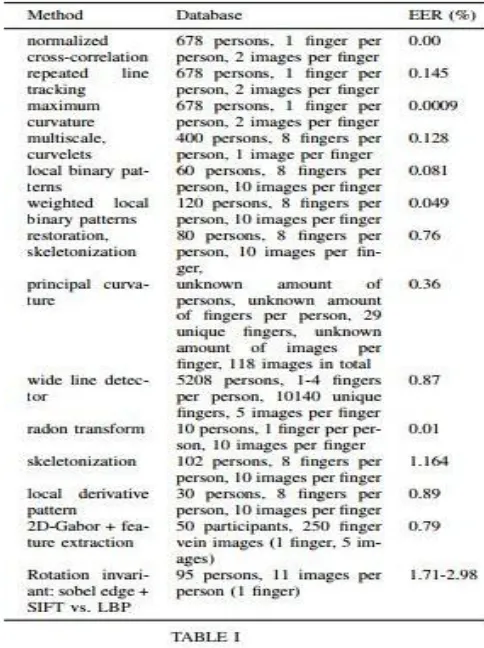
3.2 RELATED WORK
In the past research has been done on finger vein images using several methods. It is important to be able to compare our results with the results of other research. In order to get an idea of the different results from recent research, a short summary of the results of a few papers is given in Table I.
Fig 10: table representing previous research using different authentication techniques
4. CONCLUSION
The conclusions drawn are-
● The biometric graph matching method in its original form is not well-suited for comparing finger vascular patterns.
● In order to improve the performance of the implementation, increasing the number of attempts for alignment could help. The new dissimilarity score helps to find the proper edge pairs for alignment earlier. Pruning the graphs also helps to obtain better results, as this removes some of the noise.
● To make the authentication more specific to finger veins did not work as intended.
suitable for finger vein graph matching due to the extremely noisy vein patterns when compared to retina or hand vein patterns. Compared to the state of the art work the system doesn’t perform well enough.
5. FUTURE WORK
As our system does not perform well enough due to the noisy nature of the graphs we get, the first thing that would need improvement is the graph extraction process. One could look into other vein vessel network extraction methods, or try to optimize one of the existing methods in order to get more detail and less noise.
Besides this it would be interesting to investigate a weight factor for the matched edges based on the width of the veins in the extracted vein vessel network image. In this way, big veins would become more important than smaller veins (that could also be noise). In this way the system may become more robust against noise.
6. REFERENCES
1. http://essay.utwente.nl/68187/1/Nibbelke_MA_EEM
CS.pdf
2. https://en.wikipedia.org/wiki/Finger_vein_recognitio n
3. J. Yang et al, Finger-vein network enhancement and segmentation, Pattern Analysis and Applications (2014) 17:783-797
4. H.C. Lee et al, Finger vein recognition using weighted local binary pattern code based on a support vector machine, Journal of Zhejiang University-SCIENCE C, (2010) 11(7) 514-524
5. H. Zhang et al, Finger Vein Recognition Based on Gabor Filter, Intelligence Science and Big Data
Engineering (Lecture Notes), (2013) pp. 827-834
6. https://www.bayometric.com/fingerprint-vs-finger-vein-biometric-authentication