ISSN(Online): 2320-9801
ISSN (Print) : 2320-9798
I
nternational
J
ournal of
I
nnovative
R
esearch in
C
omputer
and
C
ommunication
E
ngineering
(An ISO 3297: 2007 Certified Organization)
Vol. 4, Issue 3, March 2016
Improved I/O Performance Using Flexible
Data Analytics for Hadoop Heterogeneous
Environment
Shraddha Shrivastava, Anil PimplapureStudent, Department of CSE, Babulal Tarabai Institute of Research and Technology Sagar, MP, India
Head of Department, Department of CSE, Babulal Tarabai Institute of Research and Technology Sagar, MP, India
ABSTRACT: Now days, Big Data applications are very frequently used. The immense use of these HEC machines requires very quick I/O systems, processing and output generation. For such unprecedented quantity of data, the input output process plays a very crucial role. This paper attempts to provide a relatively faster I/O performing mechanism for HEC machines by combining the features of data compression and strategies of flexible placement of analytics.
KEYWORDS: Big Data, HEC Machines, Data Compression,Hadoop, MapReduce
I. INTRODUCTION
The word Big data describes unprecedently large mixture of structured, partially-structured or completely unstructured data that can be mined for useful information. The quantity of data is not specific; it may range from petabytes to Exabyte [1]. We can identify big data through 3Vs: Volume, Variety and Velocity. Volume describes the extreme size of data; Variety describes varied types of data; and Velocity describes the speed with which data must be processed.
To understand the voluminousity of big data consider the petabytes or Exabyte's of variedly structured data that consists of records of millions of people arising from different sources .These types of data are typically variedly structured data that is often inadequate and inaccessible[2]. The rate at which big data is been generated is alarming. Big data can be mined, stored, and graphically analyzed to help companies to gain useful insight to improve operations, get or retain customers, andincrease revenues. To extract valuable information from big data, we need sufficient processing power, analytics capable machines (HEC machines) and analytical skills [3][4].
In this paper, a model using data compression and strategies for flexible placement of analytics are combined to create a system with improved I/O performance on different HEC machines.The paper is organized as follows: Section 2 describes the detailed report about HEC machines, Data compression and the data analytics placement strategies. Section 3 describes the existing models, proposed structure of the system and its details. Section 4 describes the implementation of the proposed system, Section 5 presents the results and analysis them. Section 6 concludes the paper.
II. LITERATURE REVIEW
In order to study the proposed model, background information of high end computing machines, its data flow structure, the compression strategies and analytics placement strategies that are being used should be thoroughly studied. The details of the same are presented in the upcoming sections.
A. High End Computing Machines
ISSN(Online): 2320-9801
ISSN (Print) : 2320-9798
I
nternational
J
ournal of
I
nnovative
R
esearch in
C
omputer
and
C
ommunication
E
ngineering
(An ISO 3297: 2007 Certified Organization)
Vol. 4, Issue 3, March 2016
manufactures to handle the complexities of big data. They are called High end computing applications or simply HEC machines [5].
B. Data Compression
Data Compression [6] will reduce the size of data being input or output and decrease network usage of the big data application. Reduced data uses comparatively little bandwidth on the network than the uncompressed data. With compression more data can be saved in less space i.e. less storage is required. Big data comprises of complicated and variedly structured data. So reduction of this data is important. Co-dec stands for the sequential implementation of compression and decompression algorithms. Some compression formats can be split. Performance is better for large files if the algorithm can be split. Hadoop supports the following compression algorithms [7]:
• LZO: This compression algorithm is made up of many smaller blocks of compressed data that allows tasks to be split into blocks. Block size should be common for compression and decompression. This is quick and splittable.
• Gzip: It stands for GNU zip. Gzip [9] is based on the combination of features of LZ77 and Huffman Coding, It is commonly known as the DEFLATE algorithm. Gzip compresses better than LZO though it is relatively slower.
• Bzip2: bzip2 [8] is an open sourced data compressor which gives high-quality compression. It reduces the size of files to 10% to 15% of the original size. The performance of Bzip2 is asymmetric, as decompression is faster.
• LZ4: LZ4 is a speed based lossless data compression algorithm. Its compression speed is 400 MB/s per core with maximum speeds ranging to multiple GB/s per core.
Any suitable algorithm lossy or can be used as per convenience lossless for the compression of data.
C. Data Analysis Placement Strategies
When a request is generated by any kind of big data application, a huge amount of the requested data moves from storage towards the application and vice-versa. Migrating large amount of data leads to slower and inefficient network as it causes congestion, which deteriorates input/output performance. Hadoop MapReduce applications are capable to transfer processing operations instead of data i.e. analytics is transferred toward nodes that request data to be processed by the operations. To increase the I/O performance of High End Computing applications in Hadoop, we aim to reduce data movement between nodes. It can be achieved by a proposing an optimal data placement scheme that distributes analytics and runs it only on optimally selected places..
To explore the optimal places where analytics can be placed in the data flow path, four analytics placement strategies [10] are being introduced here.
Inline Processing: Inline processing is very easy to code and implement. Analysis and visualization routines are synchronously performed by the simulation in this strategy. ParaView [11] and VisIt [12] are examples of this kind of processing.
Helper-core Processing: Helper cores parallelly analyze and reduce data immediately after it is produced. The compressed data is prepared for the processing. Examples include Functional Partitioning [13] and Software Accelerator.
Dedicated-nodes processing: In this kind of processing, analytics is executed on staging nodes and active storage nodes.
Offline Processing: In this strategy, data is read back for analysis after it has been written to storage. Any one of the above four strategies or a balanced combination of two or more of these placement strategies can be selected and executed independently.
III. PROPOSED SYSTEM
ISSN(Online): 2320-9801
ISSN (Print) : 2320-9798
I
nternational
J
ournal of
I
nnovative
R
esearch in
C
omputer
and
C
ommunication
E
ngineering
(An ISO 3297: 2007 Certified Organization)
Vol. 4, Issue 3, March 2016
A. Compression Quantitative Model
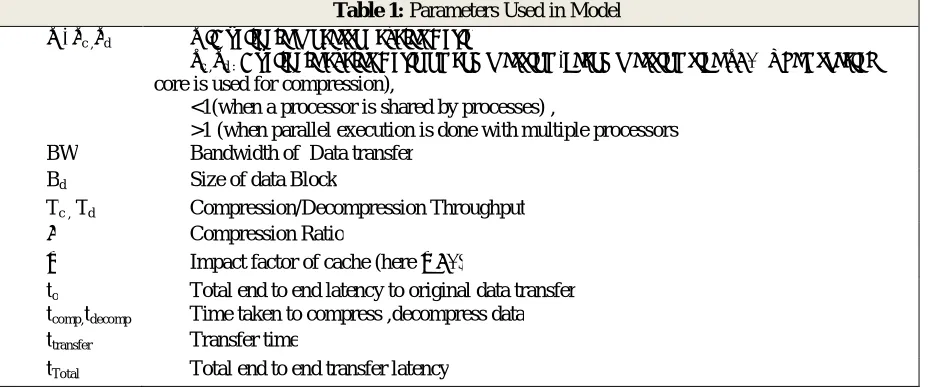
A specific set of performance and cost metrics are defined for compression quantitative model .This simple performance model is used to compare the different compression algorithms. Table 1 lists all the parameters used in the compression model.
Table 1: Parameters Used in Model
ρ , ρc ,ρd ρ :Available processor cycles Ratio
ρc ,ρd :Available cycles Ratio on compression ,decompression side ρ=1 (when special
core is used for compression),
<1(when a processor is shared by processes) ,
>1 (when parallel execution is done with multiple processors BW Bandwidth of Data transfer
Bd Size of data Block
Tc , Td Compression/Decompression Throughput
δ Compression Ratio
Ɛ Impact factor of cache (here Ɛ =1)
to Total end to end latency to original data transfer
tcomp,tdecomp Time taken to compress ,decompress data
ttransfer Transfer time
tTotal Total end to end transfer latency
The relations that are used to evaluate the cost of transfer of compressed data from sender to receiver are given below:
to = Bd/BW; (1)
The end-to-end original data transfer latency with available bandwidth BW is calculated using Eq. (1).
tcomp = Bd/(Tc ∗ ρ ∗ ε); (2)
tdecomp= Bd/(Td ∗ ρ ∗ ε); (3)
The compression and decompression time on sender and receiver respectively are calculated using Eq. (2) and Eq. (3).
ttransfer = (Bd∗ δ)/BW; (4)
The time required to transfer compressed data from sender to receiver is calculated usingEq.(4).
ttotal =tcomp +ttransfer +tdecomp (5)
The total cost is shown by Eq.(5).
Using these equations, the data transfer costs can be compared with/without compression under the selected compression algorithm.
B. End to End Latency Analysis
Analysis of end to end latency is exclusively used to find the resource cost of the analytics in all cases. This analysis varies for different analytics placement strategies.
For Inline compression, the data is transferred from computational nodes to the storage. It doesn’t include data decompression. Therefore,
ISSN(Online): 2320-9801
ISSN (Print) : 2320-9798
I
nternational
J
ournal of
I
nnovative
R
esearch in
C
omputer
and
C
ommunication
E
ngineering
(An ISO 3297: 2007 Certified Organization)
Vol. 4, Issue 3, March 2016
Tc∗ (1 −δ) ∗ ρ ∗ ε > BW; (6)
Here δ and Tc (compression ratio) are constants. Keeping ρ and BW in a definite proportion the improvement of
end-to-end latency can be evaluated.
C. Flex-analytics
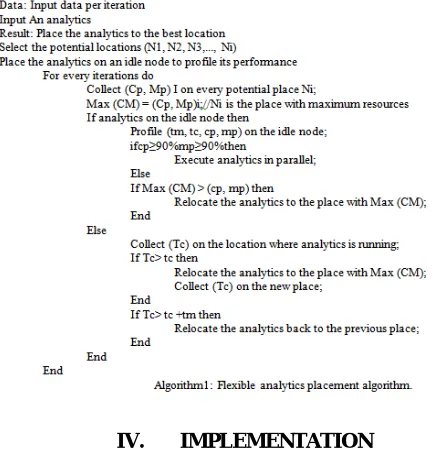
The algorithm aims at placing the analysis at the most optimal location so as to reduce the cost of data transfer subject to the availability of resources and performance penalties. The algorithm takes as input the potential locations, available resources at those locations and the performance profiles.
The flexible analytics placement algorithm [14] is performed in the placement policy engine.
IV. IMPLEMENTATION
To implement the system, a heterogeneous Hadoop cluster of 16 nodes was developed using a master slave environment. The master controls 16 nodes in the cluster. The slaves consists of RAM ranging from 1gb to 4 gb, use CPU Type ranging from Core 2 duo to I5, operating system as fedora operating with the networking bandwidth of 10 Mbps. All results are presented in the next section averaged at minimum 3 time run.
V. RESULTS AND ANALYSIS
ISSN(Online): 2320-9801
ISSN (Print) : 2320-9798
I
nternational
J
ournal of
I
nnovative
R
esearch in
C
omputer
and
C
ommunication
E
ngineering
(An ISO 3297: 2007 Certified Organization)
Vol. 4, Issue 3, March 2016
Figure 1/2: Data Transfer Bandwidth Without / With Staging
Figure 2: The compression service is deployed on the computational nodes in order to reduce the size of the data block. This experiment consists of two cases: simulation to staging and helper cores to staging which can both be referred as memory to memory transfers. This graph shows the experimentally tested bandwidth with/without compression. In this experiment, more than one data blocks are transferred from simulation to staging phase nodes. Hence decompression/compression is deployed on the computation and staging nodes separately.
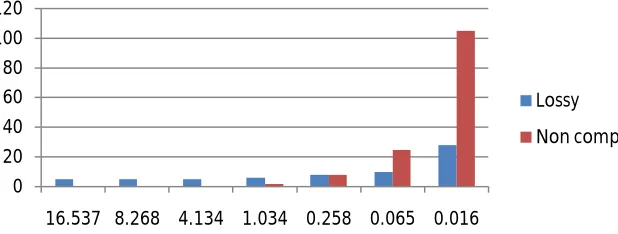
Figure 3:Transfer Latency Of Uncompressed Data Against Varying Bandwidth
Figure 3: To evaluate the behavior of the compression based model in real world cases, we measure the end to end latency on different available bandwidths. For this evaluation the decompression and compression has been exclusively tested on a single processor. The graph shows the results of the experiment, where the baseline marks the transfer latency of raw uncompressed data.
The results clearly specify the (de)compression time of lossless data compression comprises of more than 98% of end to end latency when transferring bandwidth is larger than1.034 Gb/s. On the other hand, for lossy compression it accounts for more than 95% of the same.
VI. CONCLUSION AND FUTURE WORK
This works deals with the enhancement of the input/output performance of big data applications using compression algorithms and staging of nodes. Different type of models was studied in the paper to explore the solution of the existing issue. The finally worked out model contains a balanced combination of data compression and flexible placement of analytics. Our future work may focus on the improvement of the factors like compression ratio, dynamic optimization of placement of analytics and availability of processors.
REFERENCES
1. Bakshi, K. ; Cisco Syst. Inc., Herndon, VA, USA ,Considerations for big data: Architecture and approach, Aerospace Conference, 2012 IEEE 2. Big Data, http://hmchen.shidler.hawaii.edu/Chen_big_data_MISQ_2012.pdf
3. The Concept,Characteristics and Application of Big Data,Ma Jian-guang,JIANG Wei
4. Big Data: A Survey,Min Chen, Shiwen Mao, Yunhao Liu; Springer, April 2014, Volume 19, Issue 2, pp 171-209 0
50 100 150 200
2 4 6 8
Lossy
Lossless
0 100 200 300 400 500
2 4 6 8
Lossy
Lossless
0 20 40 60 80 100 120
16.537 8.268 4.134 1.034 0.258 0.065 0.016
Lossy
ISSN(Online): 2320-9801
ISSN (Print) : 2320-9798
I
nternational
J
ournal of
I
nnovative
R
esearch in
C
omputer
and
C
ommunication
E
ngineering
(An ISO 3297: 2007 Certified Organization)
Vol. 4, Issue 3, March 2016
5. Scientific Applications Of High-End Computing,,chapter 4, ,Rupak Biswashttp://wtec.org/hec/report/04-Applications1.pdf 6. K. Sayood, Introduction to Data Compression, 3rd edition, Morgan Kaufmann, 2005.
7. D.A. Lelewer, D.S. Hirschberg, Data compression, in: Proc. ACM Computing Sur-veys(CSUR), 1987, pp.261–296. 8. High-quality data compressor, bzip2, http://www.bzip.org.
9. Compression utility, gzip, http://www.gzip.org.
10. F. Zheng, H. Zou, J. Cao, J. Dayal, T. Nugye, G. Eisenhauer, S. Klasky, FlexIO: location-flexible execution of in-situ data analytics for large scale scientific applications, in: Proc. IEEE International Parallel and Distributed Processing Symp. (IPDPS’13), 2013, pp.320–331.
11. N. Fabian, K. Moreland, et al., The ParaViewcoprocessing library: a scalable, general purpose in situ visualization library, in: Proc. IEEE Symp. on Large-Scale Data Analysis and Visualization (LDAV2011), 2011, pp.89–96.
12. ParaviewVisIt, OpenSource scientific visualization and graphical analysistool, 2012.
13. M. Lin, S.S. Vazhkudai, A.R. Butt, F. Meng, X. Ma, Y. Kim, C. Engelmann, G. Ship-man, Functional partitioning to optimize end-to-end performance on many-core architectures, in: Proc. ACM/IEEE Conference on Supercomputing (SC10), 2010, pp.1–12.
14. A Survey on I/O Performance in Big Data Applications, http://www.ijircce.com/upload/2015/october/146_47.pdf
BIOGRAPHY
Miss Shraddha Shrivastava is a student of Masters of Technology in the Computer Science and Engineering Department, B. T. Institute of Research and Technology, affiliated to Rajiv Gandhi ProdyogikiVishwavidhyalaya, Bhopal. She received Bachelors of Engineering (BE) degree in 2012 from RGPV Bhopal, India. Her research interests are Big Data, Data Mining, and Database Systems etc.