University of Windsor University of Windsor
Scholarship at UWindsor
Scholarship at UWindsor
Electronic Theses and Dissertations Theses, Dissertations, and Major Papers
12-20-2018
NOVEL METHODS FOR PERMANENT MAGNET
NOVEL METHODS FOR PERMANENT MAGNET
DEMAGNETIZATION DETECTION IN PERMANENT MAGNET
DEMAGNETIZATION DETECTION IN PERMANENT MAGNET
SYNCHRONOUS MACHINES
SYNCHRONOUS MACHINES
Min Zhu
University of Windsor
Follow this and additional works at: https://scholar.uwindsor.ca/etd
Recommended Citation Recommended Citation
Zhu, Min, "NOVEL METHODS FOR PERMANENT MAGNET DEMAGNETIZATION DETECTION IN
PERMANENT MAGNET SYNCHRONOUS MACHINES" (2018). Electronic Theses and Dissertations. 7610.
https://scholar.uwindsor.ca/etd/7610
This online database contains the full-text of PhD dissertations and Masters’ theses of University of Windsor students from 1954 forward. These documents are made available for personal study and research purposes only, in accordance with the Canadian Copyright Act and the Creative Commons license—CC BY-NC-ND (Attribution, Non-Commercial, No Derivative Works). Under this license, works must always be attributed to the copyright holder (original author), cannot be used for any commercial purposes, and may not be altered. Any other use would require the permission of the copyright holder. Students may inquire about withdrawing their dissertation and/or thesis from this database. For additional inquiries, please contact the repository administrator via email
NOVEL METHODS FOR PERMANENT MAGNET DEMAGNETIZATION DETECTION IN PERMANENT MAGNET SYNCHRONOUS MACHINES
By
Min Zhu
A Dissertation
Submitted to the Faculty of Graduate Studies
through the Department of Electrical & Computer Engineering in Partial Fulfillment of the Requirements for
the Degree of Doctor of Philosophy at the University of Windsor
Windsor, Ontario, Canada
2018
Novel Methods for Permanent Magnet Demagnetization Detection in Permanent Magnet Synchronous Machines
by
Min Zhu
APPROVED BY:
______________________________________________ S. Filizadeh, External Examiner
University of Manitoba
______________________________________________ G. Zhang
Department of Mechanical, Automotive & Materials Engineering
______________________________________________ E. Abdel-Raheem
Department of Electrical & Computer Engineering
______________________________________________ B. Balasingam
Department of Electrical & Computer Engineering
______________________________________________ N. C. Kar, Advisor
Department of Electrical & Computer Engineering
iii
DECLARATION OF CO-AUTHORSHIP / PREVIOUS PUBLICATIONS I hereby declare that this dissertation incorporates material that is result of joint research, as follows: This dissertation includes the outcome of publications co-authored with Dr. Wensong Hu, Dr. Guodong Feng and Dr. Narayan Kar from University of Windsor. In all cases, only primary contributions of the author towards these publications are included in this dissertation. The contribution of co-authors was primarily the guidance and assistance in experimentation, data analysis, and manuscript review and improvement.
I am aware of the University of Windsor Senate Policy on Authorship and I certify that I have properly acknowledged the contribution of other researchers on my dissertation and have obtained written permission from each of the co-author(s) to include the above material(s) in my dissertation. I certify that, with the above qualification, this dissertation, and the research to which it refers, is the product of my own work.
This dissertation includes selected sections and extended work of research conducted in four original papers that have been published in peer reviewed IEEE Transactions and international conferences, as follows:
Dissertation Chapters
Publication title /full citation
Publication status
Chapter 2
M. Zhu, W. Hu, and N. C. Kar, "Acoustic Noise Based Uniform Permanent Magnet Demagnetization Detection in Surface Mounted PMSM for High-Performance PMSM Drive," IEEE Transactions on Transportation Electrification, Vol. 4, Issue 1, pp. 303-313, 2018.
Published
Chapter 3
M. Zhu, W. Hu, and N. C. Kar, "Torque Ripple Based Interior Permanent Magnet Synchronous
iv
Current Regulation," IEEE Transactions on Industry Applications, Vol. 53, Issue 3, pp. 2795-2804, 2017.
Chapter 4
M. Zhu, W. Hu, G. Feng and N. C. Kar, "Vold-Kalman Filtering Order Tracking Based Rotor Flux Linkage Monitoring in PMSM ," in Proc. IEEE XXIIIrd International Conference on Electrical
Machines (ICEM'2018), Alexandroupoli-Greece, September 2018.
Under Revision
Chapter 5
M. Zhu, W. Hu, G. Feng and N. C. Kar, "Multi-Sensor Fusion-Based Permanent Magnet Demagnetization Detection in Permanent Magnet Synchronous Machines," IEEE Transactions on Magnetics, Vol. 54, Issue 11, 2018.
Published
I hereby certify that I have obtained a written permission from the copyright owners to include the above published materials in my dissertation. I certify that the above material describes work completed during my registration as graduate student at the University of Windsor. I certify for the materials that I am one of the co-authors, only sections with my contribution are included.
I certify that, to the best of my knowledge, my thesis does not infringe upon anyone’s copyright nor violate any proprietary rights and that any ideas, techniques, quotations, or any other material from the work of other people included in my thesis, published or otherwise, are fully acknowledged in accordance with the standard referencing practices. Furthermore, to the extent that I have included copyrighted material that surpasses the bounds of fair dealing within the meaning of the Canada Copyright Act, I certify that I have obtained a written permission from the copyright owner(s) to include such material(s) in my thesis and have included copies of such copyright clearances to my appendix.
v
vi
ABSTRACT
Monitoring and detecting PM flux linkage is important to maintain a stable permanent magnet synchronous motor (PMSM) operation. The key problems that need to be solved at this stage are to: 1) establish a demagnetization magnetic flux model that takes into account the influence of various nonlinear and complex factors to reveal the demagnetization mechanism; 2) explore the relationship between different factors and demagnetizing magnetic field, to detect the demagnetization in the early stage; and 3) propose post-demagnetization measures. This thesis investigates permanent magnet (PM) demagnetization detection for PMSM machines to achieve high-performance and reliable machine drive for practical industrial and consumer applications. In this thesis, theoretical analysis, numerical calculation as well as experimental investigations are carried out to systematically study the demagnetization detection mechanism and post-demagnetization measures for permanent magnet synchronous motors.
At first a flux based acoustic noise model is proposed to analyze online PM demagnetization detection by using a back propagation neural network (BPNN) with acoustic noise data. In this method, the PM demagnetization is detected by means of comparing the measured acoustic signal of PMSM with an acoustic signal library of seven acoustical indicators.
Then torque ripple is chosen for online PM demagnetization diagnosis by using continuous wavelet transforms (CWT) and Grey System Theory (GST). This model is able to reveal the relationship between torque variation and PM electromagnetic interferences. After demagnetization being detected, a current regulation strategy is proposed to minimize the torque ripples induced by PM demagnetization.
vii
monitoring through torque ripple again. VKF-OT is introduced to track the order of torque ripple of PMSM running in transient state.
Lastly, the combination of acoustic noise and torque is investigated for demagnetization detection by using multi-sensor information fusion to improve the system redundancy and accuracy. Bayesian network based multi-sensor information fusion is then proposed to detect the demagnetization ratio from the extracted features.
viii
DEDICATION
This dissertation is dedicated to my parents,
Ms. Daocui Wen and Mr. Zhenqiu Zhu,
my husband
Wensong Hu,
and my children
John James, and David
ix
ACKNOWLEDGEMENTS
First of all, my sincere thanks goes to my advisor, Dr. Narayan Kar, for providing me enthusiastic guidance, full support and many resources for my study and research in the past four years in the Ph.D. program. He inspired me with confidence, and encouraged me to be a leader in research. Dr. Kar is gracious to us as a friend and family; he takes care of us in more than our research.
My sincere thanks also goes to Dr. Esam Abdel-Raheem, Dr. Balakumar Balasingam, and Dr. Guoqing Zhang for agreeing to serve on my committee, attending my seminars and defense, and providing valuable suggestions so that I can improve the quality of this dissertation.
I am thankful to my lab colleagues and friends who have been of great support in my study, professional activities and life. My research group leader, Dr. Wensong Hu, has provided great technical guidance towards my research work and experimental investigations. Dr. Guodong Feng has given me valuable guidance on theoretical writing. Other fellow lab members, such as Dr. Chunyan Lai, in the Centre for Hybrid Research and Green Energy (CHARGE), have given me friendly support and help whenever needed.
x
TABLE OF CONTENTS
DECLARATION OF CO-AUTHORSHIP / PREVIOUS PUBLICATIONS ... iii
ABSTRACT ... vi
DEDICATION ... viii
ACKNOWLEDGEMENTS ... ix
LIST OF TABLES ... xiii
LIST OF FIGURES ... xiv
NOMENCLATURE ... xvi
CHAPTER 1 INTRODUCTION ... 1
1.1 Overview and Motivations ... 1
1.2 Permanent Magnet Synchronous Machine Demagnetization ... 6
1.2.1 Definition of PM Demagnetization ... 6
1.2.2 Factors Affecting PM Demagnetization ... 7
1.2.3 PMSM Demagnetization Effects ... 9
1.3 Literature Review ... 10
1.3.1 Permanent Magnet Demagnetization Prevention Analysis ... 10
1.3.2 PM Demagnetization Monitoring and Detection Techniques ... 12
1.3.3 Machine Learning based PM Demagnetization Detecting Techniques ... 14
1.4 Research Objectives ... 16
1.5 Research Contributions ... 17
1.6 Dissertation Layout ... 18
CHAPTER 2 PERMANMENT MAGNET DEMAGNETIZATION DETECTION BASED ON ACOUSTIC NOISE ANALYSIS ... 20
2.1 Introduction... 20
2.2 Acoustic Noise Model Based on Flux Variation ... 21
2.3 Seven Acoustic Indicators for PM Demagnetization Prognosis ... 25
2.3.1 Pre-process Acoustic Noise Measurement from PMSM ... 25
xi
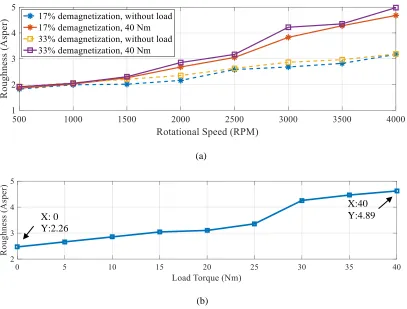
2.3.3 The Roughness of Acoustic Noise under Demagnetization ... 30
2.3.4 The Fluctuation Strength of Noise under Demagnetization ... 31
2.3.5 The Articulation Index of Noise under Demagnetization ... 32
2.3.6 The FFT Index of Noise under Demagnetization ... 34
2.3.7 Hilbert-Huang Analysis of Noise under Demagnetization ... 35
2.3.8 The Noise PSD Spectrum of Demagnetized PMSM ... 36
2.4 BPNN Based PM Demagnetization Detection ... 37
2.5 BPNN Based PM Demagnetization Detection ... 40
2.6 Conclusions ... 45
CHAPTER 3 TORQUE RIPPLE BASED INTERIOR PERMANENT MAGNET SYNCHRONOUS MACHINE ROTOR DEMAGNETIZATION FAULT DETECTION AND CURRENT REGULATION ... 46
3.1 Introductions ... 46
3.2 PMSM Torque Ripple Model Based on PM Flux ... 47
3.3 Proposed PMSM Demagnetization Prognosis ... 48
3.3.1 Proposed Torque Ripple Measurement Processing ... 49
3.3.2 Grey System Theory for Demagnetization Fault Diagnosis and Current Regulation ... 55
3.4 Experimental Verification for Torque Ripple Based PM Demagnetization Detection ... 57
3.4.1 Hardware Platform and Control System ... 57
3.4.2 Experimental Validation on IPMSM with Partial Demagnetization Fault ... 58
3.5 Current Regulation under Demagnetization ... 66
3.6 Conclusion ... 68
CHAPTER 4 VOLD-KALMAN FILTERING ORDER TRACKING BASED ROTOR FLUX LINKAGE MONITORING IN PMSM ... 70
4.1 Introduction... 70
4.2 PMSM Torque Ripple Model ... 71
4.3 Order Tracking for PM Flux Linkage Monitoring ... 72
4.4 Experimental Validation for Flux Linkage Monitoring ... 75
4.4.1 Flux Linkage Variation Monitoring Platform Setup ... 75
xii
4.4.3 Validation on Flux Linkage Variation with VKF-OT ... 77
4.4.4 Feature Indicator Extraction using VKF Order Tracking ... 78
4.5 PMSM Flux Linkage Estimation by Using DBN ... 82
4.6 Conclusion ... 85
CHAPTER 5 MULTI–SENSOR FUSION BASED PERMANENT MAGNET DEMAGNETIZATION DETECTION IN PERMANENT MAGNET SYNCHRONOUS MACHINES ... 86
5.1 Introduction... 86
5.2 Analysis of Relationship among Rotor Flux Density and Torque Ripple and Acoustic Noise ... 87
5.3 Multi-sensor Information Fusion Based Demagnetization Detection... 89
5.3.1 Torque and Acoustic Noise Signal Pre–process ... 89
5.3.2 Feature Value Extraction ... 91
5.3.3 Eigenvector Size Reduction for Multi–Sensor Signals ... 92
5.3.4 Bayesian Network Based Multi–sensor Fusion ... 92
5.4 Validation for Proposed Demagnetization Model ... 94
5.5 Conclusion ... 98
CHAPTER 6 CONCLUSIONS AND FUTURE WORK ... 100
6.1 Conclusions ... 100
6.2 Future Work ... 101
REFERENCES/BIBLIOGRAPHY... 102
APPENDICES ... 110
Appendix A :Permission for Using Previously Published Material ... 110
xiii
LIST OF TABLES
TABLE2-1PARAMETERS OF THE SPMSMMOTOR UNDER TEST ... 24 TABLE2-2PERFORMANCE OF DIFFERENT TYPES OF WAVELETS... 28 TABLE2-3RESIDUAL FLUX LINKAGE OF TESTED PMSM ... 43 TABLE2-4UNIFORM DEMAGNETIZATION FAULT DETECTION OF THE SPMSM AT OPERATION WITH
4,000 RPM,40NM ... 44 TABLE3-1PERFORMANCE OF DIFFERENT TYPES PF WAVELETS AT PMDEMAGNETIZATION
DIAGNOSIS ... 52 TABLE3-2PARAMETERS OF THE PMSMMOTORS UNDER TEST ... 58 TABLE3-3FLUX LINKAGE OF IPMSMFAKE PMS REPLACEMENT ... 60 TABLE3-4PARTIAL DEMAGNETIZATION FAULT DETECTION OF THE IPMSM AT OPERATION WITH
200 RPM,10NM ... 64 TABLE3-5PARTIAL DEMAGNETIZATION FAULT DETECTION OF THE IPMSM AT OPERATION WITH
200 RPM,15NM ... 65 TABLE4-1PARAMETERS OF THE LABORATORY PMSMMOTORS UNDER TEST ... 75 TABLE4-2FLUX LINKAGE VARIATION MONITORING RESULT OF THE PMSM AT OPERATION WITH
xiv
LIST OF FIGURES
FIGURE 1-1.THE STRUCTURE OF PERMANENT MAGNET SYNCHRONOUS MACHINES [2].(A)SURFACE
MOUNTED SYNCHRONOUS MACHINE (SPM).(B)INTERIOR SYNCHRONOUS MACHINE (IPM). ... 2
FIGURE 1-2.THE STATOR AND ROTOR OF A DESIGNED SURFACE MOUNTED PERMANENT MAGNET SYNCHRONOUS MACHINE . ... 3
FIGURE 1-3.THE ROTOR AND STATOR OF A DESIGNED INTERIOR PERMANENT MAGNET SYNCHRONOUS MACHINE. ... 3
FIGURE 1-4.PERFORMANCE COMPARISON OF INDUCTION-MOTOR AND PERMANENT-MAGNET-MOTOR IN A EV. ... 4
FIGURE 1-5.THE HYSTERESIS LOOP OF MAGNETIC CHARACTERISTICS AND DEMAGNETIZATION TYPES. ... 7
FIGURE 1-6.TEMPORAL EVOLUTION OF THE PHASE CURRENTS IN CASE OF DEMAGNETIZATION [21]. 10 FIGURE 2-3.FLOWCHART OF THE SEVEN INDICATORS FOR PROPOSED MODEL TRAINING. ... 25
FIGURE 2-4.MEASURED ACOUSTIC NOISE FROM A HEALTHY PMSM AT 50 RPM. ... 26
FIGURE 2-5. SCHEMATIC FLOW OF WAVELET PACKET DECOMPOSITION AND RECONSTRUCTION. ... 27
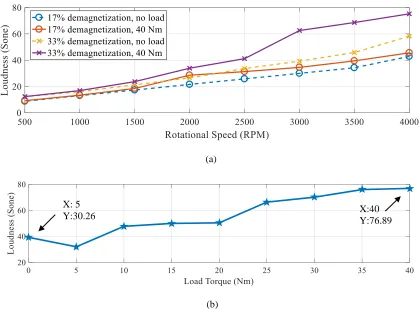
FIGURE 2-6.NOISE LOUDNESS OF PMSM.(A)DEMAGNETIZATION WITH SPEED.(B)33% DEMAGNETIZATION WITH LOAD AT 4,000 RPM. ... 30
FIGURE 2-7.NOISE ROUGHNESS OF PMSM.(A)DEMAGNETIZATION WITH SPEED.(B)33% DEMAGNETIZATION WITH LOAD AT 4,000 RPM. ... 31
FIGURE 2-8.FLUCTUATION STRENGTH OF PMSM.(A)DEMAGNETIZATION WITH SPEED AT 0NM AND 40NM.(B)33% DEMAGNETIZATION WITH LOAD AT 4,000 RPM. ... 32
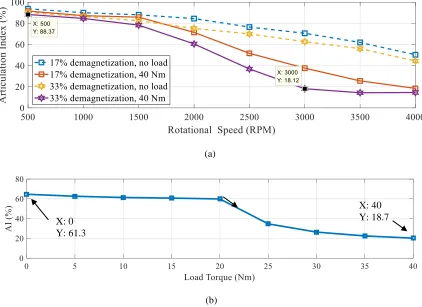
FIGURE 2-9.ARTICULATION INDEX OF PMSM.(A)DEMAGNETIZATION WITH SPEED.(B)33% DEMAGNETIZATION WITH LOAD AT 4,000 RPM. ... 33
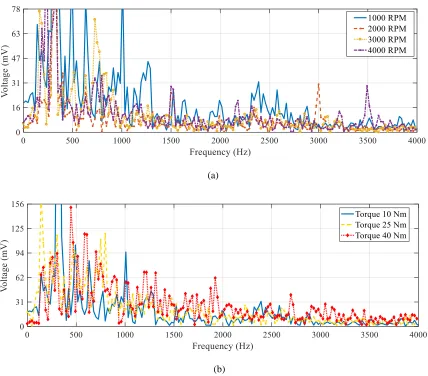
FIGURE 2-10.FFT ANALYSIS OF PMSM ACOUSTIC NOISE.(A)17% DEMAGNETIZATION WITH SPEED. (B)33% DEMAGNETIZATION WITH LOAD AT 3,000 RPM. ... 35
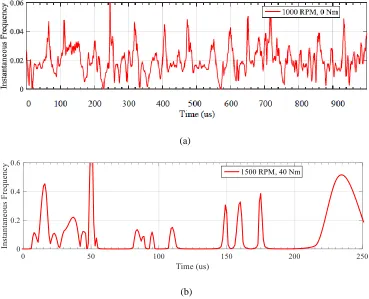
FIGURE 2-11.THE INSTANTANEOUS FREQUENCY OF IMF3.(A)17% DEMAGNETIZATION NO LOAD AT 1,000RPM.(B)33% DEMAGNETIZATION WITH 40NM AT 1,500RPM... 36
FIGURE 2-12.PSD SPECTRA OF PMSM ACOUSTIC NOISE WITH DEMAGNETIZATION FAULTS. ... 37
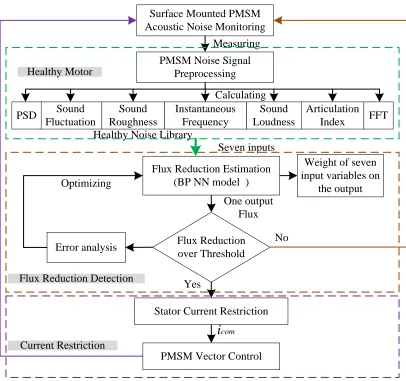
FIGURE 2-13.FLOWCHART OF THE PROPOSED PM DEMAGNETIZATION DETECTION. ... 38
FIGURE 2-14. BPNN MODEL OF DEMAGNETIZATION DETECTION BASED ON ACOUSTIC NOISE. ... 39
FIGURE 2-15.MEAN SQUARED ERROR OF DEMAGNETIZATION DETECTION MODEL TRAINING. ... 40
FIGURE 2-16.VECTOR CONTROL SCHEMATIC FOR PMSM WITH CURRENT COMPENSATION. ... 41
FIGURE 2-17.EXPERIMENTAL SETUPS FOR PMSM DEMAGNETIZATION DETECTION.(A)A/D CIRCUITS. (B)UNIVERSAL MOTOR DRIVE CIRCUIT BOARD.(C)DYNO AND TEST MOTORS. ... 41
FIGURE 2-18.THE COMPARISON BETWEEN MEASURED AND ESTIMATED DEMAGNETIZATION... 44
FIGURE 3-1.NORMALIZED TORQUE SPECTRA OF INTERIOR PMSM WITH DEMAGNETIZATION. ... 48
FIGURE 3-2.FLOWCHART OF THE PROPOSED DEMAGNETIZATION FAULT DIAGNOSIS. ... 49
FIGURE 3-3.MEASURED TORQUE RIPPLE FROM A HEALTHY IPMSM MOTOR AT 50 RPM.(A)INITIAL TORQUE CONTAINING A LARGE AMOUNT OF HIGH-FREQUENCY ELECTROMAGNETIC NOISES.(B) TORQUE MEASUREMENT DE-NOISED BY WAVELET TRANSFORMS. ... 51
FIGURE 3-4.TORQUE RIPPLE RIDGE-WAVELET ENERGY EXTRACTED FROM TORQUE RIPPLE FOR A HEALTHY INTERIOR PMSM AT SPEED 50 RPM. ... 55
FIGURE 3-5.FLOWCHART OF THE DEMAGNETIZATION DETECTION PROCESS USING GST WITH FOUR PREVIOUS MEASUREMENTS. ... 57
xv
FIGURE 3-7.EXPERIMENTAL SETUPS FOR IPMSM PARTIAL DEMAGNETIZATION DIAGNOSIS.(A) INVERTER AND CONTROL CIRCUITS.(B)LAB-DESIGNED IPMSM MOTOR CONTROLLER.(C) DYNO AND TEST MOTORS. ... 59
FIGURE 3-8.TORQUE RIPPLE MEASUREMENT WITH WAVELET TRANSFORMS FROM IPMSM UNDER TEST AT 200 RPM WITH 10NM OUTPUT TORQUE.(A)HEALTHY OPERATION.(B)17% PARTIALLY DEMAGNETIZATION FAULT.(C)33% PARTIALLY DEMAGNETIZATION FAULT. ... 61
FIGURE 3-9.TORQUE MEASUREMENT FOR THE BUTTERWORTH FILTER BEFORE AND AFTER FROM A HEALTHY IPMSM AT 200 RPM WITH 10NM. ... 62
FIGURE 3-10.FFT ANALYSIS OF TORQUE AT 200 RPM 10NM TORQUE.(A)HEALTHY.(B)17%
PARTIAL DEMAGNETIZATION FAULT.(C)33% PARTIAL DEMAGNETIZATION FAULT. ... 63
FIGURE 3-11.TORQUE RIDGE EXTRACTED FROM IPMSM AT 200 RPM AND 10NM. ... 64
FIGURE 3-12.TORQUE RIPPLE ENERGY EXTRACTED FROM IPMSM AT 200 RPM AND 10NM
WITH/WITHOUT PARTIAL DEMAGNETIZATION. ... 65
FIGURE 3-13. NORMALIZED TORQUE SPECTRA WITH PARTIAL DEMAGNETIZATION. ... 65
FIGURE 3-14.PARTIAL DEMAGNETIZATION FAULT DETECTION OF IPMSM WITH GST. ... 66
FIGURE 3-15.THE BACK EMF VOLTAGE AS MEASURED USING THE SEARCH COIL TO REPRESENT THE FLUX LINKAGE.(A)INITIAL WAVEFORM.(B)AFTER USING THE CURRENT REGULATION
CONTROL. ... 68
FIGURE 4-1.FLOWCHART OF THE PROPOSED VKF-OT BASED FLUX LINKAGE MONITORING. ... 74
FIGURE 4-2.EXPERIMENTAL SETUPS FOR PMSM FLUX LINKAGE VARIATION MONITORING.(A)LAB
-DESIGNED UNIVERSAL MOTOR CONTROLLER.(B)DYNO AND TEST MOTORS SETUP. ... 76
FIGURE 4-3.MEASURED TORQUE RIPPLE FROM A HEALTHY SPMSM MOTOR WITH WAVELET
TRANSFORMS UNDER TEST AT 200 R/MIN WITH 15NM OUTPUT TORQUE. ... 77
FIGURE 4-4.EXPERIMENTAL RESULTS OF PMSM UNDER 83% RESIDUAL FLUX LINKAGE VARIATION WITH SPEED FROM 250 R/MIN TO 50 R/MIN.(A)TORQUE RIPPLE AFTER FILTERING.(B)TRACKED
1ST,2ND, AND 3RD ORDERS OF TORQUE RIPPLE. ... 79
FIGURE 4-5.EXPERIMENTAL RESULTS OF PMSM UNDER 67% RESIDUAL FLUX LINKAGE VARIATION WITH SPEED FROM 250 R/MIN TO 50 R/MIN.(A)DE-NOISED TORQUE RIPPLE MEASUREMENT.(B) TRACKED 1ST,2ND, AND 3RD ORDERS OF TORQUE RIPPLE. ... 80
FIGURE 4-6.TORQUE RIPPLE ORDER ENERGY ILLUSTRATION FROM VKF-OT.(A)UNDER 83%
RESIDUAL FLUX LINKAGE.(B)UNDER 67% RESIDUAL FLUX LINKAGE VARIATION. ... 82
FIGURE 4-7.FLUX LINKAGE MONITORING FROM AN ARTIFICIALLY REDUCED MAGNET PMSM WITH 20 NM AT SPEED CHANGE FROM 250 R/MIN TO 50 R/MIN. ... 84
FIGURE 5-1.FLOWCHART OF MULTI–SENSOR BASED DEMAGNETIZATION DETECTION MODEL. ... 90
FIGURE 5-2.MEASURED TORQUE RIPPLE FROM A HEALTHY PMSM WITH WAVELET TRANSFORMS UNDER TEST AT 1,500 RPM WITH 15NM OUTPUT TORQUE. ... 91
FIGURE 5-3.NAÏVE BAYESIAN NETWORK CLASSIFIER TO DETECT ROTOR DEMAGNETIZATION. ... 95
FIGURE 5-4.EXPERIMENTAL SETUPS FOR PMSM DEMAGNETIZATION DETECTION VALIDATION. ... 96
FIGURE 5-5.COMPARISON OF DEMAGNETIZATION DETECTION AMONG THREE METHODS USING ONE COMMON FEATURE VALUE. ... 97
FIGURE 5-6.FUSION BASED DETECTION RESULT COMPARED WITH NOISE BASED METHOD. ... 97
xvi
NOMENCLATURE
A list of principal symbols is given here; there are more symbols used in this thesis, which have been defined locally. For simplicity, magnet flux is used to denote magnet flux linkage with respect to a specific machine in this thesis.
ψdr, ψqr :d- and q-axis rotor flux respectively
ψds, ψqs :d- and q-axis stator flux respectively
ids, iqs :d- and q-axis stator current respectively
idr, iqr :d- and q-axis rotor current respectively
vdr, vqr :d- and q-axis rotor voltage respectively
vds, vqs :d- and q-axis stator voltage respectively
Lm :Mutual inductance
Ls, Lr, :Stator and rotor inductance respectively
Lss, Lrr :Stator and rotor leakage inductance respectively
Rs, Rr :Stator and rotor resistance
ωs, ωr :Synchronous speed and rotor speed respectively
Tm :Mechanical load torque
Te :Electromagnetic torque
iT :Torque producing current
if :Field producing current
H :Combined inertia of rotor and load Pr : Radial force
α : Stator space angle μ0 : Vacuum permeability
B : Air gap flux density μα : Relative permeance
xvii
g : Wavelet function
ETQ : Excitation at threshold in quiet
E0 : Excitation to the reference sound intensity
E : Exciting value N : Loudness
z : Critical-band rate fmod : Modulation frequency
∆L(z) : Masking depth Tc, Tλ ,Tλ, : Torque components
θe : Rotor position
Φdq : Armature current flux
1
CHAPTER 1 INTRODUCTION
1.1Overview and Motivations
Energy shortage is an important issue of concern to the world today, and it is related to the improvement of the global environment and human survival. Energy efficiency is the goal of all countries in the world. Energy-saving technology is recognized as a green technology, and its research and development of related products will become the theme of industrial development in the century. At present, countries are actively carrying out research and application of energy-saving technologies. Electricity is the most important secondary energy source in the world today, and electric motors are currently the most widely used [1].
The first motor in human history was a permanent magnet motor created by Jacob in 1843. He built a magnetic field from a permanent magnet material. However, because the permanent magnet was made of natural magnetite ore and had poor performance, the motor performance was poor with the large volume. Soon it was replaced by an electric excitation motor. The asynchronous motor has the advantages of simple structure, reliable operation, long service life and convenient maintenance and repair, but it also has disadvantages such as poor mechanical properties, low efficiency, small starting torque, poor speed regulation performance, low power factor when operating at light load, and increased losses.
2
demagnetization, and low cost, which make permanent magnet motors have been rapidly developed in the manufacture.
Therefore, the research background of this thesis is the application of the Permanent Magnet Synchronous Machine. In general, a synchronous machines produces electromagnetic torque by the interaction between the rotor flux and stator mmf (magnet motive force), which are from rotor windings and stator coils respectively. In PMSM, the rotor windings are replaced by the PM. According to the ways of arranging the magnets on the rotor, the PMSM can be classified as surface-mounted PMSM and Interior PMSM shown in Fig. 1-1 [2]. The Fig. 1-2 [3] shows the magnets mounted on the surface of the outer periphery of the rotor laminations. This arrangement provides the highest air gap flux density as it directly faces the air gap without the interruption of any other medium such as part of rotor laminations. The Fig. 1-3 [3] shows the placement of magnets in the middle of the rotor laminations in radial orientations. Such a machine construction is generally referred to as interior PMSM. The interior PM rotor construction is mechanically robust and therefore suited for high-speed applications. Both types have been widely used in the EV applications.
(a) (b)
3
Figure 1-2. The stator and rotor of a designed surface mounted permanent magnet synchronous machine [3].
Figure 1-3. The rotor and stator of a designed interior permanent magnet synchronous machine [3].
4
the rated power range. In general, the use of energy-saving efficiencies in some long-running (electric vehicles) or in most operating conditions for light-load operation can achieve significant energy savings compared to induction motors. The graph Fig. 1-4 compare the efficiency between PMSM and IM [12]. The table shows the specifications of a SPM in our lab. The efficiency is up to 97%.
Figure 1-4. Performance comparison of induction-motor and permanent-magnet-motor in a EV [12].
Due to its inherent characteristics, permanent magnetic materials do not require additional energy to establish a magnetic field in their surrounding space after pre-magnetization. When the permanent magnet material is applied to the motor, the higher power factor can be obtained due to the needlessness of reactive current, which reduces the stator current and the stator resistance loss, thus the high efficiency can be maintained within the rated load range. Permanent magnet motors also have advantages such as larger starting torque and wide speed range. With the application of high-performance permanent magnet materials, the volume and quality of permanent magnet motors are greatly getting reduced, and the power density is greatly being improved.
5
materials, ferrite, and rare earth permanent magnet material. Casting Alnico (AlNiCo) permanent magnet material has high Curie temperature TC and good stability under high
temperature, but it contains more other metals such as cobalt and nickel. The main features of ferromagnetic permanent magnet materials are abundant materials resources and favorable prices, but the remanent flux density is not high (Br =0.2~0.44 T). NdFeB
permanent magnet material has high maximum flux energy product (BH)max, remanent flux
density remanence Br, and coercivity Hc. NdFeB is the most widely used permanent magnet
material. Although its performance is satisfactory, it also has its disadvantages, that is, the temperature characteristics are poor, which is reflected in the low Curie temperature and high temperature coefficient. The magnetic loss under high temperatures is large, and the lower half of the demagnetization curve is non-linear (curved). Because of the poor temperature stability of NdFeB permanent magnet material, its irreversible loss and temperature coefficient are high, resulting in serious loss of magnetic properties at high temperature.
Moreover, the other reason is motor operation conditions. The air gap magnetic field of the permanent magnet motor is generated by the permanent magnet. During the operation, the motor generates heat, vibration, demagnetizing magnetic field, etc., which may cause the permanent magnet to demagnetize, and consequently reduces the working point of the permanent magnet as well as the motor performance. If the demagnetization is severe, the permanent magnet works below the knee point, irreversible demagnetization will occur and result in a decrease in the performance of the permanent magnet. The motor no-load back EMF and output torque will drop. In severe cases, the motor will not be damaged. When PMSMs are widely used in EVs and other occasions, some special working conditions may occur such as motor overload, out of step, frequent forward and reverse (charging batteries), causing a surge in current in the case of motor starting, braking or failure, and the working point moves toward the knee point of the demagnetization curve. The above conditions may cause motor vibration and permanent magnet overheating, which makes the demagnetization field more serious. With all those factors working together, there might be irreversible demagnetization of a properly designed PMSM.
6
1.2Permanent Magnet Synchronous Machine Demagnetization
1.2.1 Definition of PM Demagnetization
Demagnetization phenomenon is usually caused by physical damage, high-temperature stress, inverse magnetic fields, and aging. For example, when a car is running in a severe condition such as steep ramp start, on rough road, in extremely hot area, or stunt show, demagnetization might happen.
However, there is not standard definition of demagnetization so far, but usually it is described as the loss of magnetization in magnet materials. During the magnetization of ferromagnetic materials, the relationship between magnetic field strength and magnetic flux density is not linear. If the ferromagnetic material is repeatedly magnetized, a curve of magnetic flux density as a function of magnetic field strength can be obtained, which is called hysteresis loop in Fig. 1-5 [13] left that shows the relationship between field strength H and magnetic density B of a PM. When an external magnetic field is applied to a PM material, the material has become magnetized. Once magnetized, the magnet will stay magnetized indefinitely. To demagnetize it requires heat or a magnetic field in the opposite direction. The second quadrant portion of the hysteresis loop of the permanent magnet material can be used to describe the characteristics of the permanent magnet material, as shown in Fig. 1-5 right, referred to as the demagnetization curve.
7
point, it sharply dives down to zero. Then it recovers magnetism along a line parallel to the original B–H characteristic. In that process, it reaches a new remanent flux density, Brr, which lower than the original remanent flux density. The difference between the two points is the irreversible magnetism loss.
Figure 1-5. The hysteresis loop of magnetic characteristics and demagnetization types [13].
1.2.2 Factors Affecting PM Demagnetization
The performance of permanent magnet materials is affected by external environment temperature and applied magnetic field. There are mainly the following origins of demagnetization:
(1) Demagnetization of permanent magnet material is due to temperature change. This is mainly related to the temperature coefficient of the permanent magnet material. The lower the temperature coefficient value, the higher the temperature stability of the permanent magnet material. The temperature coefficient of NdFeB permanent magnet material is relative larger, and the effect of temperature change on its performance should be considered when NdFeB is used in electric motors. However, the temperature coefficient of rare earth cobalt permanent magnet material is low, thus the motor performance is less affected by temperature changes. The motor temperature stability is satisfied, and temperature effects can be ignored [14].
8
straight at low temperature, irreversible demagnetization will not happen at low temperature even if there is an external demagnetizing field. However, its temperature stability is poor. When the motor is working in high temperature environment, the demagnetization curve will bend. Thus, irreversible demagnetization may occur if the applied demagnetizing field exceeds a certain value [15].
(3) Demagnetization due to vibration: The permanent magnet magnetic moment direction of the internal magnetic domain may change after being subjected to severe vibration. The change causes the magnetic properties of the magnetic steel to deteriorate, which in turn causes the magnetic steel to demagnetize or even irreversibly demagnetize [16]. In the actual application, if the motor is used improperly, such as the motor is being done the stall test, the permanent magnet is easy to demagnetize.
(4) The influence of chemical factors leads to the weakening of magnetic properties. There are some chemical compositions in permanent magnet materials, such as NdFeB contains a large amount of strontium and iron. The changes in the chemical structure of the surface or internal will cause the occurrence of demagnetization when the motor is used in the sever surrounding environment such as acid, alkali, oxygen and other chemical elements [17]. In practice, various technological measures are generally taken to prevent the occurrence of oxidation or decaying candles during the manufacture, thus examples of demagnetization caused by this situation rarely occur.
(5) Demagnetization due to time. The magnetic properties of permanent magnet materials will weaken with time even after being put in an ideal environment after magnetization. The magnetism loss is linear with the logarithm of time [18]. Theoretically, permanent magnets also have a lifetime index, but it is less affected by time. In practical applications, irreversible demagnetization due to the long usage rarely occurs, so the impact of this aspect is negligible.
9
Temperature affected demagnetization is caused by a high temperature of the permanent magnet due to the turbulence. Physics studies show microscopic particles are all in thermal motion, which changes the direction of the magnetic moment of each atom continuously and irregularly. When the temperature is low, the electron exchange of two adjacent atoms of the permanent magnet material is much more affected than the thermal motion. When the temperature rises to a certain extent, the spatial orientation of the magnetic moment under the action of thermal motion will change, resulting in irreversible demagnetization. In a running EV, the motor temperature may reach above 130OC, and at this time the
demagnetization of the permanent magnet characteristic is no longer a straight line. When the demagnetizing field strength exceeds a certain value, the working point will be lower than the knee point of the demagnetization curve and irreversible demagnetization occurs [19]. When the demagnetizing field strength reaches a certain value, the magnetic domain in the permanent magnet will have a domain wall position. The magnetic domain in the permanent magnet will undergo domain wall displacement and the magnetic moment will rotate to the direction of the demagnetization field, forming an irreversible rotation. Even the demagnetizing field disappears, the magnetic domain magnetic moment in the permanent magnet cannot return to the original magnetic moment direction, that is, irreversible demagnetization occurs. Once demagnetization occurs, in the stator winding, stator current should be much larger than the rated value to generate the same torque, and the heat generation of the motor is increased [20].
1.2.3 PMSM Demagnetization Effects
Usually when demagnetization occurs, it will cause several issues in a PMSM. For example, demagnetization will reduce the output torque because of its impact on interaction between the permanent magnet field and the stator magnetic field. Meanwhile, it will degrade the robustness, cause vibration, noise, and even lead to the motor failure.
10
Figure 1-6. Temporal evolution of the phase currents in case of demagnetization [21].
1.3Literature Review
Since demagnetization affects the motor performance, researchers have worked on this field by different methods. Through background study, the existing research methods for demagnetization detection can be classified into two major categories: prevention analysis and monitoring techniques.
1.3.1 Permanent Magnet Demagnetization Prevention Analysis
In order to prevent the permanent magnet motor from demagnetizing, measures to reduce the risk of loss of magnetism have to be taken in four aspects: permanent magnet material selection, permanent magnet motor design, permanent magnet motor assembly process, and permanent magnet motor use. For the permanent magnet motor designers, the permanent magnet demagnetization is prevented from the design and use of the permanent magnet motor.
11
(1) Magnetic network analysis
The magnetic network analysis method of permanent magnet motor is based on the theory of magnetic flux management. It takes the PM part with the same material, uniform magnetic flux distribution and regular shape as an equivalent magnetic conducting unit. Each magnetic conducting unit is connected through nodes. Similar to electric network equations, the magnetic position, magnetic flux of each node in the magnetic network equation, and the relevant parameters can be obtained by using magnetic network equations. Compared with the finite element analysis, the number of nodes and the calculation time of the magnetic network equation are greatly reduced [22-24].
Since magnetic network analysis is a typical lumped parameter method, it simplifies the motor model with the idea of synthesizing magnetic field. There exit empirical formulas, corrections and coefficients, which will inevitably cause some error between the calculation result and the actual result. Especially when the method is applied to a permanent magnet motor model with complex structure, the magnetic network analysis method has to require more nodes to improve its accuracy. However, due to the analytical relationship between the magnetic permeability unit and the dimensional constant, and less calculation time, this method can provide a way for rapid optimization design.
(2)Magnetic field finite element analysis (FEA)
The magnetic field finite element analysis method is a widely used numerical calculation magnetic field method with high calculation accuracy. FEA is used to analyze the demagnetization phenomenon of the permanent magnet, and then the anti-demagnetization optimization design can be carried out.
12
In [26], the three different permanent magnet arrangement schemes of the built-in permanent magnet motor single layer model, V shape model, double-layer model permanent magnets are compared from the anti-demagnetization point. When the maximum torque is generated, the single layer model permanent magnet is most prone to demagnetization. In the case of short-circuit current failure, the " V shape model permanent magnet is most prone to demagnetization, while the double-layer permanent magnet arrangement is the most difficult to prevent demagnetization. Demagnetization provides a solution for the permanent magnet structure arrangement of permanent magnet motor from the anti-demagnetization angle.
A conclusion is drawn in [27] that the eddy current loss on the surface of the permanent magnet is reduced through the 3D finite element simulation of the axial segmentation of permanent magnets. Those series of studies with FEA on the effects of insulation, block number, frequency and harmonics on the eddy current loss between axial magnetic steel blocks, have provided a reference direction for the permanent magnet axial block method.
1.3.2 PM Demagnetization Monitoring and Detection Techniques
The study of permanent magnet demagnetization of magneto is not only carried out in the design process to prevent the demagnetization of permanent magnets, but also the state of dynamic PM monitoring during motor operation to detect whether permanent magnets are demagnetized. The dynamic monitoring technology including monitoring the PMSM parameters, obtaining the state information of the permanent magnet, and dynamical controls according to its state information to prevent More severe demagnetization occurs. The existing methods for demagnetization detection can be classified into five categories on the basis of the detection approaches. They are direct detection, current/voltage/torque based detection.
(1) Direct Detection
13
Although this method can be used to diagnose both non-uniform and uniform demagnetization of permanent magnets, the drawback is that the tested motor needs to be stopped and disassembled. In general, these techniques are good for quality control in PMSM manufactory process.
(2) Current Based Detection Approaches
Current based detection approach is popular due to the easy availability of the current signal, and simple mathematical. Researchers are trying to use current frequency distribution, harmonic component and injected current to detect the PM magnet filed fault. Stator phase currents frequency distribution is used to describe the fault distribution by FFT averages in time domain [30], but it is not applicable to variable speed and load because frequency components appearing in symmetrical stator windings gives improper fault analysis result.
Harmonic components amplitude [31] [32] in the parallel phase winding branches [33] caused by demagnetization was used as a criterion to identify demagnetization ratios. However, it is only related to machines with parallel branches, not easy to access the currents in the branches of every machine.
Author in [34] injected d-axis current in standstill to detect the PMSM stator winding short-circuit fault and permanent magnet demagnetization fault, but it needs additional inverters, sensitivity depends upon the design parameters of the motor.
(3) Voltage Based Detection Approaches
This method is useful when harmonics related to demagnetization do not appear in the stator current spectrum due to the winding configuration.
The author in [35] explored the instantaneous back EMF of slot conductors to predict demagnetization fault frequencies by means of FEM simulation. It is invasive and needs additional injected equipment. In [36], zero-sequence voltage component (ZSVC) was taken as a feature value in a symmetric stator winding PMSM to determine demagnetization and compared with FEM results. Like [37], this method resistor network connected to the drive system and not feasible in a EV.
14
Torque based approach focus on analyzing the toque radius, torque constant to obtain the demagnetization information.
Cogging torque is analyzed in [38] by a 2-D finite element method, by means of which the cogging torque signal is computed under healthy and faulty conditions. It is off-line and sensitive to the load level. The estimated torque constant was applied in [39] to monitor magnet quality to detect the demagnetization. Again, it is sensitive to the parameters of the motor, only for sever fault detection. A shaft trajectory of the PMSM in [40] was used as a criterion to identify demagnetization ratios, and the result is accurate. The entire system is complicated, and it is difficult to calibrate.
(5) Magnetic Flux Based Approaches
Magnetic flux based approach provides the demagnetization information by studying d-axis flux, flux pattern, and vibrations. This kind of approaches concentrate on the direct and major impact of the demagnetization fault.
PM flux pattern was studied in [41], [42] for the magnetization and circumferential axis of the PM with high accuracy and reliability. During the experiments, the PMSM motor must be dismantled. In [43], magnetization coefficients of each piece of PMs was employed using an analytical model considering the stator slotting effect and the end winding inductances. The result of this method has lower precision. Vibration and noise were considered as criterion signals in [44] to diagnose eccentricity and partial demagnetization in PMSM with spectrum analysis. But the proposed method is not able to separate the demagnetization faults from the other motor faults.
1.3.3 Machine Learning based PM Demagnetization Detecting Techniques
15
accurately predicted in [49] by using multiphysics finite-element modeling (FEM). Field reconstruction method (FRM) and mechanical impulse response are applied in [50] to calculate EM vibration and in [51] to predict the static eccentricity and partial demagnetization. EM and mechanical characterizations of noise and vibration in PMSM are studied in [52] while factoring in resonance influence. Both [53] and [54] use the Black-Box technique to detect and analyze irregular sources of noise in the PMSM, however it is unable to reveal noise changes and flux variation. In general, these methods have provided viewpoints to noise-based detection from different aspects, but most of them require detailed motor parameters and are computationally inefficient.
16
can lead to the ZSVC in motor stator as well. Consequently, the distinction of ZSVC caused by demagnetization from that caused by other factors would be further studied in future. Vibration and noise were considered as criterion signals in [72] to diagnose eccentricity and partial demagnetization in PMSM with spectrum analysis. Again there was the same problem in [73] as the further study was necessary in order to distinguish demagnetization from other faults. Estimated torque constant [74] or measured torque constant [75] were used to distinguish eccentricity fault from uniform demagnetization fault for different windings using inverter dc link distributed over every 60 electrical degrees. However, this method is not desirable since the load is disconnected from the machine.
In general, these methods have provided appropriate viewpoints to demagnetization detection on different aspects. Some are not feasible to diagnose a motor running in an electric vehicle. Moreover, some conventional methods, like FFT or time-frequency analysis, are not available in all cases due to the non-stable data resource.
1.4Research Objectives
From literature review, the above approaches have been used to detect demagnetization, and most of them provided appropriate viewpoints to demagnetization detection on different aspects. However, there are some drawbacks. Some of them are model based, and need complicated analytical system or large amount of computation. Some conventional detection algorithm succeeds in detecting the fault but fail to distinguish fault ratio. Some investigation is off-line method, and could not diagnose a motor running in an electric vehicle or connect loads from the machine. Others are invasive way to access the signals, and damage the motor structure. Almost all of the existing detection methods could not implement relative corrective action after demagnetization.
Thus, the objective of this thesis are:
− On-line non-invasive PM demagnetization detection methods based on the analysis of PMSM variables through output torque ripple and/or acoustic noise.
− Post demagnetization control strategy to protect the PMSMs.
17
through data mining. without the requirement of accurate analytical model. The mining objects would be the torque ripple, acoustic noise and the time harmonics. This thesis will use machine learning algorithm such as GST, BP NN, and DBN to estimate the fault occurrence and find the fault level as well. After the demagnetization occurs, this thesis will also propose a control strategy to prevent the motor getting further damaged.
1.5Research Contributions
This thesis proposes novel and advanced demagnetization techniques with the merits such as independence on machine parameters, real-time detection, and enhanced computation efficiency. Moreover, the signal processing algorithms and machine learning algorithms help to improve the prediction accuracy. Compared with the existing detection methods, the proposed approaches have major contributions are listed as follows.
(1) The first merit of those proposed approaches are that they are non-invasive methods. Those methods will not change or damage the motor physical structure and thus are feasible for on-line monitoring in a running EV.
(2) The psychoacoustic and objective indicators, which can process nonlinear signals, are introduced to reflect the comprehensive noise quality, thus the performance of the proposed approach can be improved more comprehensively than the other approaches.
(3) The computations for acoustic noise based demagnetization detection approach are less complex than standard methods, thus an online implementation is feasible due to its efficiency. The computation complexity of the torque ripple based detection method is less than the conventional method and can be implemented on-line due to its computation efficiency.
(4) The proposed signal processing method can reduce the influence of noise and improve the signal-to-noise ratio.
18
(6) The proposed method implements the machine learning algorithms which are good at processing the nonlinear signals, and thus the performance of the proposed approach can be improved in comparison with the existing approaches.
1.6Dissertation Layout
Chapter 2 presents the idea of detecting uniform PM demagnetization by using acoustic noises in order to develop a reliable PMSM controller. A flux based acoustic noise model is proposed to demonstrate that demagnetization will induce acoustic noise containing abnormal frequency. This chapter also analyzes online PM demagnetization detection by using a back propagation neural network (BPNN) with acoustic noise data. Firstly, seven objective and psychoacoustic indicators are proposed to evaluate the acoustic noise of healthy and demagnetized PMSMs under different speed and load conditions. Next, a novel BPNN based PM demagnetization detection method is proposed. In this method, the PM demagnetization is detected by means of comparing the measured acoustic signal of PMSM with an acoustic signal library of seven acoustical indicators.
Chapter 3 proposes the use of torque ripple for online PM demagnetization fault diagnosis using continuous wavelet transforms (CWT) and Grey System Theory (GST). Firstly, a torque ripple based rotor flux linkage detection model considering electromagnetic noises is proposed, which employs the CWT filtering, wavelet ridge spectrum, and torque ripple energy extraction. This model is able to reveal the torque variation and eliminate the effect of electromagnetic interferences. Secondly, GST is employed to facilitate the detection of demagnetization ratios and torque ripple energy pulsations caused by demagnetization. Thirdly, a current regulation strategy is proposed to minimize the torque ripples induced by PM demagnetization, which contributes to making the approach feasible to interior PMSM (IPMSM). Furthermore, the proposed real-time irreversible demagnetization detection approach can identify the demagnetization fault under different operating conditions.
19
and processed by wavelet transform to eliminate the effects of the electromagnetic disturbances. VKF-OT is introduced to track the order of torque ripple of PMSM running in unsteady state. Therefore, torque ripple characteristics can be used as a feature to reflect changes in PM flux linkage. Moreover, this method is feasible for PMSM by applying DBN to the training data to estimate the flux linkage during motor operation.
Chapter 5 proposes the use of multi-sensor information, namely, acoustic noise and torque, for demagnetization detection through the information fusion technique. The acoustic noise and torque information are processed and analyzed using wavelet transforms for filtering and extracting features. Bayesian network based multi-sensor information fusion is then proposed to detect the demagnetization ratio from the extracted features. The proposed approach is experimentally verified on a laboratory PMSM and compared with single-sensor detection methods.
20
CHAPTER 2
PERMANMENT MAGNET DEMAGNETIZATION DETECTION BASED ON ACOUSTIC NOISE ANALYSIS
2.1Introduction
The electromagnetic (EM) torque, excluding the reluctance torque, is proportional to the quadrature-axis current, which is in accordance with the electrical model of a surface mounted permanent magnet synchronous machine (SPMSM) in dq-axis reference frame. However, PMs in the rotor may demagnetize, which can cause speed and temperature variances during testing. This causes the output torque to be non-linear with respect to the current, which then creates abnormal acoustic noise from the resulting torque ripple. PM demagnetization, is caused by a combination of thermal, electrical, mechanical, and environment issues [1]. This alters the torque constant and reduces the PMSM motor output torque, which is produced from the interaction between the stator winding field and the permanent magnet field. Moreover, demagnetization being irreversible causes electric drive system failures in EVs. It is essential to monitor the PM flux and detect demagnetization at an early stage in order to transmit an accurate dynamic torque constant to the control system. Furthermore, an advanced control strategy should be developed to protect the PMSMs.
In practice, PM demagnetization creates fluctuation in output torques as well as noise and vibration losses that degrades the system’s robustness and controllability. However, investigation of the acoustic noise is a challenge because of various interferences from harmonics produced by voltage source inverter (VSI). Moreover, the measured acoustic noise should be processed in a way that scrubs the extra noise and provides a current compensation reference value that is useful to vector control.
21
evaluate the acoustic noise from a surface mounted PMSM under acceleration conditions are sound fluctuation, sound loudness, sound roughness, articulation index, HHT instantaneous frequency, FFT spectrum and power spectrum density. Lastly, a novel BPNN based PM demagnetization detection method is proposed, in which PM flux is identified and detected by comparing a healthy motor noise library with measurements from seven acoustical indicators.
The proposed real-time PM demagnetization detection approach is experimentally verified on a laboratory surface mounted PMSM rated at 12.5 kW; the results demonstrate that the method can identify demagnetization under different operating conditions.
2.2Acoustic Noise Model Based on Flux Variation
A PMSM flux based acoustic noise model is proposed in this section to show that the demagnetization will induce the acoustic noise containing abnormal frequency. Acoustic noises produced by an electric machine can be viewed as a phenomenon that the electromagnetic forces interact with the stator frame [49]. According to Duhamel integral [76], the response of the PMSM machine consists of two parts: the response of the damped free vibration at the modal frequency and the response of forced vibration at the same frequency of the exciting force. When the electric motor operates at high speed with large torque, the addition of acoustic noise is typically from an EM source. When a healthy PMSM is fed with ideal sinusoidal current, the radial force is the major exciting force as in (2.1) [77]:
02
2 ,
,
t B t
Pr (2.1) where Pr is the radial force, α is the stator space angle. μ0 is the vacuum permeability, and
B is the air gap flux density.
22
The air-gap flux density can be obtained as (2.2) by superposition of permanent magnet field and armature interaction field assuming that saturation is neglected.
B
,t Br
,t Bs
,t (2.2) where B, Br and Bs are air-gap flux density, permanent magnet flux density, and stator fluxdensity.
The permanent magnet field and armature interaction field can be expressed as follows [13]:
t jp A t B t k p k A t B j sj s k k r kr cos , 1 2 1 2 cos , 1 1 2 1 2 1
(2.3)
where μα is the relative permeance, Ar(2k-1) is the amplitude of the (2k-1)th permanent magnet
field, ω is the electrical rotor speed, P is the number of pole pairs, Φ(2k-1) is the advance
angle, k is the integer and Asj is the amplitude of the jth armature interaction field.
According to (2.2) and (2.3), (2.1) can be rewritten as follows:
2 ]} 2 ) ( 2 ) ( 2 cos[ ] ) 1 ( 2 ) 1 ( 2 {cos[ 4 1 2 ) 1 2 ( 2 ) 1 2 ( 2 cos 4 2 2 ) 1 2 ( cos 2 2 ) 1 2 ( cos 2 ) ( cos 2 ) ( cos 4 2 2 cos 4 2 , , , 1 2 1 2 1 2 1 2 ,
1 1, (2 1) (2 1) 0 2 1 2 1 2 ) 1 2 ( 0 2
1 2 1 2 1
0 2
1 2 1 2 1
0 2
, 1 1, 0 2 1 2 0 2 0 2 m k m k m k
k r m
k m m r k
k j r k
j k r k sj k
j k r k sj k
l j
j l l j sj sl
23
where k, j, l and n are integers.
In practice, sinusoidal voltage is not transferred directly into PMSMs for EVs, instead, PMSMs are driven by the VSI with standard PWM switching frequency fs. However, the
harmonic currents of the standard PWM tend to cluster in multiples of fs, which cause
additional radial forces and result in acoustic noise. The rotor flux density considering VSI and the relevant harmonics can be rewritten as (5):
A jp h t
t B t B t B t B t B s i
h j sh h s h s s r i i i i cos , , , , , 1 , , , (2.5)
where hi is the harmonic current number, Bs,hi is the flux density caused by harmonics, and
ωs is switching speed. Substituting (2.3) and (2.5) into (2.1), the relationship between
acoustic noise frequencies fed with VSI and motor speed can be obtained as (2.6):
60 , 60 ) 1 ( 2 , 60 ) 1 ( 12k h np k h np h h np
N i m l
s i
s (2.6)
where hm and hj belong to the range {(2k-1)ωs/ω, 2kωs/ω}.
While examining (5) and (6), a certain frequency (2k±1±hi)ωs/π can be spotted in the noise
spectrum, which is caused by VSI harmonic components, the VSI frequency, and saturation effects. Acoustic noise is evidently increased by the demagnetization fault disturbances in the air-gap flux density distribution. The increase of the noise amplifies the sideband at frequency (2k±1±hi)ωs/π.
24
TABLE 2- 1PARAMETERS OF THE SPMSMMOTOR UNDER TEST
Rated power 12.5 kW Continuous torque 50 Nm Rated voltage 297 V Pole pairs number 4 Rated current 35 A Magnet flux (21℃) 0.136 Wb
Rated speed 3,000 rpm Magnet flux (120℃) 0.112 Wb
Figure 2-1. Noise variation in a SPMSM with 30 Nm at 1,000 RPM. (a) Healthy motor. (b) 10% demagnetization. (c) 30% demagnetization.
0
0
0
200
200
25
2.3Seven Acoustic Indicators for PM Demagnetization Prognosis
To implement the proposed demagnetization detection model, acoustic noise is measured from the PMSM by a microphone, which is shown in the experimental setup in section V. Seven indicators shown in Fig. 2-2 are employed to evaluate the measured acoustic noise in terms of magnet demagnetization. The seven indicators are as follows and are described in detail in this section:
1) HHT instantaneous frequency, Hilbert–Huang transform. 2) FFT, Fast Fourier transform spectrum.
3) PSD, Power Spectrum Density.
4) Sound Fluctuation, slower amplitude modulation.
5) Sound Loudness, an attribute of auditory sensation scale. 6) Sound Roughness, sound partials or tone components. 7) Articulation Index, the average proportion of signals.
Physical Acoustic Noise Indicators
Psychoacoustics Noise Indicators
Instantaneous Frequency FFT Spectrum
PSD Spectrum
Sound Loudness Articulation Index
Sound Roughness Sound Fluctuation
PMSM
INPUT Speed, Torque
OUTPUT Acoustic Noise
Noise assessment
Training
Figure 2-2. Flowchart of the seven indicators for proposed model training.
2.3.1 Pre-process Acoustic Noise Measurement from PMSM
26
transforms (WPT) are used on the acoustic noise measurements to filter them. WPT has advantages over conventional filter for representing functions, which comprise of non-stationary signals. The noise waveforms (blue dashed line) shown in Fig. 2-3, which are discontinuities and contain sharp peaks, meet the principles well, therefore, it is possible to filter the initial acoustic noise measurements by using WPT.
Figure 2-3. Measured acoustic noise from a healthy PMSM at 50 rpm.
The WPT sound filtering steps include wavelet packet decomposition, wavelet threshold filtering, and wavelet packet reconstruction. The brief introduction of those steps is shown as follows.
Step 1: Wavelet packets decomposition
The initial sound signal has to be decomposed into two parts: the approximation part that is the low frequency signal and the detail part that is the high-frequency signal. According to Mallat’s algorithm, the decomposition process includes two filter groups, which is shown in Fig. 2-4, to complete the wavelet packet decomposition. In the decomposition figure, ‘Lo_D’ is a low-pass filter and ‘Hi_D’ is a high-pass filter. ↑2 means inserted zeroes at odd-indexed elements while ↓2 shows down sampling.
27
k k j k j k k j n j a k n g d a k n h a , 1 , , 1 , ) 2 ( ) 2 ( (2.7)where h and g represent scale function and wavelet function, respectively. aj,n is the smooth
coefficient of jth layer and dj,nis the detail coefficient of jth layer.
↑2 ↓2 aj,n
aj-1,n
Lo_D Lo_R
↑2 ↓2 dj,n
Hi_D Hi_R
+
aj,n
Figure 2-4. Schematic flow of wavelet packet decomposition and reconstruction.
Step 2: Acoustic signal wavelet threshold filtering
The wavelet coefficients calculated by a wavelet packet represent the variation in the time series at a particular resolution. The high-frequency part of initial sound signals, which is decomposed by N scaling wavelet packets, will be threshold quantized with either hard thresholding or soft thresholding. Because soft threshold can avoid discontinuity points after the wavelet packets coefficients being quantized, we used soft thresholding in the experiments according to equation (2.8).
k j k j k j k j k j sign , , , , , , 0 , ) (
~ (2.8)
where λ is de-noising threshold value and ωj,kindicates high- frequency coefficients.
Step 3: Acoustic sound wavelet pocket reconstruction
The decomposition coefficients are reconstructed at this step based on their related frequencies. The reconstruction formula is shown in (2.9)
k jk
k jk
n
j h n k a g n k d
a 1, ( 2 ) , ( 2 ) , (2.9)
28
coefficient of j-1th layer and dj-1,n is the detail coefficient of j-1th layer.
The selection of the wavelet type directly affects the wavelet packet filtering effect in the process of filtering. Following several simulations and using different orders of Daubechies (DB) wavelets, it was found that using the db-4 wavelet as the fundamental function provides the best root mean square (RMS) error; the function has a scaling level of 3, which indicates an 8-dimensional eigenvector. Table II illustrates a comparison of different filtering wavelets. The solid red curves in Fig. 2-3 show the filtered acoustic noise waveform. It can be seen that the background noises are filtered to a certain degree by using WPT and the filtered acoustic noise (red solid curves) become relatively smooth and continuous, thus they become easier to process in further steps.
TABLE2-2PERFORMANCE OF DIFFERENT TYPES OF WAVELETS
Wavelet RMS Wavelet RMS Wavelet RMS
DB -1 9.349 DB -5 10.494 DB -9 9.458
DB -2 13.467 DB -6 8.656 DB -10 7.639
DB -3 6.672 DB -7 13.265 DB -11 5.347
DB -4 3.169 DB -8 6.923 DB -12 12.255
2.3.2 The Loudness of Acoustic Noise under Demagnetization
The loudness of noise is typically defined as an attribute of auditory sensation that can be ordered on a scale ranging from quiet to loud [78]. Specific loudness N’ can be expressed as follows [79]:
0.08 0.5 0.5 1 23 . 0 23 . 0 0 TQ TQ E E E E
N (2.10)
where ETQ is the excitation at threshold in quiet, E0is the excitation that corresponds to the
reference sound intensity I0=10-12 W/m2, and E is the exciting value corresponding to the
calculated sound.
![Figure 1-3. The rotor and stator of a designed interior permanent magnet synchronous machine [3]](https://thumb-us.123doks.com/thumbv2/123dok_us/1366721.1169430/21.612.158.493.70.312/figure-stator-designed-interior-permanent-magnet-synchronous-machine.webp)
![Figure 1-6. Temporal evolution of the phase currents in case of demagnetization [21].](https://thumb-us.123doks.com/thumbv2/123dok_us/1366721.1169430/28.612.129.519.76.305/figure-temporal-evolution-phase-currents-case-demagnetization.webp)