ISSN(Online): 2320-9801
ISSN (Print): 2320-9798
I
nternational
J
ournal of
I
nnovative
R
esearch in
C
omputer
and
C
ommunication
E
ngineering
(An ISO 3297: 2007 Certified Organization)
Vol. 4, Issue 4, April 2016
Retail Data warehouse Customer Analytics
using ElegantJ BI
B.Sarathkumar1, C Kamaraj 2
, P Saravanakumar3
Student/Research Scholar, Dept. of I.T., SRM University, Chennai, Tamilnadu, India 1
Assistant Professor, Dept. of Computer Applications, H.K.R.H College, Uthamapalayam, Tamilnadu, India 2
Assistant Professor/ Research Scholar, School of Information Technology, SRM University, Sikkim, India 3
ABSTRACT: In today's competitive environment, analyzing data to predict market trends and to improve organizational performance is an important business activity. As businesses continue to use Information Technology (IT) for a growing number of functions, the firms face the challenge of processing and analyzing huge amounts of data and turning them into profits. In response, the retail industry in particular is trying to revisit and upgrade its business strategies by introducing Business Intelligence (BI) and Data Warehousing (DW). DW is becoming necessary nowadays for the retail sector in India and is widely accepted for state-of-the-art decision support. This project is used to deliver a solution in the area of BI and DW for our Retail Giant Client in India. The paper offers the case handling, DW and BI architecture of our client by focusing on and identifying the business challenges to maintain its vision.
Customer analytics is a process by which data from customer behaviour is used to help make key business decisions via market segmentation and predictive analytics. This information is used by business foe direct marketing, site selection, and customer relationship management. Marketing provides services in order to satisfy customers. With that in mind, the productive system is considered from its beginning at the production level, to the end of cycle, the consumer. Customer analytics is playing a very important role in prediction customer data and implementing it into some reports.
KEYWORDS: Retail Management; Data warehouse; Business Intelligence (BI); Customer Analytics; ElegantJ BI, Key Performance Indicator (KPI), Decision Support System (DSS).
I. INTRODUCTION
A data warehouse is a repository of an organization's electronically stored data. Data warehouses are designed to facilitate reporting and analysis .This definition of the data warehouse focuses on data storage. However, the means to retrieve and analyze data, to extract, transform and load data, and to manage the data dictionary are also considered essential components of a data warehousing system. [1] Many references to data warehousing use this broader context. Thus, an expanded definition for data warehousing includes business intelligence tools, tools to extract, transform, and load data into the repository, and tools to manage and retrieve metadata.
ISSN(Online): 2320-9801
ISSN (Print): 2320-9798
I
nternational
J
ournal of
I
nnovative
R
esearch in
C
omputer
and
C
ommunication
E
ngineering
(An ISO 3297: 2007 Certified Organization)
Vol. 4, Issue 4, April 2016
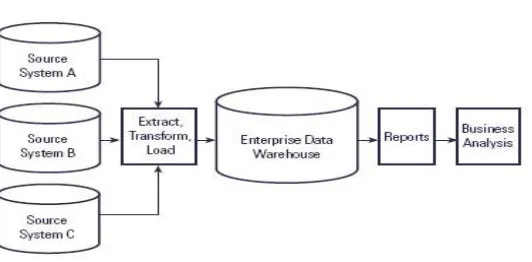
Fig 4. Data warehouse architecture
The top-down design methodology generates highly consistent dimensional views of data across data marts since all data marts are loaded from the centralized repository. Top-down design has also proven to be robust against business changes. Generating new dimensional data marts against the data stored in the data warehouse is a relatively simple task. The main disadvantage to the top-down methodology is that it represents a very large project with a very broad scope. The up-front cost for implementing a data warehouse using the top-down methodology is significant, and the duration of time from the start of project to the point that end users experience initial benefits can be substantial.
II. RELATED WORK
In [2] authors Analysing the process of map tasks in Hadoop, the serial execution of data transmission and data processing is discovered to cause overhead when the input data is not local. The proposed data prefetching mechanism overlap data transmission with data processing Parameters including map processing time, data transmission time, total input data size and input split size of map tasks in experimental applications are also varied to simulate different conditions. The experiment results show that up to 94% data transmission time is reduced and up to 15% performance improvement in jobs’ execution is achieved with the proposed mechanism [3]. Size of data grows; traditional distributed log data processing systems are not able to processing massive log data from different applications with millions of users. This paper proposes a mass log data processing and data mining methods based on Hadoop to achieve scalability and performance. The model, process, architecture, and implementation of the data processing and mining methods are proposed, and the experimental results is shown and analyzed to prove the effectiveness of the methods
.
Analysing the process of map tasks in Hadoop, the serial execution of data transmission and data processing is discovered to cause overhead when the input data is not local. The proposed data prefetching mechanism overlap data transmission with data processing Parameters including map processing time, data transmission time, total input data size and input split size of map tasks in experimental applications are also varied to simulate different conditions. The experiment results show that up to 94% data transmission time is reduced and up to 15% performance improvement in jobs’ execution is achieved with the proposed mechanism [4].Size of data grows; traditional distributed log data processing systems are not able to processing massive log data from different applications with millions of users. This paper proposes a mass log data processing and data mining methods based on ElegantJ BI to achieve scalability and performance. The model, process, architecture, and implementation of the data processing and mining methods are proposed, and the experimental results is shown and analyzed to prove the effectiveness of the methods [5].III.PROPOSED SYSTEM
A. Design and Developments:
Initial Design of Enterprise Data Architecture & DW Framework to meet business reporting needs.
Design & build of the DW/analytical reporting applications for CUSTOMER ANALYTICS
ISSN(Online): 2320-9801
ISSN (Print): 2320-9798
I
nternational
J
ournal of
I
nnovative
R
esearch in
C
omputer
and
C
ommunication
E
ngineering
(An ISO 3297: 2007 Certified Organization)
Vol. 4, Issue 4, April 2016
Integrate history data from legacy source systems into DW for the trend analysis and reporting.
B. Features of ElegantJ BI:
ElegantJ BI [7] Balanced Scorecard is a Corporate Performance Management System for establishing and communicating an organization’s vision, mission, and strategy to stakeholders and employees, and for aligning operations to the strategy. It helps you define your corporate strategy, and then map it to objectives and measures linked to business units, teams and individuals for performance management. It is built on a performance management approach that focuses on various performance indicators, including customer perspective, internal business processes, learning& growth and finance, to monitor progress toward organization's strategic goals. Further, it brings you snapshot view of organisational performance combined with rich scorecard functionality with reports, charts, graphs, and analysis tools to enable you to evaluate relationships between key performance indicators (KPIs) and tangible business objectives.
Corporate Performance Management and Performance Measurement System ElegantJ BI’s Business Balance Score cards system lets you efficiently manage your organization's performance by understanding, optimizing, and aligning organizational units, business processes, teams and individuals, to keep you on set targets.
Supports Strategic Planning & Goal Setting
Tracks Progress towards Goals using Metrics
Improves employee Accountability & Team Goals
Facilitates Improvement Initiatives to address Performance Gaps
C. BI Dashboards:
Dashboards give key decision makers- executives, managers and analysts the unified view of key performance metrics, graphical analysis and business reports in a truly interactive environment. With metrics users can easily track business performance at-a-glance through performance dashboards. ElegantJ BI’s dashboard software can provide them answers to critical business issues to quickly assess situations and drive business efficiently through dashboard reporting. Web-based ElegantJ BI provides interactive key performance indicator dashboards and balanced scorecard dashboards to let employees and executives monitor measure and share key performance metrics instantly to view the critical business information from anywhere, anytime. [8] This balanced scorecard dashboard software is the simplest, easy-to-use, and convenient way to access critical performance across the enterprise.
Comprehensive product that provides a complete portfolio of business intelligence capabilities to help organisations consolidate and drain streamlined quality information to manage core strategies and improve performance management. Unifying web-based analytics, dynamic reporting and business intelligence on an integrated, state-of-the-art architecture, it provides complete BI functionality directly to the browser, bringing the freedom and flexibility for anytime, anywhere access to business critical information! Simplicity. Less training and quicker user take-up Practicality, Implement in weeks, not months Affordability Scalable BI within the scope of budget
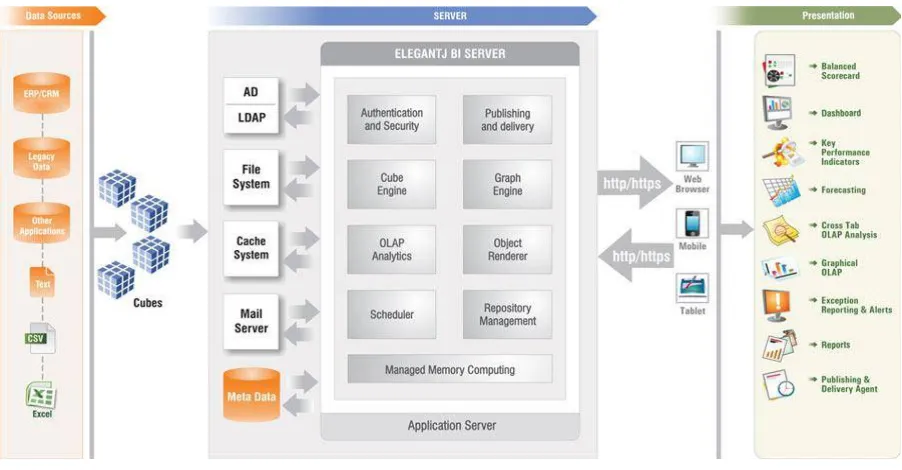
D. BI Graphical OLAP:
Fg.2 refers the Business Intelligence (BI) OLAP software ElegantJ BI empowers executives, managers,
and analysts to explore, analyse, and extract interesting patterns from enormous amount of data stored as enterprise data assets. Allowing you to visualize results graphically on your personalised online dashboards, business intelligence reports and business intelligence alerts that can lead more quickly to new insights.
ISSN(Online): 2320-9801
ISSN (Print): 2320-9798
I
nternational
J
ournal of
I
nnovative
R
esearch in
C
omputer
and
C
ommunication
E
ngineering
(An ISO 3297: 2007 Certified Organization)
Vol. 4, Issue 4, April 2016
E. BI Reports:
In today’s era of global e-business, every organisation needs up-to-date business reports in varied templates,
sometimes in different languages. With enterprise reporting and performance reporting system ElegantJ BI Reports, your web-based business intelligence reports are ready to be delivered to anyone who needs to get the information they want within minutes!
With BI reporting and performance reporting software ElegantJ BI, you just point-and-click and drag-and-drop to instantly summarize all your performance metrics, operational data and create dynamic, customized performance reports to meet the entire spectrum of your reporting needs.
Fig 2. ElegantJ BI architecture
F. Data Extraction Software and Cube Management Solution:
ElegantJ BI allows companies to Extract, Load and Transform (ETL) through easy to use graphical interface. They can extract value from data that today can be inaccessible within your various business applications. While providing you the desired flexibility through a single, powerful web-based unified ElegantJ BI’s Business Intelligence Platform, you can have integrated views of business intelligence data from across heterogeneous data. By easy-to-use interactive wizard or through SQL query, different sources can be mapped to multi-dimensional ‘cubes’ from practically anywhere.
Subject-oriented
Non-volatile
Integrated
Time-variant
Easy and fast to access
Adhoc queries
Complex calculations
ISSN(Online): 2320-9801
ISSN (Print): 2320-9798
I
nternational
J
ournal of
I
nnovative
R
esearch in
C
omputer
and
C
ommunication
E
ngineering
(An ISO 3297: 2007 Certified Organization)
Vol. 4, Issue 4, April 2016
Scalability
Independence
G. Data Warehouse Testing:
Categories of Data Warehouse testing include different stages of the process. The testing is done on individual and end to end basis. Good part of the testing of data warehouse testing can be linked to 'Data Warehouse Quality Assurance'. Data Warehouse Testing will include the following stages
Stage 1: Extraction Testing:
Data is able to extract the required fields.
The Extraction logic for each source system is working
Extraction scripts are granted security access to the source systems.
Updating of extract audit log and time stamping is happening.
Source to Extraction destination is working in terms of completeness and accuracy.
Extraction is getting completed within the expected window.
Stage 2: Transformation Testing:
Transaction scripts are transforming the data as per the expected logic.
The one time Transformation for historical snap-shots are working.
Detailed and aggregated data sets are created and are matching.
Transaction Audit Log and time stamping is happening.
There is no pilferage of data during Transformation process.
Transformation is getting completed within the given window
Stage 3: Loading Testing:
There is no pilferage during the Loading process.
Any Transformations during loading process is working.
Data set in staging to loading destination is working.
One time historical snap-shots are working.
Both incremental and total refresh are working.
Stage4: End User Browsing and OLAP Testing:
The Business views and dashboard are displaying the data as expected.
The scheduled reports are accurate and complete.
The scheduled reports and other batch operations like view refresh etc. is happening in the expected window.
'Analysis Functions' and 'Data Analysis' are working.
There is no pilferage of data between the source systems and the views.
Stage 5: Ad-Hoc Query Testing
Ad-hoc queries creation is as per the expected functionalities.
ISSN(Online): 2320-9801
ISSN (Print): 2320-9798
I
nternational
J
ournal of
I
nnovative
R
esearch in
C
omputer
and
C
ommunication
E
ngineering
(An ISO 3297: 2007 Certified Organization)
Vol. 4, Issue 4, April 2016
Stage 6: Down Stream Flow Testing
Data is extracted from the data warehouse and updated in the down-stream systems/data marts.
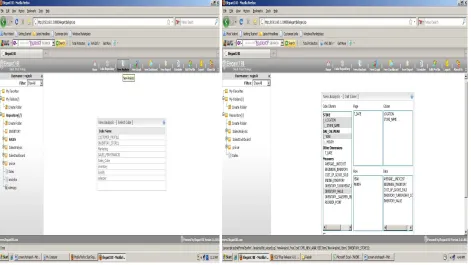
IV.SIMULATION RESULTS
Fig 3 shows to create cube database cube profile. Dimension map, access permissions and cube management will be done in this module. Fig 4 includes a web based analysis solution that delivers secure, self-service access to dataand intuitive analytical analysis by using various filters and functions.fig 5 has various dashboard functions and export the files by using PDF,XML,CSVand JPG format.fig 6 used to creating a delivery and publishing agent scheduler profile.
ISSN(Online): 2320-9801
ISSN (Print): 2320-9798
I
nternational
J
ournal of
I
nnovative
R
esearch in
C
omputer
and
C
ommunication
E
ngineering
(An ISO 3297: 2007 Certified Organization)
Vol. 4, Issue 4, April 2016
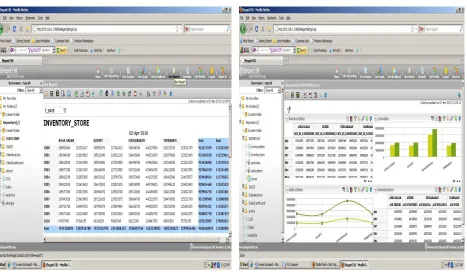
Fig. 5. Retail Store Customer and Inventory Report Fig 6. ElegantJ BI Reports
V. CONCLUSION AND FUTURE WORK
The simulation results showed that the proposed tool performs entire paper of Customer analytics in retail has developed using the concept of data warehouse ,elegantJ BI tool and oracle. The paper uses the ElegantJ BI for query, analysis and reporting. Oracle is for the database and Excel is for creating CSV profiles. the development of the paper the concept of data warehousing, and oracle were enriched the application. And building various data flow diagram and activity diagram helped to understand the design concepts and the project standards. The paper “Customer Analytics in retail data warehouse ’’was successfully built and deployed .The Paper is considered as success provided all the KPI’s are delivered and works functionally correct as described. Client can sent the document in any file format. But it can be converted either CSV&DATABASE. Elegantj BI a reporting tool used for providing decision making in various environment rather than for transaction purpose. Cube must be created by admin. But without creating cube we cannot processed for reporting. This paper contains all the basic requirements and it’s also fulfils future requirements. It also helps for scalability
REFERENCES
1. Puneet Agarwal, Gautam Shroff, Pankaj Malhotra, “Approximate Incremental Big-DataHarmonization”, IEEE Transaction on Bigdata Congress, Vol 5, Issue No 2, June 2013.
2. Hongyong Yu, Deshuai Wang Proc., “ Mass Log Data Processing and Mining Based on Hadoop and Cloud Computing ”, Computer Science Education (ICCSE 2012)July 14-17, 2012.Melbourne, Australia
3. Guozhang Wang, Marcos Vaz Salles, Benjamin Sowell, Xun Wang, Tuan Cao, Alan Demers, Johannes Gehrke, "Behavioral Simulations in Map Reduce", Walker White Procedings of VLDB endorsement Vol 3 No 1 2012
4. Aysan Rasooli Oskooei, “Improving Scheduling in Heterogeneous Grid and Hadoop Systems”, Open Access Desertions and Theses,May 2013.
5. Ge Song, Zide Meng, Fabrice Huet, Frederic Magoules, Lei Yuffi and Xuelian Lin, “ A Hadoop Map Reduce Performance Prediction Method”, International Journal of Computer Applications & Information Technology, Vol 2, Issue No 2, Mar 2013.
6. R.Iswarya, P.Saravana Kumar, “NFTaaS on Cloud“, International Journal of Latest Trends in Engineering and Technology , Vol 4, Issue 1, May 2014
ISSN(Online): 2320-9801
ISSN (Print): 2320-9798
I
nternational
J
ournal of
I
nnovative
R
esearch in
C
omputer
and
C
ommunication
E
ngineering
(An ISO 3297: 2007 Certified Organization)
Vol. 4, Issue 4, April 2016
Technology, Vol 4, Issue 1, May 2014.
8. P.Saravana Kumar, M.Parvathi, M.Kanmani, “Efficient Method for Preventing SQL Injection Attacks on Web Applications Using Encryption and Tokenization”, International Journal of Latest Trends in Engineering and Technology, Vol 4, Issue 1, Nov 2014 9. Puneet Agarwal, Gautam Shroff, Pankaj Malhotra, “Approximate Incremental Big-DataHarmonization”, IEEE Transaction on Bigdata Congress, Vol 5, Issue No 2, June 2013.
BIOGRAPHY
Sarathkumar.B is an M.Sc Student/Research Scholar in the School of Information Technology Department, SRM University, Chennai, India. He received Bachelor of Science in Information Technology (B.Sc) degree in 2015 from SLCS (Madurai Kamaraj University), Madurai, India, His research interests are Data Mining, Mobile Computing, Image processing, Cloud Computing and Big Data Analytics etc.
Kamaraj.C is an Assistant Professor in the Commerce with Computer Application Department, H.K.R.H. College, Uthamapalayam, India. He received Master of Computer Applications (MCA) in 2014 from Madurai Kamaraj University, Madurai, India, He received Master of Business Administration (MBA-HR) in 2015 from Manonmaniam Sundaranar University, Thirulaveli, India. His research interests are Data Mining, Web Mining, Cloud Computing and Big Data Analytics etc.
Saravanakumar.P is an Assistant Professor / Research Scholar / Placement Coordinator in the School of Information Technology Department, SRM University, Sikkim, India. He received Master of Technology (M.Tech) CSE degree in 2015 from SRM University, Chennai, India, Master of Philosophy in Computer Science (M.Phil) degree in 2011 from PRIST University, Tanjore, India, Master of Computer Applications (MCA) degree in 2010 from SRM University, Chennai, India, and Pursuing Master of Business Administration (MBA-HR) in Manonmaniam Sundaranar University, Thirulaveli, India. His research interests are Data Mining, Image Processing, Cloud Computing and
Big Data Analytics etc.
Photograph