Weather Prediction using Linear Regression
& Support Vector Machine vide Big Data
Kavita Devi 1, Nandani Shrama 2
P.G. Student, Department of Computer Science & Engineering, SRCEM, Palwal, Haryana, India1 Assistant Professor, Department of Computer Science & Engineering, SRCEM, Palwal, Haryana, India 2
ABSTRACT: The whole world is plagued by the dynamical clement and their facet, to cut back this facet effects up to some extent there are several techniques and algorithms through which we will predict the weather on the ready reference along with respective context of given information from past years example temperature, dew, humidity air pressure and wind direction, . When doing the analysis of existing data from past few years we inculcated the proposed scheme or techniques which have a tendency to conclude that, machine learning paradigm and permits us to research the given set of knowledge and extract the helpful information from the given dataset, thus so as to grasp the unsteady patterns of climatic conditions, a prognosticative model is also persuaded. During this paper or scheme, we have a tendency to explore progressive statistical linear regression and support vector machine techniques of machine learning that teams’ constant kind information sets along and to prefigure the forecast or weather prediction. Under the proposed scheme we have a tendency to inculcate the augmented algorithmic rule that provides approximate and nearby results to forecast the climate for the next 5 days and at the end results are calculated on the idea of mathematical and statistical decision tree and conditions vide confusion matrix for more appropriate and accurate forecasting using Big Data.
KEYWORDS: Linear Regression, Support Vector Machine, Decision Tree, Confusion Matrix, Machine Learning, Big Data.
I. INTRODUCTION
Data mining using machine learning are the way toward extracting important data from the extensive informational collection. The procedure of concentrate important data portrayed as information revelation that can be connected on any extensive informational index. The primary data mining systems using machine learning are Classification, Clustering, Association and Regression. The distinctive Data digging methods utilized for taking care of climate changing and measuring issue. Climate measuring issue incorporate expectation of temperature, rain, mist, winds, and storm and so forth. Climate sensors gather information consistently at numerous areas and assemble tremendous information. Climate anticipating is dependably a major test since it is difficult to foresee the condition of the air for the forthcoming future since atmosphere dataset is capricious and again day to day changes as indicated by worldwide atmosphere changes in context to past scenarios. The information utilized is from the INDIA METEOROLOGICAL DEPARTMENT (IMD), the arrangement of dataset bolsters a rich arrangement of meteorological components, which are great contender for investigation with huge information since it is semi-organized and record situated. The term Big Data came around 2005, which implies datasets that are tremendous, moreover high in collection and speed, which makes them difficult to process using ordinary devices and frameworks. Huge information made colossal business and social open doors in each field, empowering the revelation of beforehand shrouded designs and the advancement of new bits of knowledge to decide, running from web hunt to content proposal and computational scenarios. The term Big Data is presently utilized wherever in our everyday life and it is a present innovation and furthermore going to manage the world in future and has risen on the grounds that individuals and diverse organizations makes expanding utilization of information concentrated advancements. Huge information sizes are right now extending from a Terabyte (TB or 1012 or 240) to Zettabyte ( ZB or 1021 or 270) in a solitary informational collection. Like the physical universe, the advanced universe is huge. As per look into led by IDC, from 2005 to 2020, the advanced universe will develop from 130 Exabytes to 40,000 Exabyte's, or 40 trillion gigabytes. From now, the advanced universe will about twofold at regular intervals until 2020. As expressed by IBM, with machine-to-machine(M2M) correspondences, on the web/portable informal communities and unavoidable handheld gadgets it makes 2.5 quintillion bytes of information in every day — so much that 90 level of the data on the planet today has been made over the latest two years alone.
Attributes of Big data– Big Data has numerous qualities or properties specified by n V's qualities. Set of V's attributes of the Big Data were gathered from various scientist's productions to have Nine V's qualities (9V's attributes). These 9V's qualities are: (Veracity, Variety, Velocity, Volume, Validity, Variability, Volatility, Visualization and Value).
1. Veracity: Enormous Data veracity alludes to the inclinations, commotion, and irregularity in information.. 2. Variety: Organized, semi-organized, and unstructured information other than content and more information
composes have risen, for example, record, log, sound, and half and half information.
3. Velocity: The developed or made data at a speedier pace than some time recently, in which the distinctive channels of Big Data increment the yield content.
4. Volume: the measure of information is known as volume of information, where the measure of information keeps on detonating.
5. Validity: the information is right and exact for the planned utilize. Unmistakably, legitimate information is the way to settling on the correct choices.
6. Variability: the information streams might be exceedingly conflicting with intermittent pinnacles, every day, regular, and occasion activated pinnacle information burdens can be trying to oversee, particularly with unstructured information included.
7. Volatility: When maintenance period lapses, we can without much of a stretch crush it.
8. Visualization: implies complex charts that can incorporate a few factors of information while as yet staying justifiable and lucid
II. RELATEDWORK
Related works included a wide range of and fascinating systems to attempt to perform climate figures. While a lot of current determining innovation includes reenactments in light of material science and differential conditions, numerous new methodologies from computerized reasoning utilized essentially machine learning strategies, generally neural systems while some drew on probabilistic models, for example, Bayesian systems. Out of the three papers on machine learning for climate expectation we inspected, two of them utilized neural systems while one utilized help vector machines. Neural systems appear to be the prominent machine learning model decision for climate determining on account of the capacity to catch the non-direct conditions of past climate patterns and future climate conditions, dissimilar to the straight relapse and practical relapse models that we utilized. This gives the upside of not accepting basic direct conditions of all highlights over our models. Of the two neural system approaches, one [3] utilized a mixture demonstrate that utilized neural systems to show the material science behind climate estimating while the other [4] connected adapting all the more specifically to anticipating climate conditions. Likewise, the approach utilizing bolster vector machines [6] additionally connected the classifier straightforwardly for climate forecast yet was more restricted in scope than the neural system approaches. Different methodologies for climate guaging included utilizing Bayesian systems. One intriguing model [2] utilized Bayesian systems to model and make climate expectations however utilized a machine learning calculation to locate the most ideal Bayesian systems and parameters which was computationally costly due to the substantial measure of various conditions yet performed extremely well. Another approach [1] concentrated on a more particular instance of anticipating extreme climate for a particular topographical area which restricted the requirement for calibrating Bayesian system conditions however was constrained in scope.
Hadoop: Hadoop is generally utilized as a part of enormous information applications in the business, e.g., spam separating, organize looking, click-stream investigation, and social suggestion. What's more, extensive scholastic research is presently in view of Hadoop. Some illustrative cases are given underneath. As proclaimed in June 2012, Yahoo runs Hadoop in 42,000 servers at four server farms to help its items and administrations, e.g.,searching and spam separating, and so on. At introduce, the greatest Hadoop bunch has 4,000 hubs, yet the quantity of hubs will be expanded to 10,000 with the arrival of Hadoop 2.0. Around the same time, Facebook reported that their Hadoop bunch can process 100 PB information, which developed by 0.5 PB for every day as in November 2012. Some outstanding offices that utilization Hadoop to lead appropriated calculation are recorded in [13]. What's more, numerous organizations give Hadoop business execution as well as help, including Cloudera, IBM, MapR, EMC, and Oracle. As indicated by the Gartner Research, Bigdata Analytics is a slanting subject in 2014 [14]. Hadoop is an open system generally utilized for Bigdata Analytics. MapReduce is a programming worldview related with the Hadoop.
III.LITERATURESURVEY
A. Adamu Galadima portrays a short take a gander at the Arduino microcontroller and some of its applications and how it can be utilized as a part of learning. Arduino is an open source microcontroller utilized as a part of electronic prototyping. Arduino equipment and its segments might be taken a gander at. Programming and the Environment that Arduino keeps running on are both taken a gander at as well. A few applications will be taken as illustrations that can help make learning Arduino additionally fascinating. This can be utilized as a noteworthy method to urge understudies and others to take in more about gadgets and programming.
B. Jeffrey Cohen display information parallel calculations for advanced factual systems, with an emphasis on thickness strategies. At last, he responds on database framework includes that empower deft outline and adaptable calculation improvement utilizing both SQL and Map Reduce interfaces over an assortment of capacity instruments.
C. Brian Dolan display the outline rationality, methods and experience giving MAD examination to one of the world's biggest promoting systems at Fox Audience Network, utilizing the Green plum parallel database framework. We depict database plan approachs that help the light-footed working style of examiners in these settings.
grained control over their utilization information, and also the capacity To break down this information with calculations of their picking, including outsider applications that investigate that information in a protection saving style.
E. Jeffrey Dean depicts the essential programming model and gives a few cases. Numerous genuine errands are expressible in these models. Usage of Map Reduce keeps running on an extensive bunch of ware machines and is exceptionally adaptable: a regular Map Reduce calculation forms numerous terabytes of information on a huge number of machines. Software engineers and the framework simple to utilize: several Map Reduce programs have been actualized and upwards of one thousand Map Reduce employments are executed on Google's bunches each day.
F. Panagiotis D. Diamantoulakis implements the Big Data Analytics for Dynamic Energy Management in Smart Grids. The smart electricity grid enables a twoway flow of power and data between suppliers and consumers in order to facilitate the power flow optimization in terms of economic efficiency, reliability and sustainability. This infrastructure permits the consumers and the micro energy producers to take a more active role in the electricity market and the dynamic energy management (DEM). The most important challenge in a smart grid (SG) is how to take advantage of the user’s participation in order to reduce the cost of power.
G. L. Aniello investigate the possibility of a structure utilizing various information sources to enhance assurance capacities of CIs. Difficulties and openings are examined along three fundamental research bearings: I) utilization of particular and heterogeneous information sources, ii) checking with versatile granularity, and iii) assault demonstrating and runtime mix of various information examination procedures.
IV.PROPOSEDALGORITHM
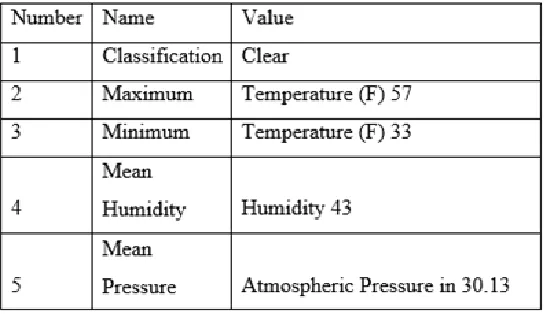
The most outrageous temperature, slightest temperature, mean clamminess, mean barometrical weight, and atmosphere gathering for consistently in the years 2011-2015 for Delhi, India were gained from Weather Underground. [7] Originally, there were nine atmosphere orders: clear, scattered fogs, to some degree shady, generally shady, dimness, overcast, rain, tempest, and snow. Since an extensive parcel of these requests are practically identical and some are meagrely populated, these were diminished to four atmosphere groupings by joining scattered fogs and not entirely shady into sensibly shady; generally shady, foggy, and shady into extraordinarily shady; and rain, tempest, and snow into precipitation. The data from the underlying four years were used to set up the counts, and the data from the latest year was used as a test set and the alluded data for January using the table 1 depicted parameters
The essential count that was used was straight backslide, which tries to suspect the high and low temperatures as an immediate blend of the features. Since straight backslide can't be used with gathering data, this computation did not use the atmosphere course of action of consistently. As needs be, only eight features were used: the best temperature, minimum temperature, mean moistness, and mean climatic weight for each of the past two days. In this way, for the I-th join of consistent days, x (I) ∈ R9 is a nine-dimensional component vector, where x0 = 1 is portrayed as the square term. There are 14 adds up to be expected for each join of consecutive days: the high and low temperatures for each of the accompanying seven days. Let y (I) ∈ R 14 imply the 14-dimensional vector that contains these sums for the I-th match of progressive days utilizing direct relapse and further utilizing help vector machine arrangement limit the blunder work utilizing:
subject to the constraints:
For this type of SVM the error function is: which we minimize subject to:
Figure1 : The work flow model of the proposed scheme depicting Raw Dataset in Hadoop Distributed File System thereinafter using Hive ORDBMS module for Data Migration, Subsequent use of Map and Reduce for distinct Dataset
Aim of the proposed algorithm is to maximize the network life by minimizing the total transmission energy using energy efficient routes to transmit the packet. The proposed algorithm is consists of three main steps.
V. DESIGN AND IMPLEMENTATION
To gain the desired goals and results in proposed scheme the probalastic scenarios i.e. linear regression and SVM have be used via Big Data MapReduce. The below steps depicts the workflow and implementation of proposed scheme.
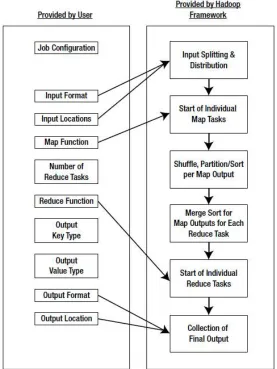
Step 1. Map Reduce using Big Data (Hadoop)
Figure 2 : Map and Reduce Architecture based on Tasks and Functions like Map, Shuffle, Sort and Reduce using Parallel Processing based on Hadoop Distributed File System and Multitasks Scheduled by Cluster’s .
Step 2 Linear Regression :
scheme. In erstwhile expression, of the 7800 rows forming the data cluster is formerly selected for use in this study below depicts the linear regression model. The righteousness of fit character for the model calibrations are obtainable in below equation, and the calibrated coefficients are shown in table 4. However presents standard error (Se) calculated
as:-
Step 3 Support Vector Machine :
The Linear regression only shows the 2-dimensional model based on confusion matrix case where the data points are linearly separable. The mathematics of the problem to be solved is the following Support Vector Machine equation. However, The essential count that was used was straight backslide, which tries to suspect the high and low temperatures as an immediate blend of the features. Since straight backslide can't be used with gathering data, this computation did not use the atmosphere course of action of consistently. As needs be, only eight features were used: the best temperature, minimum temperature, mean moistness, and mean climatic weight for each of the past two days. In this way, for the I-th join of consistent days, x (I) ∈ R9 is a nine-dimensional component vector, where x0 = 1 is portrayed as the square term. There are 14 adds up to be expected for each join of consecutive days: the high and low temperatures for each of the accompanying seven days. Let y (I) ∈ R 14 imply the 14-dimensional vector that contains these sums for the I-th match of progressive days utilizing direct relapse and further utilizing help vector machine arrangement limit the blunder work utilizing:
For this type of SVM the error function is:
which we minimize subject to:
Algorithm Model of Step 3
VI.SIMULATIONRESULTS
using Linear Regression to find the Intecept, Slope, Residual Sum of Square, Regressed Sum of Square as regressed values finally using Support Vector Machine for classification and results.
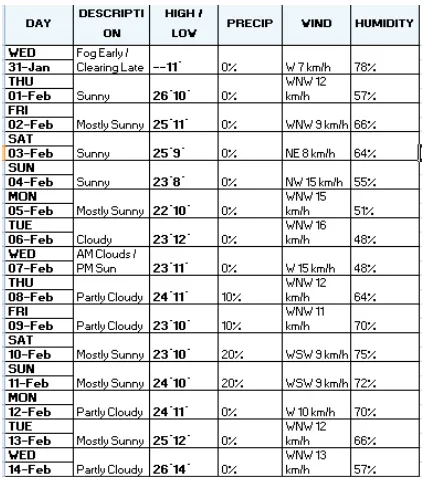
Figure 3 : Results derived for Weather Prediction using Linear Regression & Support Vector Machine vide Big Data based on Confusion Matrix comprising Description, Temperature, Perception, Wind Direction and Humidity.
VII. SIMULATIONRESULTS
Both machine learning algorithms using hadoop lead realistic perfection were outflanked by proficient climate or weather determining directions or forecasting, in spite of the fact that the error in their execution diminished altogether for later days approx next 5 days, demonstrating that over longer timeframes, our models may beat proficient ones. Direct relapse turned out to be a low inclination, high change display while useful relapse ended up being to be a high predisposition, low difference demonstrate. Results are intrinsically a high and accurate as demonstrated as it is steady for exceptions and forecasting, so one approach to enhance the straight relapse show is by accumulation of more information using linear regression and SVM. Showing that the decision of model was efficient and effective that its expectations can be enhanced by promote accumulation of information under the proposed scheme. For future scope the same can be incorporated over apache spark for concurrent prediction of weather whereas the same can be compare with the results obtained from sensors.
REFERENCES
[1] Abramson, Bruce, et al. Hailfinder, A Bayesian system for forecasting severe weather.”International Journal of Forecasting12.1 (1996): 57-71.
[2] Cofno, Antonio S., et al. ”Bayesian networks for probabilistic weather prediction.”15th Eureopean Conference on Artificial Intelligence (ECAI). 2002.
[3] Krasnopolsky, Vladimir M., and Michael S. FoxRabinovitz. ”Complex hybrid models combining deterministic and machine learning components for numerical climate modeling and weather prediction.”Neural Networks19.2 (2006): 122-134.
[4] Lai, Loi Lei, et al. ”Intelligent weather forecast.”Machine Learning and Cybernetics, 2004. Proceedings of 2004 International Conference on. Vol. 7. IEEE, 2004.
[6] Radhika, Y., and M. Shashi. ”Atmospheric temperature prediction using support vector machines.”International Journal of Computer Theory and Engineering1.1 (2009): 55.
[7] Stanford, CA in Weather Underground, The Weather Company, 2016. [Online]. Available: https://www.wunderground.com/us/ca/paloalto/zmw:94305.1.99999. Accessed: Nov 20, 2016.
[8] Stern, H. (2008), The accuracy of weather forecasts for Melbourne, Australia. Met. Apps, 15: 65?71. doi:10.1002/met.67
[9] Wang Y. and Banavar S. “Convective Weather Forecast Accuracy Analysis at center and sector levels”, NASA Ames Research center, Maffett Field, Califonia