ABSTRACT
HATCH, TYLER R. Experimental Investigation into Plasma-Assisted Lean Prevaporized Non-Premixed Ignition. (Under the direction of Dr.Venkateswaran Narayanaswamy).
Experimental Investigation into Plasma-Assisted Lean Prevaporized Non-Premixed Ignition
by Tyler R Hatch
A thesis submitted to the Graduate Faculty of North Carolina State University
in partial fulfillment of the requirements for the Degree of
Master of Science
Aerospace Engineering
Raleigh, North Carolina
2018
APPROVED BY:
_______________________________ _______________________________
Dr. Kevin Lyons Dr. Kenneth Granlund
_______________________________ Dr. Venkateswaran Narayanaswamy
ii DEDICATION
iii BIOGRAPHY
iv ACKNOWLEDGEMENTS
I would like to thank the many people who made this project possible. Specifically: my labmates Vikram Ramnath, Kevin Ley, Aravind Ramachandran, Dominic Zelenak, Joshua Pickles, Sai Kiran Bavgi; other students from NC State who assisted me with this project including Tyler Farr, Eric Stewart, and Alex Hsain; students from the KAUST program including Afnan Tolah, Rawan Al Yahya, and Adnan Alsadah; professors from NC State including Dr. Venkateswaran Narayanaswamy, Dr. Alexei Saveliev, Dr. Kenneth Granlund, Dr. Kevin Lyons and Dr. Tiegang Fang; several individuals from the NC State
v TABLE OF CONTENTS
LIST OF TABLES ... vii
LIST OF FIGURES ... viii
1. INTRODUCTION ... 1
2.PRIOR WORK... 6
2.1 Turbulent Spray Flames ... 6
2.2 Ignition Energy ... 8
3.EXPERIMENTAL METHODS... 14
3.1 Laboratory Facilities ... 14
3.2 HVAC Modifications ... 14
3.3 Incinerator Attachment ... 18
3.4 Initial Experiments ... 19
3.5 Methane Experiments ... 19
3.6 Experimental Setup ... 23
3.7 Experimental Procedure ... 33
3.8 What If? Scenarios ... 36
3.9 Boundary Conditions... 39
4. RESULTS AND DISCUSSION ... 41
4.1 Key Findings ... 41
4.2 Temperature Profile... 41
4.3 Ignition Probability ... 43
4.4 Mean Velocity Field Measurements ... 45
4.5 High-Speed Imaging ... 52
vi
4.7 Chemiluminescence ... 55
4.8 Applications and Future Work ... 57
5. CONCLUDING REMARKS ... 59
vii LIST OF TABLES
Table 1. Experimental Conditions for Methane Experiments . ... 20
Table 2. Technical specifications of the peristaltic pump and tubing... 30
Table 3. Technical Specifications for fuel lines and fittings. ... 31
Table 4. Insulation Technical Specifications ... 33
Table 5. “What If” Scenarios ... 37
viii LIST OF FIGURES
Figure 1. Spark ignition is one of the most fundamental methods of
combustion,where an electric spark is generated to trigger a chain
reaction of events leading to combustion of a fuel mix ..……… 20
Figure 2. In order for successful ignition, three criteria must be met. The flame requires an oxygen supply, a fuel source, and energy or heat
to ignite the mixture. ...30
Figure 3. The military has a need for one unified fuel that can withstand the
harsh environments faced at a forward operating base . ...4
Figure 4. Evolution of a flame from laminar to turbulent . ...5
Figure 5. Cutaway view of Mastorakos' burner unit, detailing where a single spark was sufficiently effective to ignite the fuel mixture. Farther out near the walls of the chamber, multiple sparks were required
for ignition. ...6
Figure 6. Diagram from Ballal and Lefebvre showing the minimum ignition energy versus electrode gap width. Their experimentes used
electrodes spaced apart at diferent distances ...8 Figure 7. Diagram of an atomizer nozzle. Flow is injected moving from right
to left and passes through swirling vanes, creating fine droplets at
the orifice. . ...20
Figure 8. Diagram of Shelby's experimental setup, where nitrogen is used as
a carrier gas for the fuel . ...20
Figure 9. Experimental Setup for Romero's work, using a syringe fuel
injector and heating tape to prevaporize the fuel . ...202
Figure 10. Exhaust Hood Modifications before (left) and after (right).. ... 205
Figure 11. AirFlow Instruments Velociy Meter (left) and Qizard Stick (right)
ix
Figure 12. Exhaust duct modification to connect burner with ventilation. . ... 16
Figure 13. Visualization of glycerin testing with additional ducting modifications. . ... 20
Figure 14. Methane incinerator attachment.. ... 20
Figure 15. Ignition Probability Maps for Methane Experiments. At left is ReD =5,780 and at right is ReD=9,500. Overlaid on the plots are the r/D radial locations of the rich (solid), stoichiometric (dashed), and lean (dash-dot) limits. ...20
Figure 16. Flame Luminosity (top) and Chemoluminescence (bottom) of ignition near the stoichiometric location. The luminosity profile shows the flame kernel development over time, while the CH* radical provides an indication of the flame front . ...220
Figure 17. Radial profiles of absorbed energy by the spark versus radial location outward. From left to right: ReD=1,085, 5,780, and 9,500. ...22
Figure 18. A validation study was performed to evaluate the correlation of a laser spark with an electrode gap spark system. ...33
Figure 19. JICF Burner used for the methane experiments. Slight modifications were made for the heavy fuel experiments. . ...24
Figure 20. Methane Incinerator Drawing. ... 25
Figure 21. Top and bottom ceramic honeycomb flame arrestors. ... 25
Figure 22. Methane incinerator with fire-stop putty to seal for leaks. ... 26
Figure 23. Peristaltic Pump and tubing (left) and Jet-A liquid fuel tank (right). ... 28
x Figure 25. Nitrogen was measured at separate flowmeters to account for losses
and calibrate the fuel injection line based on the differential flow
rates... ...320
Figure 26. Personal Protective Equipment (PPE) worn during experimentation. ... 20
Figure 27. Temperature Map Profile at a spark height of x/D = 20, taken across the entire width of the burner from r/D = -40 to 40. The
peak measured temperature was 303 K at r/D = 0. ...43
Figure 28. Ignition Probability at x/D=20 for Jet-A fuel at a 15:1 Nitrogen: Jet-A dilution ratio. The highest probability was directly above the
burner at 14%. ...45
Figure 29. PIV Velocity profile from DaVis for Case 1. This provides a full map of the velocity field, with a maximum measured velocity of 10 m/s at 12 mm above the jet. The shear layer can clearly be
observed at the sides of the higher velocity flowfield. ...47
Figure 30. Standard deviation of the PIV velocity profile from DaVis for Case 1. ... 48
Figure 31. PIV Velocity profile from DaVis for Case 2. This provides a full map of the velocity field, with a maximum measured velocity of 18 m/s at 8 mm above the jet. The shear layer can clearly be observed
at the sides of the higher velocity flowfield.. ...49
Figure 32. Standard deviation of the PIV velocity profile from DaVis for Case 2.. ... 50
Figure 33. Mean Velocity at spark height of x/D=20 for Case 1. The max
velocity was measured at 4.876 m/s. ...51
Figure 34. Mean Velocity at spark height of x/D=20 for Case 2. The max velocity was measured at 10.463 m/s... 52
Figure 35. High-speed images of the spark kernel formation and propagation at time t=0 seconds (left), t+0.03 seconds (center), t+0.06 seconds (right). The tip of the jet can be seen in the center image.Figure 32. Standard deviation of the PIV velocity profile from DaVis for Case
xi Figure 36. Flame luminosity images at x/D=40, r/D=0.667. The artifact on the
left side of each image is a reflection of the spark/kernel on the
quartz glass...55
1
1. INTRODUCTION
One of the most fundamental areas of research in combustion science is the creation of a flame through spark ignition in a fuel mixture. This phenomenon can be observed in both everyday scenarios such as driving an automobile, as well as larger-scale military applications such as flying an F/A-18 Hornet aircraft. Both applications rely on the same general concept: A small packet of energy is created (usually from a sparkplug) within a combustor filled with fuel (Figure 1). This energy raises the local temperature of the fuel to its adiabatic flame temperature, forming an ignition kernel that propagates outward into the mixture for a sustained flame and successful combustion [1].
Figure 1. Spark ignition is one of the most fundamental methods of combustion, where an electric spark is generated (top left) to trigger a chain reaction of events (top right)
2 A growing area of research is being conducted in defining the optimal location and energy amount that must be deposited for a combustion flame to be produced (Figure 2). Determining the ignition probability is one of the driving factors for ushering in an era of cleaner-burning, more reliable combustion process. Predicting the optimal location and energy quantity of the ignition kernel has the potential to reduce the overall required energy for ignition at most flight conditions in military aircraft. Finding the successful ignition parameters at flight envelope conditions can be used as a roadmap for expanding the operation envelope of the aircraft in the near to mid future [5].
Figure 2. In order for successful ignition, three criteria must be met. The flame requires an oxygen supply, a fuel source, and energy or heat to ignite the mixture [6].
Currently, engine re-ignition likelihood imposes operation envelope limits – one of the primary goals for this investigation. Existing models use lean blowout (LBO) empirical correlations to predict ignition likelihood – these models assume global extinction parameters, based on global conditions (such as, blowoff always occurs at a certain high flow rate). However, the correlation between blowout and ignition physics is not fully understood and this correlation may be simply speculative. There is also work underway to develop Large Eddy Simulation (LES) models for capturing the ignition likelihood of turbulent flows [1,7].
3 introduced to research experiments, mainly as laminar flows at low flow rates and small Reynolds numbers for the time being. According to E. Mastorakos, “Spark ignition of turbulent, nonpremixed combustion has not been studied as extensively as spark ignition of premixed mixtures either flowing or inside a combustion vessel.” [1] Nonpremixed describes fuel and oxidizer that only meet in the combustion zone; there is no prior mixing of the two substances. In a real-life scenario, turbulent nonpremixed ignition is exactly the type of flows encountered in aviation gas turbines or industrial burners. Turbulent flows induce an element of randomness into the air/fuel ratio and mixture composition at the spark location that requires laboratory testing to achieve an accurate mapping of the phenomenon. Additionally, the presence of turbulence in general can lead to straining of the flame kernel that may extinguish the flame and cease ignition [5].
4 Figure 3. The military has a need for one unified fuel that can withstand the harsh
environments faced at a forward operating base [8].
For example, because heavy fuel has a much lower flash point, it can be left unattended at a forward operating base or on a ship overseas without degrading its container and presenting a low flammability risk. For this project, initial testing was performed with other heavy fuels. Specifically, diesel fuel was used for initial experiments then the setup was switch over to Jet-A, an aviation fuel similar to JP-8.
5 Figure 4. Evolution of a flame from laminar to turbulent [9].
6
2. PRIOR WORK
Previous work relevant to this project has been performed in many areas of spark ignition combustion. Experiments by several researchers including E. Mastorakos, D.R. Ballal and A. H. Lefebvre served as the foundation for understanding the spark ignition process and developing systems for measuring the probability of successful combustion for many types of fuels.
2.1 Turbulent Spray Flames
Figure 5. Cutaway view of Mastorakos' burner unit, detailing where a single spark was sufficiently effective to ignite the fuel mixture. Farther out near the walls of the
chamber, multiple sparks were required for ignition [11].
7 usually just the oxidixer) are already at a high enough temperature for chemical reactions to begin and initiate a combustion event. Forced ignition is therefore useful in that the initial conditions are essentially “chemically frozen” and the spark provides a way to increase the temperature of the mixture above the autoignition temperature significantly and rapidly.
For liquid spray flames, there are three distinct stages in spray flame ignition: 1) kernel generation, 2) flame growth, 3) burner-scale flame establishment. These stages are universal and true for premixed, nonpremixed, swirl, nominal, and spray flames. Stage #3 is where ignition probability has importance, and forced ignition can be experimentally tested to collect data on ignition results. An ignition map can be made from the data, showing most likely points of successful ignition given a forced ignition spark.
However, the spark ignition event itself is very complex and can be broken down further into several modes for both fire/misfire cases. These are: (a) successful combustion through spark ignition, (b) the “short-mode” failure, (c) “long-mode” failure, and (d) blowoff failure. Mode (a) is the only case representing a successful ignition firing, while the other modes represent either unsustainable ignition or a complete misfire. Short and Long mode failures occur when the spark deposits an insufficient amount of energy (below the minimum ignition energy, common for spray combustion) or the spark is deposited in a region where there is low ignition probability. Blowoff failure can occur if spark is in a lean region of the mixture or the exit jet velocity is too high to anchor the flame. These blowoff events typically occur on the scale of milliseconds, whereas a laser pulse can be trigged on the nanosecond or microsecond scale.
8 2.2 Ignition Energy
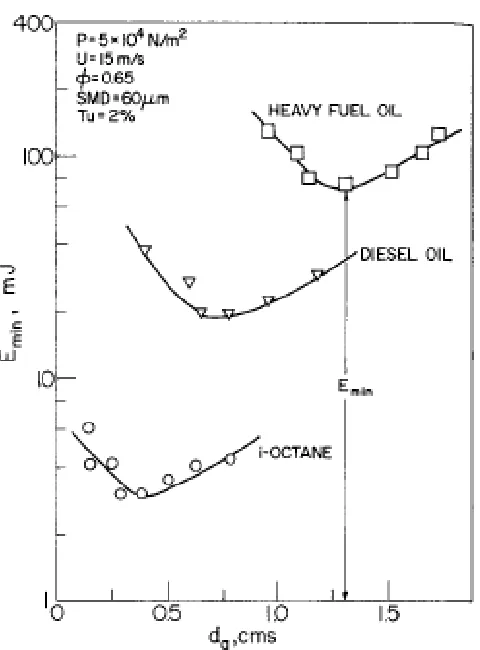
Figure 6. Diagram from Ballal and Lefebvre showing the minimum ignition energy versus electrode gap width. Their experimentes used electrodes spaced apart at diferent
distances. For heavy fuels, around 100 mJ of energy is needed [12].
9 minimum ignition energy, which is especially true at larger droplet sizes. Experimental results do not match theory for certain cases (low pressure or low equivalence ratio) because fuel vapor may be present before the spray (the mixture is not fuel droplets and air only) and chemical effects were neglected for this study. Overall, heavier fuels need a higher ignition energy to achieve successful combution compared to lighter fuels such as methane or ethylene [12].
2.3 Laminar Fuel Injectors
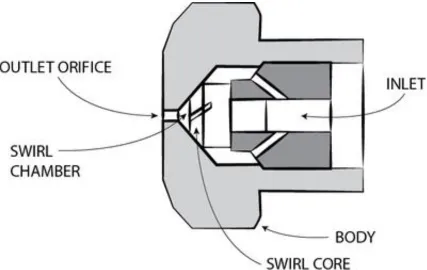
10 Figure 7. Diagram of an atomizer nozzle. Flow is injected moving from right to
left and passes through swirling vanes, creating fine droplets at the orifice [13,14].
11 Figure 8. Diagram of Shelby's experimental setup, where nitrogen is used as a carrier
gas for the fuel [16].
12 For prevaporized fuel injectors, syringe injectors are commonly used. These pass liquid fuel (kerosene or Jet-A) into heating coils and eventually to the burner unit. Romero’s setup in Figure 9 details the fuel injection and temperature monitoring system that was used [20].
Figure 9. Experimental Setup for Romero's work, using a syringe fuel injector and heating tape to prevaporize the fuel [20].
13 2.4 Research Motivation
14
3. EXPERIMENTAL METHODS
To perform the experiments and collect the data required, several experimental methods were followed. A detailed description of the apparatus is also included.
3.1 Laboratory Facilities
Experiments for this project were conducted in the Turbulent Shear Flow Laboratory at NC State University in Raleigh, NC. This lab includes three facilities for combustion and turbulent flow research experiments. Initial tests and intermediary work was performed in the High Pressure Combustion and Laser Diagnostics Lab, while the full experimental setup was eventually moved into the Reacting Flows and Turbulent Jets Lab for data collection. Both facilities are kept at an ambient laboratory pressure that is slightly below atmospheric pressure (-0.004 in. wc), to provide a positive draft inside the facility and eliminate leakage of combustion products into the main building.
3.2HVAC Modifications
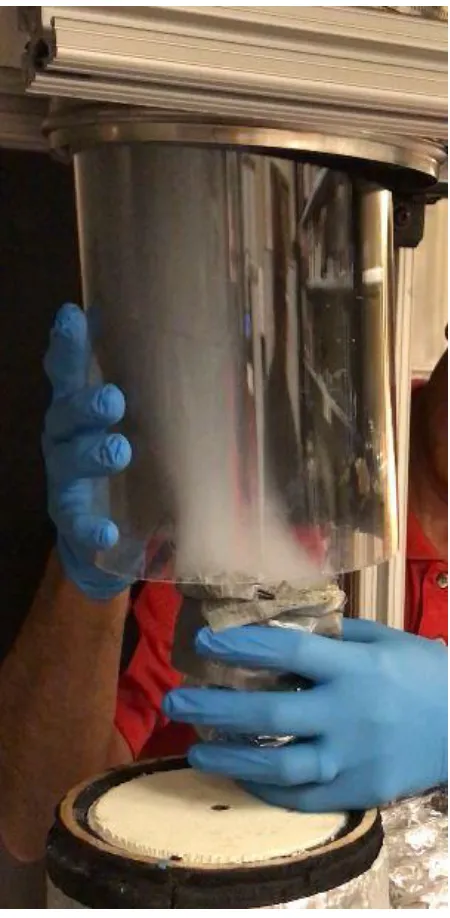
In order to prevent leakage of fuel during this experiment, a custom-fitted steel panel was added to the top of the combustion exhaust canopy. This extended the canopy paneling down to the minimum possible height above the experimental setup in order to prevent any fuel leakage into the main laboratory. Additionally, aluminum tape was used to seal any gaps
15
Figure 10. Exhaust Hood Modifications before (left) and after (right).
Figure 11. AirFlow Instruments Velocity Meter (left) and Wizard Stick (right) used for flow rate measurements and visualization experiments.
16 glycerin vaporizer to produce a white vapor that dissipates into the air as a flow visualization test. To solve this, extension ducting was added to connect the top of the combustion hood directly to the burner setup. This substantially increased the flow rate at the burner plane to over 800 cfm (Figure 12). The experiment had a prescribed jet velocity of up to 50 m/s, and the additional ducting setup was able to account for half of this due to buoyant forces.
Figure 12. Exhaust duct modification to connect burner with ventilation.
18
3.3Incinerator Attachment
A secondary incinerator flame attachment was added above the main experimental setup to burn off any excess fuel vapors. This attachment was not fixed on the burner unit; rather, it was freely resting on support struts above the experimental setup.
Figure 14. Methane incinerator attachment.
In case of a pressure buildup or explosion within the combustion zone, the incinerator attachment can freely move up and allow the pressure to vent out if needed. A full description of the incinerator attachment is included in 3.4 Experimental Setup. Once this was added, further modifications were made to the laboratory exhaust so that the velocity meter measured over 1,000 cfm of suction at the plane of the exhaust and about 200 cfm at the plane of the burner, while keeping 250 cfm through the laboratory gas cabinets in case of an explosion event in the cabinets. These readings were verified on the electronic flowmeters built in to the building ducts.
19 must be in use for the experiments. The outlet was strategically placed near the combustion hood to decrease the amount of wiring needed to connect the heating components to the outlet.
3.4Initial Experiments
The Turbulent Shear Flow Research group has performed significant work with combustion and turbulent flows. In particular, recent experiments with methane ignition served as the foundation for this work with heavy fuels. These trials used both premixed and non-premixed fuel injectors. The non-premixed jets create a diffusion flame, where the only air to sustain combustion comes from air coflow surrounding the fuel jet. Premixed flames include a fuel/air mixture coming through the center jet. Additionally, these methane experiments investigated both room temperature and cold (230 K) ignition probability cases with the intent of expanding this work into heavy fuel ignition as well.
3.5Methane Experiments
20 Table 1. Experimental Conditions for Methane Experiments [32].
In the chart, ReD = 1086 represents a laminar flow speed while ReD = 5780, 9500 are turbulent.
Cases with a 0% air by volume are diffusion non-premixed flames while 30% air by volume
is premixed. Uj represents the flow speed at the jet and Uinf is the air coflow velocity. For these
experiments, the ignition probability (fire/misfire percentage) maps have been created in Figure 15. These plots show the ignition fire probability versus radial location away from the jet exit (r) divided by the jet exit hydraulic diameter (D=6 mm). For these charts, several hundred tests were conducted and averaged over 100 shots fired to obtain the ignition percentage out of 100%.
Figure 15. Ignition Probability Maps for Methane Experiments. At left is ReD =5,780 and at right is ReD=9,500. Overlaid on the plots are the r/D radial locations of the rich
21 Shown here are the two room temperature turbulent premixed cases. As it can be seen, the peak ignition likelihood is near stoichiometric on the lean side, farther away from the burner. For the cold cases, it was found that at 230 K the flame kernel propagation speeds are reduced. Ignition is less likely at equivalent input energies for both lean and rich regions. However, the ignition rate is near equivalent in the optimal region is nearly equivalent for the cold and room temperature cases. This may be due to the presence of an ideal mixture at stoichiometric conditions, allowing some local regions (such as at the center of the laser spark) to reach the adiabatic flame temperature quickly and begin forming the flame kernel that propagates outwards. Non-ideal cases have slightly different temperatures that must be reached for combustion and may not occur in local pockets as frequently for colder mixtures.
Flame Luminosity and CH* Radical imaging was also performed. Shown here are two samples,
both taken for the ReD =5780 turbulent premixed case, near the stoichiometric location.
22 The absorbed spark energy for methane was also studied. The absorbed energy profiles at several Reynolds numbers are shown below. These show an overall decreasing trend as the
spark is moved axially away from the burner.
Figure 17. Radial profiles of absorbed energy by the spark versus radial location outward. From left to right: ReD=1,085, 5,780, and 9,500 [32].
To compare these results taken through laser ignition with a spark plug system, a validation study was performed in Figure 18 below [32]. These results show a strong corellation that laser spark ignition results should compare favorably with spark gap experiments based on the ignition probability at matching energies.
23 Overall, these methane experiments showed that the highest ignition probability occurred near stoichiometric conditions – slightly on the lean side of the mixture. Outside of the lean and rich flammability limits, the ignition probability was non-zero (consistent with prior research). These tests provided a baseline recreation of Mastorakos & others’ spark ignition experiments at real-life operating conditions (i.e., cold) for ignition scenarios. The next step from here was to work towards ignition of heavy fuels.
3.6Experimental Setup
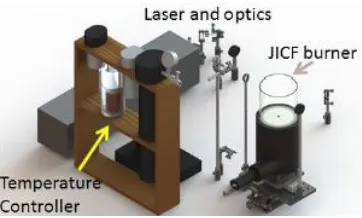
Heavy fuel experiments were performed using a modified Jet in Coflow (JICF) buner. The original JICF burner used for methane experiments is shown below in Figure 19. This consists of a plywood cylindrical hollow tube, with 165 mm outer diameter. The plywood was laser cut from large sheets into thirds of the circle, in order to reduce material usage. Plywood was used rather than metal to reduce weight so that the entire burner assembly can be moved using a linear stage below. These plywood sections were then glued together to make the full cylinder. Aerogel and foam insulation layers were added to prevent temperature losses during the experiment. Additionally, a side port was added into the side of the cylinder for air coflow. This was insulated with PVC piping and aerogel insulation, then a ½” pipe fitting was attached to the exterior for the airflow.
24 Figure 19. JICF Burner used for the methane experiments. Slight modifications were
made for the heavy fuel experiments.
25 Figure 20. Methane Incinerator Drawing.
26
Figure 22. Methane incinerator with fire-stop putty to seal for leaks.
Above the setup is the methane incinerator flame, held steady above combustion zone. Flame arrrestors are placed at either end of the quartz tube to prevent flashback and quench the flame from either end (Figure 21). The flame arrestors are ceramic honeycomb structure with a cell density of 230 CPSI (cells per square inch). Each ceramic honeycomb is 2” in height. These were purchased from Applied Ceramics as 6” square pieces, then machined using a waterjet into the circular sections shown here with a 6” diameter. The honeycomb sections are suspended in place with a combination of fire-resistant putty and metal constraints.
27
This setup was designed to accommodate a mixture 𝑅𝑒𝐷 = 10,000 at jet tube exit as a design
constraint for turbulent flow measurements. To achieve that, the original center tube from the previous JICF burner (6mm inner diameter) was replaced. A ceramic tube was inserted through the bottom port of the burner and up through the flame arrestor to prevent heat losses from the fuel/nitrogen mix. A steel tube with an inner diamter of 1.5mm was inserted into this ceramic to provide the jet tube diameter needed to achieve the given Reynolds number at a known flow rate and flow viscosity.
28 Figure 23. Peristaltic Pump and tubing (left) and Jet-A liquid fuel tank (right).
Jet-A fuel was kept in a 2L fuel tank with one exit port. A petcock valve was threaded into the tank at the port and fuel lines were attached to carry the fuel into the prevaporizer system. Two additional valves, a needle valve for precise control of the flow rate and an on/off ball valve, were located downstram of the tank before prevaporizer system.
29 an alternative to centrifugal pumps (Table 2). It was found that vaporizing the fuel upstream causes some fluctuations and cavitation which present issues for centrifugal and rotary vane pumps operating with liquid fuel. The peristaltic pump dampens out these effects because the flow is not separated through vanes or other mechanical methods to achieve the desired flow rates. The pump flow rates were measured for the full range of dial settings (Figure 24).
Figure 24. Calibration curve taken from measurements with the peristaltic fuel pump. Each dial setting on the pump corresponds to a certain fuel flow rate for the
30 Table 2. Technical specifications of the peristaltic pump and tubing.
Once the liquid fuel passed through the peristaltic pump, it was sent into the prevaporized section. This consisted of 15 m of wound heating coils to raise the flow temperature above the boiling point. These coils were a combination of 304 stainless steel and copper due to their high heat capacity values (502 and 376 J/kg*K, respectively), wrapped with heating tape and wool insulation. The inner section was 5 m of coiled ¼” outer diameter copper tubing, wrapped with heating tape. This section was insulated with wool, then wrapped with 10 m of ¼” OD stainles steel coils to catch any heat losses. The fuel traveled from the pump into the steel section to slightly increase its emperature, then into the insulated copper section for vaporization (Table 3). After the fuel passed through the copper section, it was injected into the heated nitrogen stream and sent to the burner.
Cole-Parmer Masterflex L/S Peristaltic Fuel Pump
Analog Variable Speed Control with Easy-Load Pump Head Max Theoretical Flow Rate: 2.9 Liters/minute (LPM) Min Theoretical Flow Rate: 0.0012 LPM
Max Measured Flow Rate: 3.0 LPM Min Measured Flow Rate: 0.16 LPM Peristaltic Pump tubing
Max Theoretical Pressure: 140 PSI Max Measured Pressure: 30 PSI
120V AC Power Supply, 1.5 Amp Current Draw 37 Watt Motor
1/20 Horsepower 20-600 RPM
31 Table 3.Technical Specifications for fuel lines and fittings.
The nitrogen stream was passed from a tank through a mass flow controller and into an OSRAM SureHeat Jet Air Heater (3kW, 240V, 1-Phase, 12.5 Amps). This inline heater preheated the nitrogen to a set valvue of 500 Faehrenheit. The temperature was controlled with an OSRAM Control Panel that uses 2 internal relay circuits to supply a variable voltage to the heating coils so that they reach a desired temperature, as measured through a PID controller with thermocouple data transfer wires. The control box was powered through the new NEMA L6-20 outlet that had been installed in the lab. To run the heater effectively and prevent burnout, a minimum of 75 LPM of flow was needed through the inline heater. A tee valve was added upstream to switch beween air flow (for preheating) and nitrogen (for the experiments). The air ws never mixed with fuel as all upstream fuel vales were closed; the air went up through the jet burner tube and out into the combustion hood.
However, only a small amount of nitrogen was needed to run the experiments and achieve the desired Reynolds number and fuel/nitrogen mix in the combustion zone. Therefore, the hor nitrogen flow was teed off into a waste line and a fuel injeciton line. The waste line was
Fuel Lines
“Medium-Pressure Chemical Hose”
Max Theoretical Pressure: 500 PSI at 273 K Temperature Range: 250 K to 350 K
Material: Nylon with Blended Rubber Cover Compatible with stainless steel barbed hose fittings
Fuel Line Fittings
All Pressures at 273 K
Pressure Gauge: 300 PSI Max Brass Fittings: 250 PSI Max
32 directed through copper cooling coils submerged in an ice bath to cool down the flow, then through another mass flow meter and valve system before venting out into the combustion hood. The fuel injection nitrogen line was immediately sent through a needle valve and mixed with the fuel injection port at a tee valve.Using the mass flow controller upstream before the heater and downstream in the waste line allowed precise control of the nitrogen flow rate at the injeciton port. The nitrogen lines were calibrated to acount for friction losses across all flow rates (Figure 25).
Figure 25. Nitrogen was measured at separate flowmeters to account for losses and calibrate the fuel injection line based on the differential flow rates.
33 achive testing at several spark locations. The hot nitrogen lines were insulated with alumina ceramic blankets rather than the wool used for the fuel lines. The wool was ciruclar and allows coils to be wrapped around it easily, while the alumina is a blanket that can be wrapped around the pipe fittings, flexible steel tube, and other sections. Both provide sufficient insulaiton to keep the mixutre heated above the boiling point of the fuel.
Table 4. Insulation Technical Specifications
3.7Experimental Procedure
Figure 26. Personal Protective Equipment (PPE) worn during experimentation.
To run the experiments, personal protective equipment (PPE) was required to be worn (Figure 26). A Nomex lab coat was always worn when experimenting with fuels for body protection. Closed-toed shoes and long pants must be worn also to prevent any skin exposure below the
Wool Insulation Alumina Blanket Insulation
7/8" Insulation ID, 0.02m Thick, 1m Length 0.02m Thick, 0.3m Square
34 lab coat. For facial protection, hooded/indirect vent splash goggles were worn for any work with liquid fuels. For ignition experiments, green laser safety glasses were worn to block the 1064nm spark wavelength. For experiments with the PIV laser (no laser spark), orange laser safety glasses were worn to block the 532 nm laser sheet. A face shield (with green laser goggles underneath as secondary protection) was used for any experiments with both fuel and the spark ignition laser. Nitrile gloves were worn when handling the fuel, fittings, tanks, etc. The gloves were replaced immediately if any breaks/breaches occur in the material. Gloves were always replaced after being worn for about 4 hours so that the fuel does not permeate the material, and properly disposed of. For any combustion experiments, fire retardant gloves were worn to protect from burns and heat.
35 increased so that sparks formed consistently (100-400 mJ) in a jet of preheated air surrounded by the quartz tube. The quartz tube needed periodic cleaning to ensure it allows the maximum possible amount of beam energy to pass through. Once sparks were formed consistently, the laser was kept on but all shutters were closed in the reverse order they were opened.
By now, the system had sufficient time to preheat, and the methane flame was lit on the incinerator. The methane safety valves were opened starting from furthest from the tank to the tank itself to prevent any pressure buildups in the fuel line as the tank was opened. Once fully, opened, the methane flow rate was throttled to 6.5 LPM (design constraint). Then the top flame was lit above the combustion zone. This was performed early in the procedure so that any fuel vapors will be burnt off as the fuel lines are opened for the experiment.
Next, the heated flow was switched from air to nitrogen. A three way valve system was used to split the air stream into coflow only and allow nitrogen to replace it on the line going into the heater. The flow rates were adjusted again to ensure the heater had above 75 LPM the entire time to prevent burnout. For experiments, the air coflow was set to around 185 LPM and the nitrogen flow rate was set between 90-120 LPM, giving between 60-90 LPM on the waste line depending on the valve position.
The fuel heater was turned on and sufficient time was allowed for the fuel to vaporize along the heating coils. Once the lines had reached the required temperature, the pump was turned on to start moving the fuel through the piping. Then, the jet valve was adjusted to a value that gave a consistent fuel/nitrogen stream at a well-controlled flow rate.
36 To shutdown the system, the fuel heater was turned off and the nitrogen heater was taken down to 273 K at the same rate of 50 K/minute. The laser shutters were closed and the laser turned off. Air was continually sent through the system until it reached room temperature to the touch and the heater could be turned off and all gas lines closed. The methane incinerator was extinguished last, to account for any traces of fuel that may have been present during the shutdown procedure.
For additional data collection besides the ignition probability map, particle image velocimetry (PIV) was performed to provide 2D two-component velocity fields at the spark location. Nanometer-sized alumina particles were seeded into the coflow air stream and the particles’ laser scatter was imaged with a high speed camera. Sufficient seeing of the flow was achieved by seeding the co-flow and increasing its flow rate from 0.2 m/s or 200 LPM to 0.25m/s and 250 m/s. This increased flow rate was determined to not significantly alter the ignition phenomenon. The laser scattering images were processed using commercial software (La Vision Inc., DaVis 8.4) to provide velocity vector fields using a multipass algorithm that sized down from 64×64 pixels to 16×16 pixels with 50% overlap. The resulting vector fields had a spatial resolution of 0.25 mm with accuracy better than 0.01 m/s in the mean.
3.8What If? Scenarios
37 Table 5. “What If?” Scenarios.
What if? Answer Probability Consequences Recommendations
Use on unventilated benchtop Flammable vapors could accumulate and reach source of ignition fire
High Extensive
damage/downti me and costs
Use in fume hood
Overexposure to toxic vapors
High Adverse health
effects
Use in fume hood
Mechanical failure of fume hood exhaust fan
Lack of exhaust but vapors still accumulate and ignition sources still present
Moderate Adverse health
effects
Suspend testing until exhaust is fixed or find a replacement hood in the adjacent lab for experiments
Fire High Damage Contain vapors as
much as possible, take fire
extinguisher safety class on proper usage
Power failure during use
Lack of exhaust, vapors may accumulate but at lesser
magnitude, potential fire
Very high Damage/health
effects
Use manual shutoffs (ball valves, etc) in system design in addition to
electronic switches Fuel flow rate is
uncontrolled
Very high Failed
experiment, exposure to fumes/liquids
Wear proper PPE equipment to protect against splashes/fumes Heater malfunction, electrical arcing
Possible fire in heating tape and ignition of solvent vapors
Moderate Equipment
damage/person nel injuries
Check electrical connections (plugs and wires); pretest heater before starting Heater malfunction, supplies too much heat Heat material above flash point
Moderate Fire, damage,
personnel injuries
38 Table 5 (continued).
Insulation or heating tape smokes or burns
Moderate Personnel
injuries
Do not leave unattended; check temperature of reaction at regular intervals and shut off if smoke is observed Heater
malfunction ; supplies too little heat; if no heat, see loss of power above Vaporization unsuccessful
Moderate Liquid fuel
spills at exit port
Point exit port down into fuel collection container to account for any unvaporized liquid fuel
Leak in Fuel Line
Spillage of liquid fuel
High Fuel spills,
possible fire hazard
Use PTFE tape and tighten all fittings before each new experiment; check for leaks by running the pump with heater off Escape of
Vapors from fuel line
High Fire hazard if
near electrical components/he ater
Tighten fuel lines prior to new experiments Spill from
hot collection container
Flash fire High Fire/damage/
personnel injuries
Do not handle hot vessel
Vaporization unsuccessful
High Lost time and
materials
Do not leave setup unattended
Pump malfunction
Fuel flow rate is uncontrolled
High Failed
experiment, exposure to fumes/liquids
39 Table 5 (continued).
Electrical spark near fuel supply
High Fire/Damage/
personnel injuries
Use barrier to shield power supply from fuel, keep pump elevated to prevent fuel spills on table underneath electrical
equipment Electrical wires
break
High Lost time and
materials
Ensure tight connections with strain relief for all wires, use electrical tape as needed Fuel tank
breaks
Flash fire High Fire/damage/
personnel injuries
Check container for signs of prior damage or use new container Residual process gas in equipment when valves opened
Vessel breaks High Fire/Damage/
personnel injuries
Leave valves open for proper drainage after experiments and when not in use Vessel cannot be
opened
High Lost time and
materials
See above
Unintended reaction occurs
High Hazardous
byproducts
Conduct a review of all possible reactions and outcomes
3.9Boundary Conditions
40 Table 6. Experimentation Boundary Conditions.
Fuel-Nitrogen Mixture:
Case 1: 4 LPM flow rate, 35 m/s jet exit velocity , 15:1 Nitrogen: Jet-A Dilution Ratio by Volume
Case 2: 8 LPM, 50 m/s jet exit velocity, 30:1 Nitrogen: Jet-A Dilution Ratio by Volume
Jet Exit:
400K flow exit temperature
Inner Diameter (D): 1.5mm
Radial Locations: r/D = 0 – 4 in steps of 1 mm Surroundings:
Air flowing at 180 LPM for coflow
Quartz Tube: 457 mm height (no influence by incinerator) Spark:
Spark size: 1 mm
41
4. RESULTS AND DISCUSSION
Several experiments were performed to conduct a full analysis of heavy fuel ignition. Overall, these represented the next logical step from the methane testing discussed earlier towards heavy fuel experiments at real-life scenarios such as high altitude, cold fuel combustion. The key findings are presented, then individual experiments are discussed and the results are presented.
4.1Key Findings
It was found that three main factors contributed to the collection of data: 1) the temperature of the flow, 2) the phase of the fuel (liquid/vapor), and 3) the dilution rate of the fuel. A wide range of possible scenarios could be studied, however these experiments focused on specific temperatures and flow regimes. It was determined that there are several non-trivial locations where the fuel mixture will ignite when a spark is deposited, even well outside the lean flammability limits of the fuel. There are only a few possible locaitons within the combustion chamber where the mixture will ignite, and this project served to identify those locations through a parametric approach. Measurements for the burner setup were collected, including maps of the temperature profile, ignition probability, and mean velocity field. Additionally, individual measurements of the flame luminosity and chemiluminescence for successful ignition cases were collected. From this, specific parameter values for creating an ignitable mixture were determined.
4.2Temperature Profile
42 ambient temperature near 297 K by r/D = 10. This provided a profile used for determining the experimentation area for ignition probabilities, so that the warmest portions of the flow were captured. Spark ignition experiments were conducted well inside the hot region, from r/D = 0 to slightly past lean, r/D = 4. However, of interesting note as that the flow
temperature decreased from 400 K at the jet exit down to 300 K only a few millimeters above the jet. The surrounding air coflow was at 295 K, which may have been sufficient to cool down the jet flow significantly by the time it reached the plane of the spark location.
43 Figure 27. Temperature Map Profile at a spark height of x/D = 20, taken across the
entire width of the burner from r/D = -40 to 40. The peak measured temperature was
303 K at r/D = 0.
4.3Ignition Probability
45 Figure 28. Ignition Probability at x/D=20 for Jet-A fuel at a 15:1 Nitrogen: Jet-A
dilution ratio. The highest probability was directly above the burner at 14%.
4.4Mean Velocity Field Measurements
47 Figure 29. PIV Velocity profile from DaVis for Case 1. This provides a full map of the
velocity field, with a maximum measured velocity of 10 m/s at 12 mm above the jet. The
49 Figure 31. PIV Velocity profile from DaVis for Case 2. This provides a full map of the
velocity field, with a maximum measured velocity of 18 m/s at 8 mm above the jet. The
51 Figure 33. Mean Velocity at spark height of x/D=20 for Case 1. The max velocity was
52 Figure 34. Mean Velocity at spark height of x/D=20 for Case 2. The max velocity was
measured at 10.463 m/s.
4.5High-Speed Imaging
53 Figure 35. High-speed images of the spark kernel formation and propagation at time
t=0 seconds (top left), t+0.3 ms (right), t+0.6 ms (bottom left). The tip of the jet can be
seen in the right image.
4.6Flame Luminosity
55 Figure 36. Flame luminosity images at x/D=40, r/D=0.667. The artifact on the left side of
each image is a reflection of the spark/kernel on the quartz glass.
4.7Chemiluminescence
57 Figure 37. Chemiluminescence images at x/D=40, r/D=0.667.
4.8Applications and Future Work
58 liquid fuel. The shear layer of the flow, being containing liquid droplets, needs a much higher energy to ignite as it must be transformed into a vapor and then into the flame kernel. The overall effect from this phenomenon is that the ignition probability is decreased due to the low temperature of the jet flow, which exists as a two-phase flow. Future work to solve this issue would involve swapping the modified JICF burner for another unit in the laboratory made from metal casings, that can handle much higher temperatures without melting. This would allow the inlet flow temperature to be significantly increased to keep the jet flow as a vapor.
59
5. CONCLUDING REMARKS
60
6. REFERENCES
1. Ahmed, S.F., and E. Mastorakos. “Spark Ignition of Turbulent Spray Flames”.
Combustion Institute, 2006.
2. Spark Plug Image. Matthew’s Volvo Site. https://www.matthewsvolvosite.com/
3. Spark Plug Image. “No Spark Guide for Negative Earth Distributors.
https://blog.simonbbc.com/
4. Combustion Image. GarageSpot. https://garagespot.com/
5. Marchione, T., S.F. Ahmed, E. Mastorakos. “Ignition of Turbulent Spray Flames
Using Single and Multiple Sparks”. Combustion and Flame. 2009.
6. Flame Image. Bureau of Fire Safety.
http://www.hopewelltwp.org/252/Bureau-of-Fire-Safety
7. Ahmed, Samer Fikry Abdel Fattah Sayed. “Spark Ignition of Turbulent Spray
Flames”. Ph.D Dissertation, 2006.
8. Military Heavy Fuel Images. Army Webpage. http://www.alu.army.mil/
9. Laminar to Turbulent Transition Image.
http://keywordsuggest.org/gallery/856898.html
10.Sforzo, Brandon. “High Energy Spark Ignition in Non-Premixed Flowing
Conbustors”. Ph.D Dissertation, 2014.
11.Mastorakos, E. “Forced Ignition of Turbulent Spray Flames”. Combustion Institute.
2017.
12.Ballal, D. R., and A.H. Lefebre. “A General Model of Spark Ignition for Gaseous and
Liquid Fuel Mixtures”. Combustion Institute, 1981.
13.Ballal, D. R., and A.H. Lefebre. “Ignition of Liquid Fuel Sprays at Subatomic
Pressures”. Combusiton and Flame 31, 115-126, 1978.
14.Ballal, D. R., and A.H. Lefebre. “Ignition and Flame Quenching of Flowing
Heterogeneous Fuel-Air Mixtures”. Combustion and Flame 35, 155-168, 1979.
15.Cochet, M. et al. “Evaporation of Polydispersed Droplets in a Highly Turbulent
61
16.Shelby, Michael H., Brad A VanDerWege, and Simone Hochgreb. “Early Spray
Developments in Gasoline Direct-Injected Spark Ignition Engines”. International Congress and Exposition, 1998.
17.O’Loughlin, William, and Assaad R. Masri. “The Structure of Auto-Ignition Region
in Turbulent Dilute Methanal Sprays Issuing in a Vitiated Co-flow”. Flow Turbulence Combustion 89, 13-35, 2012.
18.Kourmatzis, A., W. O’Loughlin, and A. R. Masri. “Effects of Turbulence,
Eveporation, and Heat Release on the Dispersion of Droplets in Dilute Spray Jets and Flames”. Flow Turbulence Combustion 91, 405-427, 2013.
19.Lyons, O. F. P., T. Persoons, and D.B. Murray. “Particle Sizing and Flow
Measurements in an Atomizing Mist Jet Nozzle: A Shadowgraphy Approach”. ILASS 2010.
20.Romero, D, N. Parthasarathy, S. R. Gollahalli. “Laminar Flame Characteristics of
Partially Premixed Prevaporized Palm Methyl Ester and Diesel Flames”. Journal of Energy Resources Technology 136, 2014.
21.Dhanuka, Sulabh K., Jacob E. Temme, and James F. Driscoll. “Unsteady Aspects of
Lean Premixed Prevaporized Gas Turbine Combustors: Flame-Flame Interactions”. Propulsion and Power Vol. 27 No. 3, 2011.
22.Aida, Naoki, et al. “Combustion of Lean Prevaporized Fuel-Air Mixtures Mixed with
Hot Burned Gas for Low-NOX Emissions Over An Extended Range of Fuel-Air Ratios”. Combustion Institute 2005.
23.Beck, C. H., R. Koch, H.-J. Bauer. “Identification of Droplet Burning Modes in Lean,
Partially Premixed Swirl-Stabilized Spray Flames.” Combustion Institute 2009.
24.Dhanuka, Sulabh K.,et al. “Vortex-Shedding and Mixing Layer Effects on Periodic
Flashback in a Lean Premixed Prevaporized Gas Turbine Combustor”. Combustion Institute 2009.
25.Love, N. D., R. N. Parthasarathy, S. R. Gollahalli. “Rapid Characterization of
62
26.Gokulakrishnan, P., et al. “A Novel Low NOX, Lean, Premixed, and Prevaporized
Combustion System for Liquid Fuels”. Journal of Engineering for Gas Turbines and Power, 2008.
27.Roby, Richard J, et al. “Development of a System for Lean, Prevaporized, Premixed
Combustion”. Proceedings of the Thirty-Sixth Turbomachinery Symposium, 2007.
28.Allouis, C., F. Beretta, and A. Amoresano. “Experimental Study of Lean Premixed
Prevaporized Combustion Fluctuations in a Gas Turbine Burner”. Combustion Science and Technology, 2008.
29.Holley, A. T., et al. “Extinction of Premixed Flames of Practical Liquid Fuels:
Experiments and Simulations”. Combustion and Flame 144, 448-460, 2008.
30.El-Rabii, H., et al. “Laser Ignition in a Lean Premixed Prevaporized Injector”.
Combustion Science and Technology 2010.
31.Shehata, Mohamed S., Mohamed M. ElKotb, and Hindawi Salem. “Combustion
Characteristics for Turbulent Prevaporized Premixed Flame Using Commerical Light Diesel and Kerosene Fuels”. Journal of Combustion 2014.
32.Ley, K. and Narayanaswamy, V. “Parametric Study of Forced Ignition in Laminar
and Turbulent Methane Jets”. 2017.
33.Gampert, Markus, Venkat Narayanaswamy, Norbert Peters. “Scalar Gradient
Trajectory Measurements Using High-Frequency Cinematographic Planar Rayleigh Scattering”. Exp Fluids 54, 2621, 2013.
34.Cushman-Roisin, Benoit. “Turbulent Jets.” Thayer School of Engineering, Dartmouth
College. 2017.
35.Chen, L.D., et al., Buoyant diffusion flames. Symposium (International) on
![Figure 1. Spark ignition is one of the most fundamental methods of combustion, where an electric spark is generated (top left) to trigger a chain reaction of events (top right) leading to combustion of a fuel mixture (bottom) [2,3,4]](https://thumb-us.123doks.com/thumbv2/123dok_us/1442174.1176663/14.612.111.540.287.661/figure-ignition-fundamental-combustion-electric-generated-reaction-combustion.webp)
![Figure 2. In order for successful ignition, three criteria must be met. The flame requires an oxygen supply, a fuel source, and energy or heat to ignite the mixture [6]](https://thumb-us.123doks.com/thumbv2/123dok_us/1442174.1176663/15.612.242.427.248.410/figure-successful-ignition-criteria-requires-source-ignite-mixture.webp)
![Figure 4. Evolution of a flame from laminar to turbulent [9].](https://thumb-us.123doks.com/thumbv2/123dok_us/1442174.1176663/18.612.168.495.69.318/figure-evolution-of-flame-from-laminar-to-turbulent.webp)

![Figure 8. Diagram of Shelby's experimental setup, where nitrogen is used as a carrier gas for the fuel [16]](https://thumb-us.123doks.com/thumbv2/123dok_us/1442174.1176663/24.612.185.445.76.432/figure-diagram-shelby-experimental-setup-nitrogen-used-carrier.webp)
![Figure 9 details the fuel injection and temperature monitoring system that was used [20]](https://thumb-us.123doks.com/thumbv2/123dok_us/1442174.1176663/25.612.102.516.152.464/figure-details-fuel-injection-temperature-monitoring-used.webp)