ISSN (Print) : 2320 – 3765 ISSN (Online): 2278 – 8875
I
nternational
J
ournal of
A
dvanced
R
esearch in
E
lectrical,
E
lectronics and
I
nstrumentation
E
ngineering
(A High Impact Factor, Monthly, Peer Reviewed Journal)
Website: www.ijareeie.com
Vol. 7, Issue 2, February 2018
Smart Helmet with Intelligent Life Saving
Mechanism
A.G. Narmadha1, M. Sharmila2, S. Sreejaa3, T. Vasumathi4, S. Jeya Anusuya5, S.P.Vijayvardhan Reddy6
Student,Department of Electronics and Communication Engineering, T.J.S. Engineering College, T.J.S. Nagar,
Peruvoyal, Thiruvallur District, Tamilnadu, India1, 2, 3, 4,
Associate Professor,Department of Electronics and Communication Engineering, T.J.S. Engineering College, T.J.S.
Nagar, Peruvoyal, Thiruvallur District, Tamilnadu, India. 5, 6
ABSTRACT: In this framework, we are building up advanced wearable technologies, which have empowered constant account of state of the drivers. The activities, for example, cycling, motor-racing or military engagement, a helmet with inserted sensors would give most extreme comfort and the chance to screen both the imperative signs. To this end, we examine the attainability of recording the heart beat, breath and from confront lead areas, accomplished by installing different cathodes inside a standard helmet. The terminal positions are at the lower jaw, mastoids and brow, while for approval purposes a breath belt around the thorax and a reference ECG from the chest fill in as ground truth to survey the performance. The inside head protector EEG is checked by presenting the subjects to occasional visual and sound-related boosts and screening the chronicles for the relentless state evoked possibilities in light of these stimuli. We likewise propose a multivariate R-top identification calculation reasonable for such loud situations. Chronicles in true situations bolster a proof-of-idea of the plausibility of recording indispensable signs and EEG from the proposed keen helmet. For all in this system, we proposed the new method of smart helmet consist of sensors which are used for measuring heart activity.
KEYWORDS: Electrocardiogram, ECG, Electroencephalogram, EEG, Helmet, Wearable Devices.
I. INTRODUCTION
The observing of physiological signals utilizing wearable gadgets is progressively turning into an essential for the evaluation of the condition of body and brain in common habitats. This has been encouraged by little scale simple and computerized incorporated circuit innovation, together with onchip preparing power for managing development actuated antiquities in biopotentials, which are available when performing day by day exercises. Physiological signals recorded, all things considered, tend bo be famously powerless and with a low Signal-to-Noise Ratio (SNR). To this end, an enhancer with a high regular mode dismissal proportion is required; such fantastic bio-amplifiers are normally incorporated into the simple front end of extensive stationary gadgets. As a result of the numerous leads and cathodes required, such gadgets are suited for clinical situations, where patients are regularly stationary (aside from e.g. for cardiovascular pressure tests), so the clamor level is generally low. Contrasted with stationary chronicles, the estimations acquired from wearable gadgets are essentially more tainted by commotion on account of subject developments.
ISSN (Print) : 2320 – 3765 ISSN (Online): 2278 – 8875
I
nternational
J
ournal of
A
dvanced
R
esearch in
E
lectrical,
E
lectronics and
I
nstrumentation
E
ngineering
(A High Impact Factor, Monthly, Peer Reviewed Journal)
Website: www.ijareeie.com
Vol. 7, Issue 2, February 2018
presented by cathode developments on the skin (0:01 Hz to 500 Hz) is like the surface EMG range (2 Hz to 500 Hz) and both cover with the noteworthy parts of the recurrence range of the electrocardiogram (ECG) (0:05 Hz to 100 Hz), ordinary electroencephalogram (EEG) (0:5 Hz to 100 Hz), and full-band EEG (0:01 Hz to a few hundred Hz). Applying standard separating ways to deal with dismiss the ancient rarities will likewise evacuate a critical recurrence band of the flag of intrigue.
In the meantime, while movement antiquities are a key issue in wearable gadgets, the electrical cable commotion is decreased contrasted with stationary gadgets. This is because of battery-controlled gadgets which normally utilize either SD-cards to store the information or remote innovation to get and transmit information over a Gigahertz recurrence run.
A. Heart Beat Sensor
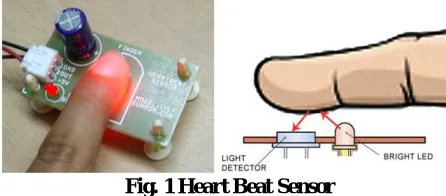
Heart Beat Sensor is designed to give digital output of heat beat when a finger is placed on it. When the HEART BEAT detector is working, the beat LED flashes in unison with each heart beat. This digital output can be connected to microcontroller directly to measure the Beats Per Minute (BPM) rate. It works on the principle of light modulation by blood flow through finger at each pulse. Medical heart sensors are capable of monitoring vascular tissue through the tip of the finger or the ear lobe. It is often used for health purposes, especially when monitoring the body after physical training. Heart Beat is sensed by using a high intensity type LED and LDR. The finger is placed between the LED and LDR. As Sensor a photo diode or a photo transistor can be used. The skin may be illuminated with visible (red) using transmitted or reflected light for detection.
Fig. 1 Heart Beat Sensor
The very small changes in reflectivity or in transmittance caused by the varying blood content of human tissue are almost invisible. Various noise sources may produce disturbance signals with amplitudes equal or even higher than the amplitude of the pulse signal. Valid pulse measurement therefore requires extensive preprocessing of the raw signal. The new signal processing approach presented here combines analog and digital signal processing in a way that both parts can be kept simple but in combination are very effective in suppressing disturbance signals. The setup described here uses a red LED for transmitted light illumination and a LDR as detector. With only slight changes in the preamplifier circuit the same hardware and software could be used with other illumination and detection concepts. The detectors photo current (AC Part) is converted to voltage and amplified by an operational amplifier (LM358).
There are several features associated with this Heart Beat Sensor, which are listed as below: (a) Microcontroller based SMD design, (b) Heat beat indication by LED, (c) Instant output digital signal for directly connecting to microcontroller, (d) Compact Size and (e) Working Voltage +5V DC.
There are several applications associated with this Heart Beat Sensor, which are listed as below: (a) Digital Heart Rate monitor, (b) Patient Monitoring System and (c) Bio-Feedback control of robotics and applications.
ECG Sensor
ISSN (Print) : 2320 – 3765 ISSN (Online): 2278 – 8875
I
nternational
J
ournal of
A
dvanced
R
esearch in
E
lectrical,
E
lectronics and
I
nstrumentation
E
ngineering
(A High Impact Factor, Monthly, Peer Reviewed Journal)
Website: www.ijareeie.com
Vol. 7, Issue 2, February 2018
configuration is ideal for low noise. The electrocardiogram (ECG or EKG) is a diagnostic tool that is routinely used to assess the electrical and muscular functions of the heart. The electrocardiogram (ECG) has grown to be one of the most commonly used medical tests in modern medicine. Its utility in the diagnosis of a myriad of cardiac pathologies ranging from myocardial ischemia and infarction to syncope and palpitations has been invaluable to clinicians for decades. The filter is tightly coupled with the instrumentation amplifier architecture, enabling a single-stage high gain and high-pass filter, thereby saving space and cost.
Fig.2 ECG Sensor
There are several features associated with this ECG Sensor, which are listed as below: (a) Bipolar Differential Measurement, (b) LED Indicator, (c) Input voltage: 5v, (d) Output: Analog, (e) Output voltage : 5v and (f) 3.5mm Jack for Biomedical Pad Connection.
There are several applications associated with this ECG Sensor, which are listed as below: (a) Heart rate Variability, (b) Human - Computer Interaction, (c) Biometrics, (d) Bio-Feedback and (e) Biomedical Devices Prototyping.
II. PAST SYSTEM – A SUMMARY
In existing system normally we had the wearable helmet but in case of Speeding and not wearing a helmet are the main reasons of fatalities and injuries. It is proven that, as the speed of motorcycles increased, so did the number of accident and fatalities. This is again due to the shock of an impact during the accident. The objective of this project is to build a safety system in a helmet and speed alert for a better safety of motorcyclists. However there are no safety arrangements for the patients especially for heart patients.
ISSN (Print) : 2320 – 3765 ISSN (Online): 2278 – 8875
I
nternational
J
ournal of
A
dvanced
R
esearch in
E
lectrical,
E
lectronics and
I
nstrumentation
E
ngineering
(A High Impact Factor, Monthly, Peer Reviewed Journal)
Website: www.ijareeie.com
Vol. 7, Issue 2, February 2018
Fig.4 Receiver Section – Android Mobile III. PROPOSED SYSTEM SUMMARY
In our project we proposed the new method of smart helmet consist of sensors which is used for measuring heart activity or calorie consumption in driving and can estimate of the heart rate. These are therefore not suitable for real-world activities where it is essential to record and monitor vital signs in uncertain or dangerous situations. for example are traffic accidents, especially when the state of body and mind, such as drowsiness, stress, anxiety and sickness, of drivers prevents them from concentrating on the road. A number of life-threatening injuries occur in cycling, motorcycle and car racing, horse riding, rugby, and cricket. This has motivated us to create a smart helmet which can record and monitor both vital signs and neural activity of wearers. We are proposing continuous monitoring of heart beat of driver and respiration i.e. breathe condition level. Here we are fixing the inhalers used for the drivers in case of abnormal in the respiration it automatically detects and activates the inhalers.
IV. LITERATURE SURVEY
In the year of 2017, the authors "Anushka Pawar, Shoomiren Singh and Pranav Kelkar" proposed a paper titled "An Air Pollutant Vehicle Tracker System Using Gas Sensor and GPS", in that they described such as: in this era of proliferating growth of technical advancements, vehicles have become an integral part of human life. Every vehicle has its own emission of polluting gases, but the problem occurs when the vehicles do not get serviced regularly and the emission is beyond the standardized value. [1]The primary reason for this breach of emission level being the incomplete combustion of fuel supplied to the engine which is due to improper maintenance of vehicles. This emission from vehicles cannot be completely avoided but it can be definitely controlled. The aim of this project is to monitor and control the pollutants from the vehicle thereby incorporating technical knowledge for a Green City. This system tracks the pollution levels using MQ-7 gas sensor and the data from GPS module is sent to the server using TCP/IP protocol so that the location of the vehicle can be traced by the RTO. Hence the main objective of monitoring pollution caused by the vehicles can be achieved and this in turn will create awareness amongst the mass about this global issue.
ISSN (Print) : 2320 – 3765 ISSN (Online): 2278 – 8875
I
nternational
J
ournal of
A
dvanced
R
esearch in
E
lectrical,
E
lectronics and
I
nstrumentation
E
ngineering
(A High Impact Factor, Monthly, Peer Reviewed Journal)
Website: www.ijareeie.com
Vol. 7, Issue 2, February 2018
humidity and concentration of carbon monoxide gas, etc. Using sensors and enables to have a keen control on the environmental pollution caused by the industries.
In the year of 2014, the authors "R. Venkatasreehari and M. Kalyan Chakravarthi " proposed a paper titled "Industrial Pollution Monitoring GUI System Using Internet, Labview And GSM", in that they described such as: nowadays most of the pollution monitoring systems are widely used in industries. The industrial parameters which causes pollution in the natural and industrial environment pattern. The main aim of our project is to control the parameters causing pollution and to reduce the effect of these parameters without affecting the natural or industrial environment. The proposed technique is to design an efficient system to read and monitor pollution parameters and if any of these factors exceeds the industry standards, immediately these information send to pollution control authority by using GSM and Lab VIEW methodology. Which will automatically monitor, if any of these parameters affecting the system. And also these parameters can be monitor through internet by using Lab VIEW software.
V. EXPERIMENTAL RESULTS
The following figure illustrates the proposed system implementation.
Fig.5 Experimental Setup of the Proposed System VI. CONCLUSION
ISSN (Print) : 2320 – 3765 ISSN (Online): 2278 – 8875
I
nternational
J
ournal of
A
dvanced
R
esearch in
E
lectrical,
E
lectronics and
I
nstrumentation
E
ngineering
(A High Impact Factor, Monthly, Peer Reviewed Journal)
Website: www.ijareeie.com
Vol. 7, Issue 2, February 2018
inexact heart rate or a subject-particular edge abundance for R-waves), in this manner fortifying this present reality nature of the proposed keen protective cap recording.
ACKNOWLEDGEMENT
We would like to thank all those who provided us the possibility to propose this project. A special thanks to our Project Guide S.P.Vijayvardhan Reddy, Associate Professor and Project coordinator S. Jeya Anusuya, Associate Professor whose contribution in giving suggestions and encouragement helped us in completing this project.
REFERENCES
[1] J. G. Webster, “Reducing motion artifacts and interference in biopotential recording,” IEEE Transactions on Biomedical Engineering, vol. BME-31, no. 12, pp. 823–826, 1984.
[2] P. Mithun, P. C. Pandey, T. Sebastian, P. Mishra, and V. K. Pandey, “A wavelet based technique for suppression of EMG noise and motion artifact in ambulatory ECG,” in Proceedings of the IEEE Conference on Engineering in Medicine and Biology Society (EMBC), 2011, pp.7087– 7090.
[3] J. D. Bronzino, Biomedical Engineering Handbook Second Edition, vol. 1, CRC Press, 2nd edition, 1999.
[4] Sampsa Vanhatalo, Juha Voipio, and Kai Kaila, “Full-band EEG (FbEEG): an emerging standard in electroencephalography,” Clinical Neurophysiology, vol. 116, no. 1, pp. 1–8, 2005.
[5] Task Force of the European Society of Cardiology, the North American Society of Pacing, and Electrophysiology, “Heart rate variability: Standards of measurement, physiological interpretation, and clinical use,” European Heart Journal, vol. 17, pp. 354–181, 1996.
[6] E. G. Krug, G. K. Sharma, and R. Lozano, “The global burden of injuries.,” American Journal of Public Health, vol. 90, no. 4, pp. 523–526, 2000. [7] R. Bedini, A. Belardinelli, G. Palagi, M. Varanini, A. Ripoli, S. Berti, C. Carpeggiani, F. Paone, and R. Ceccarelli, “ECG telemetric evaluation in formula one drivers,” in Proceedings of the IEEE International Conference on Computers in Cardiology, 1995, pp. 353–356.
[8] A. Casson, D. Yates, S. Smith, J. Duncan, and E. Rodriguez-Villegas, “Wearable electroencephalography,” IEEE Engineering in Medicine and Biology Magazine, vol. 29, no. 3, pp. 44–56, 2010.
[9] Y. S. Kim, J. M. Choi, H. B. Lee, J. S. Kim, H. J. Baek, M. S. Ryu, R. H. Son, and K. S. Park, “Measurement of biomedical signals from helmet based system,” in Proceedings of the IEEE International Conference on Engineering in Medicine and Biology Society (EMBC), 2007, pp. 359–362. [10] D. Da He, E. S.Winokur, and C. G. Sodini, “A continuous, wearable, and wireless heart monitor using head ballistocardiogram (BCG) and head electrocardiogram (ECG),” in Proceedings of the IEEE International Conference on Engineering in Medicine and Biology Society (EMBC), 2011, pp. 4729–4732.
[11] T. Shen, T. Hsiao, Y. Liu, and T. He, “An ear-lead ECG based smart sensor system with voice biofeedback for daily activity monitoring,” in Proceedings of the IEEE International Region 10 Conference (TENCON), 2008, pp. 1–6.
[12] D. Looney, P. Kidmose, C. Park, M. Ungstrup, M. L. Rank, K. Rosenkranz, and D. P. Mandic, “The In-the-Ear recording concept: User-Centered and wearable brain monitoring,” IEEE Pulse, vol. 3, no. 6, pp. 32–42, 2012.
[13] D. Ebenezer and V. Krishnamurthy, “Wave digital matched filter for electrocardiogram preprocessing,” Journal of Biomedical Engineering, vol. 15, no. 2, pp. 132–134, 1993.