Article
Compressed orthogonal coded Multiplexing
Wide-band Millimeter Wave Imaging - A Numerical
Study
Hao Tu , Xiangxin Meng, Taorong Liu, Hui Feng and Shuai Wu *
1
2
3
4
5
6
7
8
9
10
11
12
13
BrainwareTerahertzInformationTechnologyCo.Ltd.,Hefei230001,China;[email protected](H.T.); [email protected](X.M.);[email protected](T.L.);[email protected](H.F.);[email protected] (S.W.)
* Correspondence:[email protected];Tel.:+86-551-6573-6511
Abstract: Millimeter wave wide-band imaging is widely studied for a variety of applications. However real-time millimeter wave wide-band imaging at frequencies above 30GHz for moving targets in a large field of view has not been realized commercially. A 2D sparse array with transmitter multiplexing is a promising solution to this problem. In this article, a method combining compressed sensing and orthogonal coded multiplexing was proposed, and the imaging performance was analyzed for different reconstruction algorithms and observation matrices by imaging simulation for a continuous object. Also the influence on the dynamic range of the original signal introduced by orthogonal coded multiplexing was studied. This work demonstrated that the proposed method was effective in reconstructing the image with a real-time capability. It is shown that different algorithms and matrices resulted in distinct performances, while the evaluation parameter selection also played a role. This work provided useful instructions for both the hardware and software design of a real-time 3D millimeter wave imaging system in the future.
Keywords: millimeter wave imaging; orthogonal coded multiplexing; compressed sensing; real-time imaging; dynamic range
14
1. Introduction 15
Millimeter wave (MMW) imaging has attracted a lot of attention recently, due to its potential 16
applications in personnel screening[1,2], industrial quality inspection[3,4], and medical imaging[5,6] 17
etc. The advantages of MMW imaging compared to some of the traditional methods include the 18
following. (1) No ionizing radiation is involved compared to X-ray imaging, making it safe for 19
personnel imaging. (2) It can penetrate through many dielectric substances, enabling its application 20
for hidden item identification and industrial inspection. (3) It is sensitive to water molecules so that 21
pathological changes can be distinguished from healthy tissues. (4) The imaging resolution can reach 22
millimeter level which is adequate for small item inspection. (5) Devices are more mature than those 23
in the terahertz band, which makes it more competent from the commercial point of view. 24
In many of the afore-mentioned real-life scenarios, such as security screening, real-time imaging 25
for moving targets and high resolution are required simultaneously. The solution to satisfy both the 26
requirements is adopting transmitter or receiver arrays. Pacific Northwest National Laboratory has 27
developed a linear antenna array around 30GHz, which is commercially used in the L3 ProVision 28
system for airport security check-points[2]. Fraunhofer Institute has adopted a W band linear array 29
for quality inspection[7]. These systems using linear array either mechanically scan the field of view, 30
or require the target to move on a conveyor belt, thus they are not able to image the field of view (FoV) 31
Preprints (www.preprints.org) | NOT PEER-REVIEWED | Posted: 10 November 2019
with a real-time frame rate. Johann Wolfgang Goethe-University proposed to combine a terahertz 32
linear array with a rotating trigonal mirror to realize real-time personnel screening[8]. But in the 33
dimension parallel to the array, a real aperture had to be formed which resulted in worse image 34
quality and severe specular reflection effect. 35
Aimed at solving real-time 3D MMW imaging problem, a lot of researches has focused on using 36
2D sparse arrays to substitute 1D linear arrays where the sampling speed can be increased by an 37
order of magnitude. Rohde and Schwarz developed a 2D sparse array system at E-band for security 38
check-points, which can realize a sampling speed of 16ms[9]. But according to the criterion that the 39
imaged object should move less than a quarter of the wavelength during the sampling time, this 40
speed is still not fast enough to image a walking person. MIT Lincoln Laboratory made a real-time 41
sparse array system by using phase center approximation to divide the array into smaller regions 42
where coherent accumulation was performed[10]. Although it reached a frame rate of 10Hz, the 43
approximation introduced severe image degradation at near range. Currently, there is no reported 44
system that can have a millimeter level resolution and a moving-target image capability, together with 45
a robust algorithm that brought no obvious quality degradation at all distances. The main problem is 46
that most of the systems used a time division multiplexing technology in which the transmitters are 47
electronically switched. This switching process is time-consuming, especially for the high resolution 48
systems at higher frequency band with more transmitter elements, preventing the system to image 49
moving objects. 50
Frequency or orthogonal coded multiplexing (OCM) technology can be used to eliminate the 51
switching process[11,12]. However, frequency multiplexing raises strict demands for low phase 52
noise and wide sampling bandwidth, both difficult to realize and increase system cost. On the other 53
hand, OCM replaces the switching between elements to switching between codes, as demonstrated 54
by University of Washington and Duke University. If the switch times of the two processes are the 55
same, then no reduction in sampling time is realized because the length of the code should be no less 56
than the number of the transmitters. 57
Aiming at real-time high-resolution millimeter wave imaging for security applications, we 58
propose and study a new method in this work, where OCM is combined with compressed sensing 59
(CS)[13], so that the code length is reduced and the sampling time is shortened. We analyze the 60
influence of different choices of reconstruction algorithms and observation matrices on the imaging 61
quality by using peak signal-to-noise ratio (PSNR) and image entropy as evaluation criteria. Imaging 62
under noisy environment is also simulated, which demonstrates that the proposed method works 63
better compared to time division multiplexing method when signal-to-noise ratio is low. We also 64
analyze the statistics of the echo signal at the receiver channels and discuss the influences on 65
the receiver channels. The results of this work provide some insights for the future design of a 66
high resolution MMW imaging system with real-time capability for moving targets by using OCM 67
technology. 68
This article is organized as follows. Section 2 introduces the theoretical model of the imaging 69
process with OCM and CS. Simulation results of the imaging quality for a continuous object are 70
displayed and analyzed for different algorithms and noise levels in Section 3. Signal statistical 71
characteristics is studied in Section 4. Section 5 concludes this work. 72
2. Imaging Model of OCM with CS 73
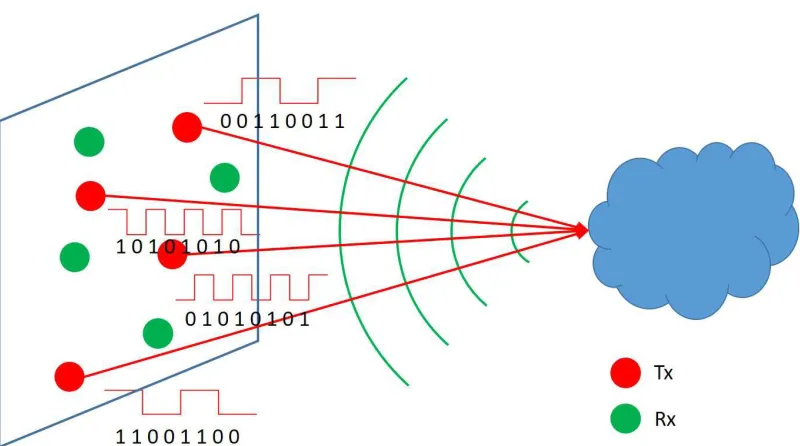
The imaging model discussed here is schemed in Figure 1 for a sparse array configuration. 74
The transmitters simultaneously transmit millimeter wave signals to the target area while the 75
back-scattered waves are detected by the receivers working in parallel. To distinguish signals coming 76
from distinct transmitters at a single receiver, the transmitted signals need to be coded where the code 77
3 of 12
Figure 1.A scheme diagram for the imaging process of OCM.
For simplicity, we discuss the situation where a single frequency is used here, and the results can be easily extended to the wide-band case. The echo signalSn(t)at then-th receiver is expressed as
Sn(t) =
∑
mCm(t)
Z Z Z
f(x,y,z)exp[−jk(Dm+Dn)]dxdydz (1)
wheretdenotes the slow time indexing the code sequences,Cm(t)is the code sequence for them-th
transmitter, f(x,y,z)is the complex scatter coefficient at location(x,y,z),kis the wave vector, and DmandDnare the distances from(x,y,z)to the transmitter and receiver, respectively. By discretizing
the target area into a set of voxels, Equation (1) can be written as
Sn(t) =
∑
m,iCm(t)exp[−jk(Dm+Dn)]fi (2)
whereiis the index for the voxels. It is easily seen that it can be further written in a matrix form as
Sn=ΦnF (3)
whereSn is a L×1 vector with Ldenotes the code length, F is a P×1 vector with P denotes the
number of voxels to be imaged, and Φ is the measurement matrix with dimension L×P whose elements are expressed as
Φl p=
∑
m
cm(l)exp[−jk(Dmp+Dnp)] (4)
When the signals for different receivers are combined together, the vectorSnis expanded to length 79
L×Nand the measurement matrixΦis expanded toLN×P, whereNis the total number of receivers.
80
In many imaging scenarios,LNis much less thanP, so Equation (4) becomes a compressive sensing 81
problem. However the matrixΦis usually so large that common compressive sensing solvers can 82
hardly give robust reconstruction results in a reasonable computation time. 83
To reduce the computation load, the imaging problem can be decomposed into two steps. The echo signal Smn for the m-th transmitter is decomposed from Sn(t) in the first step. To do this,
Equation (2) can be rewritten as
Sn(t) =
∑
mCm(t)Smn (5)
where
Smn =
∑
iexp[−jk(Dm+Dn)]fi (6)
Thus Equation (5) itself now is a compressive sensing problem when the code lengthLis smaller than the number of transmitters M, and Smn can be computed from readily available algorithms with a
reduced complexity. Then, in the second step, the well-known back-projection (BP) algorithm can be applied to reconstruct the image with
fi=
∑
m,nexp[jk(Dm+Dn)]Smn (7)
When a wide-band system is involved, we can obtain the 1D image in the depth-direction for each 84
transmitter-receiver pair by using pulse compression technique, and then apply the BP process[14,15] 85
with an interpolation of the 1D image to a rectangular grid. In the next section, we will analyze the 86
influences to the imaging result of different CS algorithms and measurement matrices following the 87
imaging process described by Equations (5)-(7). 88
3. Simulation results 89
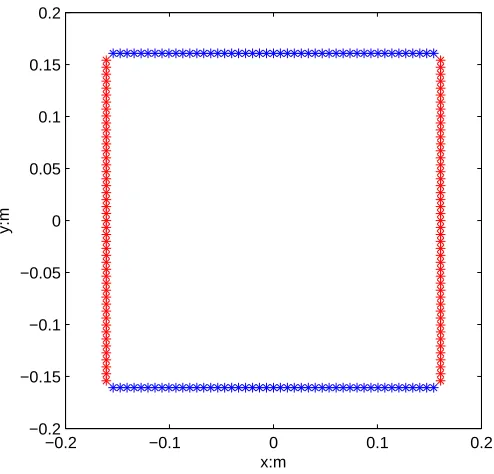
A rectangular-shaped sparse array configuration was used for the simulation as chosen in 90
Reference [9]. The array consisted of 94 transmitters and 94 receivers as shown in Figure 2. The 91
working band was chosen as 30-36GHz with 40 frequency steps. To better evaluate the performance 92
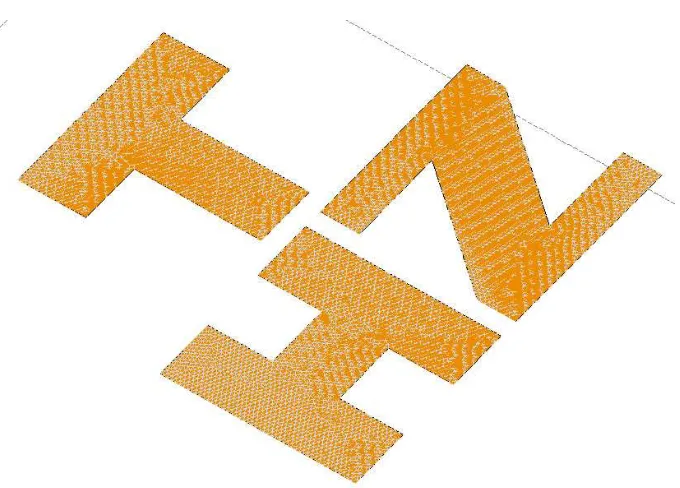
of the proposed method, the imaging target was chosen to be three continuous objects in the shape 93
of capital letters ’T’, ’H’ and ’Z’ as shown in Figure 3, rather than point targets. The targets were 94
composed of fully conductive materials and placed at a distance of 0.2m from the array. 95
−0.2 −0.1 0 0.1 0.2
−0.2 −0.15 −0.1 −0.05 0 0.05 0.1 0.15 0.2
x:m
y:m
5 of 12
Figure 3.The continuous target with the shapes of capital letters ’T’, ’H’ and ’Z’ used in the simulation.
Two parameters were used to judge the reconstruction quality. The first was the peak signal-to-noise ratio (PSNR) defined as in Reference [16] which is expressed as
PSNR=10 log10 max(F) 2
1
P∑Pi=1(F−Fˆ)2 !
(8)
where F represents the true solution of the target which is calculated for a non-compressive case, and ˆF is the reconstructed image. The second parameters was the two-dimensional image entropy, defined as
H=−
255
∑
i=0 255
∑
j=0
PijlnPij (9)
where H is the 2D image entropy, and Pij is a probability distribution function defined as 96
the probability that a pixel’s gray-scale value is i and the same pixel’s gray-scale value in an 97
average-filtered image isj. PSNR describes the deviation of the reconstructed image from the true 98
solution, which should be as large as possible. Image entropy describes the information contained 99
in the reconstructed image, or in other words, the level of order in the image, where a smaller value 100
denotes a better image quality. Imaging result from a time-division multiplexing method is used as 101
the ground truth, as shown in Figure 4. 102
Figure 4.Reconstruction results under time-multiplexing mode, working as the ground truth of the target.
There are many readily available CS algorithms to solve Equation (5)[17–19]. According 103
to the fact that the target information is unknown before the reconstruction, algorithms without 104
requirements of a-priori knowledge of the imaged scene are chosen. Three reconstruction algorithms 105
were tested in our simulation, namely the SLIM algorithm[20], the TVAL3 algorithm[21] and the 106
Hadamard relaxation method[22]. These algorithms were chosen due to their high computation 107
efficiency, especially the latter two, which is meaningful for real-time imaging applications. Also, 108
different choices of measurement matrix Cm were tested including standard Hadamard matrix, 109
Hadamard matrix generated from twin prime method[22], random matrix, and random Bernoulli 110
matrix. 111
First, imaging under ideal conditions with no noise present was simulated. Figure 5, Figure 6 112
and Figure 7 display the imaging results of the Hadamard relaxation method, the SLIM algorithm and 113
the TVAL3 algorithm at 50% under-sampling ratio for different measurement matrices, respectively, 114
while we point out that the computation process failed to converge when the SLIM method was used 115
with the standard Hadamard matrix as the measurement matrix. Note that due to the restriction of the 116
Hadamard relaxation method, the matrices generated for this method had a dimension of 143×143,
117
while the other matrices had dimensions of 94×94.
118
7 of 12
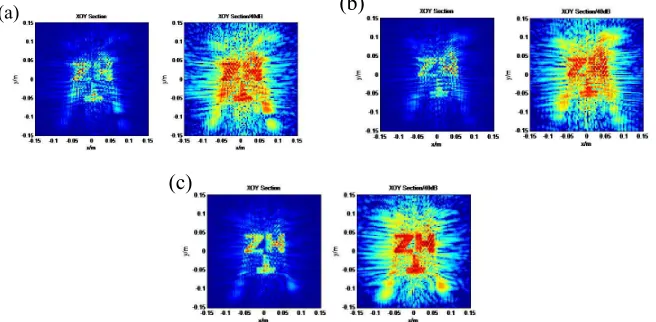
Figure 6.Reconstruction results of the SLIM algorithm at 50% under-sampling ratio for measurement matrices of (a) random Bernoulli matrix, (b) random matrix, (c) Hadamard matrix generated by the twin-prime method. In each of the sub-image, the magnitude is shown in a linear-scale on the left side, and in a logarithmic-scale on the right side with a 40-dB dynamic range.
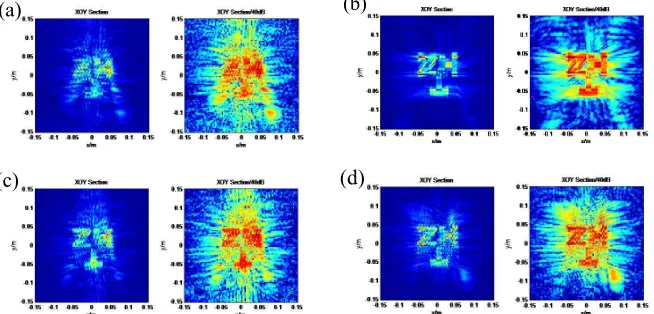
Figure 7. Reconstruction results of the TVAL3 algorithm at 50% under-sampling ratio for measurement matrices of (a) random Bernoulli matrix, (b) standard Hadamard matrix, (c) random matrix, (d) Hadamard matrix generated by the twin-prime method. In each of the sub-image, the magnitude is shown in a linear-scale on the left side, and in a logarithmic-scale on the right side with a 40-dB dynamic range.
From Figure 5 to Figure 7, it can be seen that the SLIM method generated the worse 119
reconstruction results where the shapes of the letters were indiscernible, while the other two 120
algorithms could successfully reconstruct the images containing the three letters, so the SLIM method 121
is dropped for the following discussions. The image qualities of these images were obviously 122
degraded caused by the down-sampling, compared to the ground truth shown in Figure 4. Two of 123
these images looked best with the clearest boundary of the letters and lowest background noises. 124
These two were generated from the combination of the Hadamard relaxation method with the 125
twin-prime Hadamard matrix (referred to as Rlx+Twin method in the following), and the TVAL3 126
algorithm with the standard Hadamard matrix (referred to as TVAL3+Had method in the following), 127
respectively. To quantitatively evaluate the performance of these methods, the PSNR and image 128
entropy are plotted in Figure 8 for down-sampling ratio from 10% to 90%. It is demonstrated in Figure 129
8 that the Rlx+Twin method has the highest PSNR and the TVAL3+Had method has the lowest image 130
entropy. This result is consistent with the conclusion reached by visual inspection that these two 131
methods give the best imaging result. However these two evaluation criterion give distinct results, 132
meaning that the method with the lowest entropy does not have the highest PSNR, and vice versa. 133
This might be due to the different aspects concerned by the two parameters, where PSNR describes 134
the maximum deviation from the ground truth and the image entropy focuses on the amount of 135
information contained in an image. 136
Figure 8. (a) PSNR for different combinations of CS algorithms and measurement matrices as a function of down-sampling rate. (b) Image entropy for different combinations of CS algorithms and measurement matrices as a function of down-sampling rate.
To demonstrate the robustness of the Rlx+Twin method and the TVAL3+Had method, we added 137
random Gaussian noises to the original signals and reconstructed the images with the two methods. 138
The signal-to-noise ratio (SNR) is defined as the magnitude of the additive noise to the maximum 139
signal acquired during a time-division multiplexing sampling where no OCM is applied. And the 140
under-sampling ratio was set to 50%. Reconstruction results are displayed in Figure 9 to Figure 11 for 141
SNR of 10dB, 0dB and -10dB, respectively, where the results for time-division multiplexing are also 142
shown as a comparison. 143
9 of 12
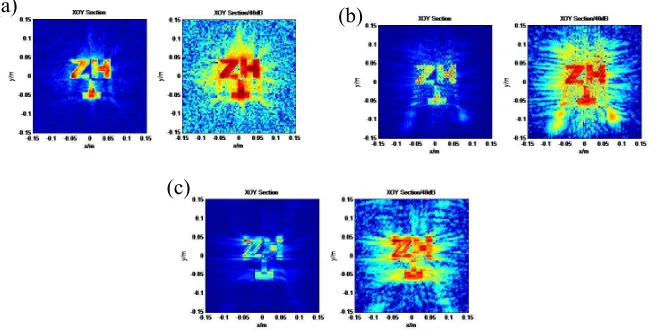
Figure 10. Reconstruction results under SNR=0dB for (a) time-division multiplexing, (b) Rlx+Twin method, (c) TVAL3+Had method. In each of the sub-image, the magnitude is shown in a linear-scale on the left side, and in a logarithmic-scale on the right side with a 40-dB dynamic range.
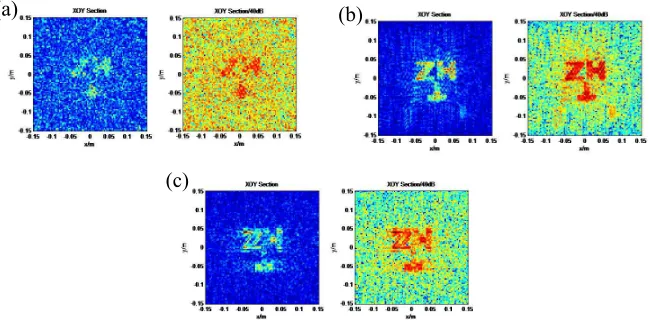
Figure 11.Reconstruction results under SNR=-10dB for (a) time-division multiplexing, (b) Rlx+Twin method, (c) TVAL3+Had method. In each of the sub-image, the magnitude is shown in a linear-scale on the left side, and in a logarithmic-scale on the right side with a 40-dB dynamic range.
From Figure 9-11, it can be seen that the proposed OCM method combined with CS technology 144
can successively reconstruct the targets in noisy conditions. For high SNR cases, all three methods 145
generated good reconstruction quality. But when noise is strong, as in the SNR=-10dB case, TDM 146
failed to produce a clear image of the three letters, while the proposed methods gave better results, 147
especially the Rlx+Twin method, which still produced a clear image of the targets. This result 148
demonstrated the robustness of the Rlx+Twin method and the TVAL3+Had method, and proved that 149
by using OCM with CS, better reconstruction quality could be obtained compared to the traditional 150
TDM methods. In Figure 12, SNR was tuned from -30dB to 40dB, and the PSNR and the image 151
entropy were used to evaluate the performance of the three methods. It is seen that at high SNR, the 152
TDM methods give the best reconstruction quality due to its full sampling. As the SNR lowers, the 153
performances of the three methods became similar. And as the SNR further decreases below 0dB, the 154
Rlx+Twin and TVAL3+Had methods could give better results. Similar to the previous results shown 155
in Figure 8, different evaluation criterion favored different methods for low SNR case between 0dB 156
and -20dB, whereas the Rlx+Twin method generated the highest PSNR, and the TVAL3+Had method 157
reached the lowest entropy. Note that below -20dB SNR all methods failed to reconstruct the targets. 158
Figure 12.(a) PSNR for TDM, Rlx+Twin method and TVAL3+Had method at different SNR. (b) Image entropy for TDM, Rlx+Twin method and TVAL3+Had method at different SNR.
4. Signal Statistics 159
In the previous section, the capability of reconstructing images by the proposed method 160
both under ideal and noisy conditions was illustrated. But since OCM method utilizes multiple 161
transmitters simultaneously which may result in strong coherent effects, the magnitude of the 162
received signal may be larger than that in a conventional TDM method. Thus the maximum signal 163
acceptable by the DAQ and also the dynamic range need to be selected carefully according to the 164
signal statistics. So in this section, we briefly display the signal statistics of the TDM, Rlx+Twin and 165
TVAL3+Had method and summarizes the influence brought by applying our proposed method on 166
the receiver channel. 167
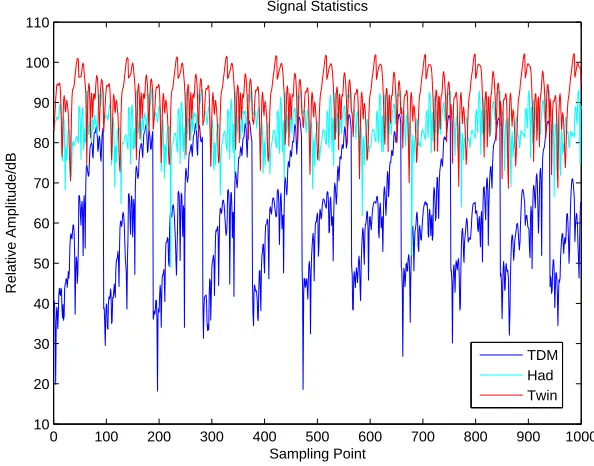
In Figure 13, the power of the simulated signal for TDM, standard Hadamard matrix coded 168
and twin-prime Hadamard matrix coded cases are displayed for the first 1000 points, respectively. It 169
is obvious seen in this figure that by applying OCM method, the power of the back-scattered signal 170
from the targets is largely increased by several octaves, which is further proved by the signal statistics 171
shown in Table 1. 172
0 100 200 300 400 500 600 700 800 900 1000 10
20 30 40 50 60 70 80 90 100 110
Sampling Point
Relative Amplitude/dB
Signal Statistics
TDM Had Twin
11 of 12
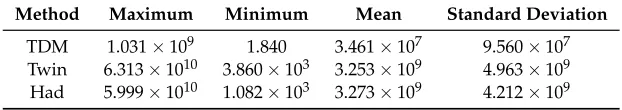
Table 1.Signal statistics for TDM, Hadamard matrix coded and twin-prime Hadamard matrix coded cases.
Method Maximum Minimum Mean Standard Deviation
TDM 1.031×10⁹ 1.840 3.461×10⁷ 9.560×10⁷
Twin 6.313×10¹⁰ 3.860×10³ 3.253×10⁹ 4.963×10⁹
Had 5.999×10¹⁰ 1.082×10³ 3.273×10⁹ 4.212×10⁹
It is seen from Table 1 that the mean echo signal power is increased by approximately two orders 173
of magnitude when the OCM method is used instead of TDM method. And the maximum echo 174
signal is increased 60 times, which is in accordance with the case of constructive interference for 94 175
receiver channels, where the signal should be multiplied by 94 times theoretically. This indicates 176
that the compression point of the receiver channel need to be higher for about two octaves when 177
OCM method is used. For the security check application at close range, this can be easily achieved 178
by modern semi-conductor fabrication technologies and analog-to-digital modules (AD). Now we 179
analyze the influence on the dynamic range of the receiver. From the previous section, we can see 180
that the acceptable noise level for OCM can be one order of magnitude higher than for TDM method. 181
Given that the signal is two octaves higher, the dynamic range, which can be represented by the 182
maximum signal divided by the noise level, should be one order of magnitude higher when OCM 183
method is involved. Note that in the current active millimeter-wave body scanners, the dynamic 184
range at the receiver side is usually much higher than 0dB, which is the lowest acceptable level in our 185
simulated results, thus we infer that the OCM method should be applicable without further increase 186
the dynamic range of the receiver channel and the analog-to-digital module. 187
These analysis verified the applicability of the proposed method from the hardware perspectives. 188
5. Conclusions 189
Aiming at high-resolution real time active millimeter wave imaging for security applications, a 190
method combining orthogonal coded multiplexing and compressed sensing was proposed in this 191
work for sparse array configuration. The performance for different CS algorithms and different 192
choices of coding matrices was analyzed and compared to the time division multiplexing method. 193
By visually checking, calculating the PSNR and image entropy, it was found that the Rlx+Twin and 194
TVAL3+Had methods reached the best imaging performance, where Rlx+Twin method was even 195
better for noisy circumstances. Compared to the TDM method, the proposed method was more 196
robust under worse SNR. Also the statistics for the echo signal was studied to prove the feasibility of 197
the method for current available hardware. In the future, the simulations for more complex targets, 198
such as a human body model, should be carried out to further prove the performance of this method. 199
And to build a real system, we still need to construct a computation routine to be effectively executed 200
in a CPU or GPU to realize real-time imaging. 201
Author Contributions:conceptualization, H.T.; methodology and simulation, H.T. and X.M.; data analysis, H.T.;
202
validation, T.L. and H.F.; supervision, S.W.
203
Funding:This research received no external funding.
204
Acknowledgments:We thank Wusheng Yao and Lin Chen for helpful discussions.
205
Conflicts of Interest:The authors declare no conflict of interest.
206
References 207
1. Appleby, R., Anderton R.N. Millimeter-wave and submillimeterwave imaging for security and
208
surveillance.Proc. IEEE2007,95, 1683–1690.
209
2. Sheen, D.M., McMakin D.L., Hall T.E. Three-dimensional millimeter-wave imaging for concealed weapon
210
detection.IEEE Trans. Microw. Theory Tech.2001,49, 1581–1592.
211
3. Viegas, C., Alderman, B., Powell, J., Liu, H., Wang, H., Sloan, R. Millimeter wave radiometers for
212
applications in imaging and nondestructive testing. 2015 8th UK, Europe, China Millimeter Waves and THz 213
Technology Workshop (UCMMT)2015, Sep. 2015.
214
4. Guo, Q., Chang, T., Cui, H. Three-dimensional millimeter wave imaging of borehole wall cracks. 43rd 215
International Conference on Infrared, Millimeter, and Terahertz Waves (IRMMW-THz)2018, Sep. 2018.
216
5. Gao, Y., Zoughi, R. Millimeter wave reflectometry and imaging for noninvasive diagnosis of skin burn
217
injuries.IEEE Trans. Instrum. Meas.2017,66, 77–84.
218
6. Oppelt, D., Korf, P., Adametz, J., Groh, J., Vossiek, M., Zhuravleva, K., Goertz, O. Effects of Different Types
219
of Burn Wounds and its Dressings on Millimeter-Wave Images.Frequenz2018,72, 151–158.
220
7. Baccouche, B., Agostini, P., Mohammadzadeh, S., Kahl, M., Weisenstein, C., Jonuscheit, J., Keil, A., Loeffler,
221
T., Sauer-Greff, W., Urbansky, R., Bolivar, P.H., Friederich, F. Three-Dimensional Terahertz Imaging With
222
Sparse Multistatic Line Arrays.IEEE Journal of Selected Topics in Quantum Electronics2017,23, 8501411.
223
8. Friederich, F., von Spiegel, W., Bauer, M., Meng, F., Thomson, M.D., Boppel, S., Lisauskas, A., Hils, B.,
224
Krozer, V., Keil, A., Loeffler, T., Henneberger, R., Huhn, A.K., Spickermann, G., Bolivar, P.H., Roskos, H.G.
225
THz Active Imaging Systems With Real-Time Capabilities.IEEE Trans. Terahertz Sci. Tech.2011,1, 183–200.
226
9. Ahmed, S.S., Schiessl, A., Schmidt, L.P. A Novel Fully Electronic Active Real-Time Imager Based on a Planar
227
Multistatic Sparse Array.IEEE Trans. Microw. Theory Tech.2011,59, 3567–3576.
228
10. Moulder, W.F., Krieger, J.D., Majewski, J.J., Coldwell, C.M., Nguyen, H.T., Maurais-Galejs, D.T., Anderson,
229
T.L., Dufilie, P., Herd, J.S. Development of a High-Throughput Microwave Imaging System for Concealed
230
Weapons Detection.2016 IEEE International Symposium on Phased Array Systems and Technology(PSAT)2016,
231
Oct. 2016.
232
11. Koeppel, T., Methfessel, S., Schiessl, A., Schmidt, L.P., Increasing Measurement Speed in mm-Wave Imaging
233
Systems by Means of Frequency Multiplexing.2013 European Microwave Conference2013, Oct. 2013.
234
12. Pedross-Engel, A., Arnitz, D., Gollub, J.N., Yurduseven, O., Trofatter, K.P., Imani, M.F., Sleasman, T.,
235
Boyarsky, M., Fu, X., Marks, D.L., Smith, D.R., Reynolds, M.S. Orthogonal Coded Active Illumination
236
for Millimeter Wave, Massive-MIMO Computational Imaging with Metasurface Antennas. IEEE Trans. 237
Computational Imag.2018,4, 184–193.
238
13. Candes, E.J., Romberg, J., Tao, T. Robust Uncertainty Principles: Exact Signal Reconstruction from Highly
239
Incomplete Frequency Information.IEEE Trans. Inf. Theory2006,52, 489–509.
240
14. Desai M., Jenkins, W. Convolution Backprojection Image Reconstruction for Spotlight Mode Synthetic
241
Aperture Radar.IEEE Trans. Image Proc.1992,1, 505–517.
242
15. Ulander, L., Hellsten, H., Stenstrom, G. Synthetic-Aperture Radar Processing using Fast Factorized
243
Back-projection.IEEE Trans. Aerospace Electronic Sys.2003,39, 760–776.
244
16. Zamani, H., Fakharzadeh, M. 1.5-D Sparse Array for Millimeter-Wave Imaging Based on Compressive
245
Sensing Techniques.IEEE Trans. Antenna Propagation2018,66, 2008–2015.
246
17. Mota, J.F.C., Xavier, J.M.F., Aguiar, P.M.Q., Puschel, M. Distributed Basis Pursuit. IEEE Trans. Sig. Proc 247
2012,60, 1942–1956.
248
18. Tropp, J.A., Gilbert, A.C. Signal Recovery from Random Measurements via Orthogonal Matching Pursuit.
249
IEEE Trans. Inf. Theory2007,53, 4655–4666.
250
19. Tu, H., Bu, W., Wang, W., Gao, B., Feng, H., Wu, S. Applicability of Hadamard relaxation method to MMW
251
and THz Imaging with compressive sensing.Sig. Image Video Proc.2017,11, 399–406.
252
20. Tan, X., Roberts, W., Li, J., Stoica, P. Sparse Learning Via Iterative Minimization With Application To Mimo
253
Radar Imaging.IEEE Trans. Signal Proc.2011,59, 1088–1101.
254
21. Li, C.B., Yin, W.T., Jiang, H., Zhang, Y. An Efficient Augmented Lagrangian Method with Applications to
255
Total Variation Minimization.Comput. Optim. Appl.201356, 507–530.
256
22. Gopalsami, N., Liao, S.L., Elmer, T.W., Koehl, E.R., Heifetz, A., Raptis,A.C., Spinoulas, L., Katsaggelos, A.K.
257
Passive Millimeterwave Imaging with Compressive Sensing.Opt. Eng.2012,51, 091614-091622.
258