International Journal of Nanomedicine
Dove
press
O r I g I N a l r e s e a r c h
open access to scientific and medical research
Open access Full Text article
Process optimization and evaluation of novel
baicalin solid nanocrystals
Peng-Fei Yue1,2
Yu li1
Jing Wan1
Yong Wang1
Ming Yang1
Wei-Feng Zhu1
chang-hong Wang2
hai-long Yuan3
1Key lab of Modern Preparation of
TcM, Jiangxi University of Traditional chinese Medicine, Nanchang,
2Institute of chinese Materia Medica,
shanghai University of Traditional chinese Medicine, shanghai, 3302
hospital of Pla Institute of chinese Materia Medica, Beijing, People’s republic of china
correspondence: Peng-Fei Yue; Ming Yang Key lab of Modern Preparation of TcM, Jiangxi University of Traditional chinese Medicine, rD 818 Xingwan, Nanchang, People’s republic of china
Tel +86 791 8711 8108 Fax +86 791 8711 8658 email [email protected]; [email protected]
Abstract: The objective of this study was to prepare baicalin solid nanocrystals (BCN-SNS) to enhance oral bioavailability of baicalin. A Box–Behnken design approach was used for process optimization. The physicochemical properties and pharmacokinetics of the optimal BCN-SNS were investigated. Multiple linear regression analysis for process optimization revealed that the fine BCN-SNS was obtained wherein the optimal values of homogenization pres sure (bar), homogenization cycles (cycles), amount of TPGS to drug (w/w), and amount of MCCS to drug (w/w) were 850 bar, 25 cycles, 10%, and 10%, respectively. Transmission electron microscopy and scanning electron microscopy results indicated that no significant aggregation or crystal growth could be observed in the redispersed freeze-dried BCN-SNS. Differential scanning calo-rimetry and X-ray diffraction results showed that BCN remained in a crystalline state. Dissolution velocity of the freeze-dried BCN-SNS powder was distinctly superior compared to those of the crude powder and physical mixture. The bioavailability of BCN in rats was increased remarkably after oral administration of BCN-SNS (P , 0.05), compared with those of BCN or the physical mixture. The SNS might be a good choice for oral administration of poorly soluble BCN, due to an improvement of the bioavailability and dissolution velocity of BCN-SNS.
Keywords: baicalin, solid nanocrystals, optimization, in vivo/vitro evaluation
Introduction
Baicalin (BCN; 7-d-gluconic acid, 5,6-dihydroxy flavone) (Figure 1), one of the
major bioactive flavone glucuronides present in the radix of Scutellaria baicalensis, is
generally used in traditional Chinese medicine as a remedy for the treatment of
inflam-mation, fever, and allergic diseases.1 Due to the glycosyl group on the ring, BCN is
poorly absorbed after oral administration, which causes low bioavailability and limits
its therapeutic efficacy and clinical application.2,3 Because of its poor water solubility,
the oral administration of BCN often results in erratic pharmacological activity. The poor absorption issue of poorly water-soluble drugs is known as a severe challenge for pharmaceutical development for improving drug therapeutic effectiveness. Nanonization technology is a promising formulation strategy for poorly water-soluble drugs, which could have some appealing advantages, such as increased saturation, solubility, or
drug-dissolution velocity, compared with coarse or micronized drug powder.4–6 So far,
various nanonization formulations of BCN have been used to improve its bioavailability,
such as nanoparticles, liposomes, and nanoemulsions.7–9 However, these approaches
still had some disadvantages, such as poor entrapment efficiency and low drug-loading, and were not able to give satisfactory results for BCN as expected.
International Journal of Nanomedicine downloaded from https://www.dovepress.com/ by 118.70.13.36 on 23-Aug-2020
For personal use only.
Number of times this article has been viewed
This article was published in the following Dove Press journal: International Journal of Nanomedicine
Dovepress
Yue et al
Recently, nanosuspension (NS) technology has been successfully used to tackle the formulation problem of
poorly soluble drugs.10,11 Remarkable NS properties, such
as increased drug solubility and drug-loading capability (Figure 2), simple production process, easy scale-up, and universal adaptivity enable its applications in the formulation of large amounts of poorly soluble compounds. Furthermore, to improve patient convenience and physical stability issues
of NS,12 it is usually preferable to transform liquid NS (LNS)
into solid nanocrystals (SNS) via freeze-drying, spray-drying, or vacuum-spraying, and SNS can be redispersed into fine NS instantaneously with aqueous media in vitro or in the
gastrointestinal tract.13
Commonly, NS techniques are classified as bottom-up
methods14,15 or top-down methods,16,17 according to the
dif-ferences in production principle. High-pressure homogeni-zation technology is a promising method for preparing NS. However, there are many process factors that can affect the physicochemical characterizations of the obtained NS, such as particle size and particle-size distribution. Some of these factors are stabilizer or polymer amount, homogenization
pressure, and homogenization circles.18 How to determine
which actual values of these variables result in a response value that is near the optimum? Box–Behnken design meth-odology is a well-known approach for formulation-process optimization, which can get the most information from a
few well-designed experiments.19 Box–Behnken design has
been comprehensively adopted to optimize the process of
formulations.20–23 Those studies demonstrated the apparent
advantage of Box–Behnken design utilization in the formula-optimization process.
The main objectives of this study were: (1) to prepare acceptable BCN-NS, the Box–Behnken design approach was used for optimization of process variables, such as amounts of microcrystalline cellulose and carboxymethyl
cellulose sodium (MCCS) or d-α-tocopherol polyethylene
glycol 1000 succinate (TPGS), homogenization pressure, and homogenization circles; (2) to get BCN-SNS with good redispersibility, acceptable BCN-NS was freeze-dried; furthermore, the redispersibility of BCN-SNS after freeze-drying was investigated; (3) to systematically evaluate the physicochemical properties of BCN-SNS by particle-size analysis, transmission electron microscopy (TEM), dif-ferential scanning calorimetry (DSC), and powder X-ray diffraction (XRD). Furthermore, the dissolution and phar-macokinetic characteristics of BCN-SNS were also evaluated after oral administration.
Materials and methods
Materials
BCN was purchased from Zelang (.98%, Nanjing, People’s
Republic of China). TPGS was purchased from Xi’an Health-ful Biotechnology (Xi’an, People’s Republic of China). MCCS (Ceolus RC-A591 NF; Asahi Kasei, Tokyo, Japan) was commercially obtained.
Methods
Nanosuspension production
BCN-NS was prepared via high-pressure homogenization. Before producing BCN-NS, BCN coarse powder 1% (w/v), MCCS, and TPGS were dispersed in 100 mL water. The obtained mixture was disintegrated into coarse suspension by a high-shear homogenizer (FA25; Fluko, Shanghai, People’s Republic of China) at 16,000 rpm for 5 minutes. Then, the gained coarse BCN suspension was homogenized at predeter-mined pressure using a piston-gap high-pressure homogenizer (AH-1000D; ATS Engineering, Seeker, Canada). The premill-ing step was firstly carried out at 200 bar for five cycles, and then the BCN-NSs were homogenized at 600–1000 bar for 10–30 cycles.
OH
OH OH OH
O O
O O
O
HO
HO
Figure 1 Thechemical structure of baicalin.
Polymer
Solid lipid Blend ofsolid lipid and oi l
Oil
Baicalin loading ≈100%
Baicalin Drug loading << 100%
Nanosuspension
Polymer nanoparticles Nanostuctured
lipid carriers Solid lipid nanoparticle
Nanoemulsions
Figure 2 comparison of nanosuspension with other nanosize delivery systems.
International Journal of Nanomedicine downloaded from https://www.dovepress.com/ by 118.70.13.36 on 23-Aug-2020
Dovepress Process optimization and evaluation
Box–Behnken design
Independent and response variables
Preliminary screening trials were carried out for evalu-ating the formulation process parameters of BCN-NS. Such factors as homogenization pressure, homogenization cycles, amount of TPGS to drug, and amount of MCCS to drug were identified as critical to give a product in the nanorange and with the required stability. Results from the preliminary screening trials suggested that homogeniza-tion pressure, homogenizahomogeniza-tion cycles, amount of TPGS to drug, and amount of MCCS to drug were the main factors that significantly affected particle size and zeta potential of the BCN-NS.
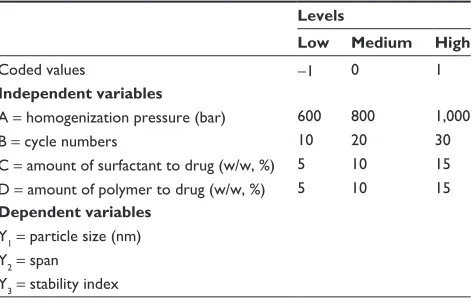
To reduce the number of trials and attain the most information on properties of the fine NS, the screening was planned applying a Box–Behnken design. According to the principles of Box–Behnken design, homogenization pres-sure (A, bar), homogenization cycles (B, cycles), amount of TPGS to drug (C, %, w/w), and amount of MCCS to drug (D, %, w/w), defined as independent values, were evaluated as four response values (Table 1), and the mean
diameter (Y1, µm), span (Y2), and stability index (Y3) were
defined as response values in the mathematical modeling, respectively. Each of the 29 formulations of a trial was produced three times in order to estimate the precision of the amount of TPGS to drug, amount of MCCS to drug, homogenization pressure, and homogenization cycles (see Table 2).
aNOVa analysis of model
A statistical model with interactive and polynomial terms was used to evaluate the response values using the
formula24:
Y b b x b x x b x b x x
b x x b
i i
i ij
ij
i j i
j
i ij
ij
i j
ij ij
i j i
= + + + + +
+ +
0 2 2
2
∑
∑
∑
∑
∑
jj i x
∑
3+ε (1)where Y represented the response variables, x represented
the variables of the system, i and j were design variables,
b represented model coefficients that were estimated using
a least square fit of the model to the experimental results
obtained during the design runs, and ε was the error.
To ensure a desirable model, test for significance of the regression model, test for significance on individual model coefficients, and test for lack of fit were performed. In order to summarize the tests performed, analysis of variance (ANOVA) was commonly used. The fitted model is adequate if the model is significant and the lack of fit is not significant.
Optimization
The desirability-function approach can be used to optimize
the four response variables simultaneously.25 The desirability
Table 1 Process variables and their levels used in the Box– Behnken design
Levels
Low Medium High
coded values -1 0 1
Independent variables
a = homogenization pressure (bar) 600 800 1,000
B = cycle numbers 10 20 30
c = amount of surfactant to drug (w/w, %) 5 10 15 D = amount of polymer to drug (w/w, %) 5 10 15
Dependent variables
Y1= particle size (nm) Y2= span
Y3= stability index
Table 2 The Box–Behnken design and the corresponding responded measurements
Run A B C D Y1 Y2 Y3
1 -1 -1 0 0 1.369 1.738 0.612
2 -1 1 0 0 1.387 1.273 0.637
3 -1 0 0 -1 1.417 1.349 0.511
4 -1 0 0 1 1.383 1.53 0.577
5 -1 0 -1 0 1.454 1.225 0.596
6 -1 0 1 0 1.105 1.336 0.592
7 0 0 -1 -1 0.714 1.621 0.637
8 0 0 1 -1 0.574 1.644 0.677
9 0 0 -1 1 0.603 1.591 0.728
10 0 0 1 1 0.708 1.672 0.795
11 0 -1 -1 0 1.226 2.818 0.754
12 0 1 -1 0 0.655 1.515 0.734
13 0 -1 1 0 0.736 2.839 0.782
14 0 1 1 0 0.566 1.569 0.792
15 0 -1 0 -1 0.879 2.877 0.621
16 0 1 0 -1 0.67 1.681 0.653
17 0 -1 0 1 0.915 2.758 0.754
18 0 1 0 1 0.625 1.536 0.715
19 0 0 0 0 0.541 1.468 0.733
20 0 0 0 0 0.503 1.58 0.742
21 0 0 0 0 0.506 1.617 0.751
22 0 0 0 0 0.516 1.599 0.738
23 0 0 0 0 0.588 1.655 0.741
24 1 -1 0 0 0.535 3.251 0.642
25 1 1 0 0 0.542 2.272 0.757
26 1 0 0 -1 0.513 2.617 0.615
27 1 0 0 1 0.602 2.642 0.728
28 1 0 -1 0 0.588 2.783 0.686
29 1 0 1 0 0.539 2.631 0.777
International Journal of Nanomedicine downloaded from https://www.dovepress.com/ by 118.70.13.36 on 23-Aug-2020
Dovepress
Yue et al
function was achieved with Design-Expert (Stat-Ease, Minneapolis, MN, USA). Each response variable can be assigned an importance relative to the other responses.
Importance (ri) varies from the least important (¨), a value
of 1, to the most important (¨¨¨¨¨), a value of 5. If varying
degrees of importance are assigned to the different response variables, the objective function is given as follows:
D d r d r d rn n r d
i r
i
n r
i i
i =
(
× ×⋅⋅⋅)
∑ =
∑ =
∏
1 1 2 2
1
1 1
(2)
where di is the partial desirability function of each response
vari-able obtained from the transformation of the individual response
variable of each experiment, n is the number of response
variables in the measure, and ri reflects the importance of each
response variable. If all the importance variables are the same, the simultaneous objective function reduces to the normal form for desirability. Taking into account all of the requirements for each response, the process-variable conditions that maximize D can be determined. One can see that a high value of D is
obtained only if all individual di values are high.
Verification
According to the results of the optimization experiment, the predicted optimum values of process parameters were verified by five parallel experiments.
Particle size and span determined by laser diffractometry
Laser diffractometry was performed on a Mastersizer Micro Plus (Malvern Instruments, Malvern, UK). The diffraction patterns were performed using the Mie model (particle
refrac-tive index = 1.53, imaginary particle refractive index = 0.1).
From the resulting volume distributions, the D50 value
(= 50% volume percentile) was calculated. All measurements
were performed in triplicate.
stability index
The stability of BCN-NS was evaluated by stability index
(SI),26 as follows:
SI= D ×
D c
0
100%
where D0 is the particle-size D50 value of the BCN-NS
before centrifugation and Dc is the corresponding D50
value of BCN-NS post-centrifugation at speed 1500 rpm for 30 minutes. D50 means that 50% of the particles are below the given size. An SI value of near 100% usually means that BCN-NS is more stable.
Freeze-drying of BcN-Ns
The BCN-NS was transferred into a 100 mL vial and sucrose was added (0%, 50%, 100%, or 200%, relative to the weight of BCN). Then, the BCN-NSs were frozen by immersing the vials in liquid nitrogen. Freeze-drying of the BCN-NS was performed with a freeze-dryer (FD5 series; Gold SIM, Beijing, People’s Republic
of China) at -20°C and at 0.10 mbar of pressure, and the vials
were removed after 48 hours of drying. Then the BCN-SNS was obtained. Each formulation was produced in triplicate.
The stability of BCN-SNS after freeze-drying was evalu-ated applying the redispersibility index (RDI), as follows:
RDI= D ×
D0 100%
where D0 is the volume-weighted mean particle size of the
BCN-NS directly before freeze-drying and D is the
cor-responding value of the redispersed BCN-NS after freeze-drying. An RDI value of near 100% means that BCN-SNS obtained by freeze-drying can be completely redispersed to BCN-NS with original particle size after rehydration.
characterization of BcN-sNs
The morphology of BCN-NS was observed by TEM (JEM-1200EX; JEOL, Tokyo, Japan). One drop of BCN-NS was placed on a copper grid and stained with 2% phosphotungstic acid solution for 5 minutes. The grid was dried at room tem-perature and was evaluated with the electron microscope.
scanning electron microscopy
Morphological evaluation of the coarse BCN and representa-tive samples of BCN-SNS powder was performed and com-parisons made with a scanning electron microscope (SEM; Nova NanoSEM 45; FEI, Hillsboro, OR, USA). All samples were evaluated on a brass stub using carbon double-sided
tape. The samples were gold coated (thickness ≈ 15–20 nm)
with a sputter coater (Fisons, Ipswich, UK) using an electrical potential of 2.0 kV at 25 mA for 10 minutes. An excitation voltage of 20 kV was used in the experiments.
Differential scanning calorimetry
DSC measurements of the coarse BCN powder, stabilizers, BCN-SNS powder, and physical mixture were performed using a Diamond DSC (PerkinElmer, Waltham, MA, USA) equipped with an intercooler. Calibration for temperature and heat of fusion was performed with indium and tin as reference materials. The samples were evaluated in open aluminum pans and scanned under a nitrogen purge with a heating rate of
International Journal of Nanomedicine downloaded from https://www.dovepress.com/ by 118.70.13.36 on 23-Aug-2020
Dovepress Process optimization and evaluation
10°C/minute from 50°C to 300°C above the expected melting
point. The measurement was performed in triplicate.
Powder X-ray diffraction
The characteristics of the stabilizers, coarse BCN powder, BCN-SNS powder, and physical mixture were analyzed by powder XRD (D8 Advance; Bruker Optik, Ettlingen, Germany) with Cu source of radiation. Measurements were carried out at a voltage of 40 kV and 25 mA. The
scanned angle was performed from 3°#2ϑ#60°, and the
scanning rate was 2°/minute. Measurements were carried
out in triplicate.
solubility measurement of BcN-sNs
Equilibrium solubility of coarse BCN, BCN-SNS, or physical
mixture was performed by shake-flask method.27,28 Excess
amounts of coarse BCN, BCN-SNS, and physical mixture were added in water and equilibrated in a shaker water bath (HZ-92 1K; Taicang Instrument, Taicang, People’s Republic
of China) at 37°C for 48 hours. Vials were sealed to avoid
loss due to evaporation and shielded from light to prevent any degradation of BCN. As soon as equilibrium was reached, suspensions were firstly subjected to ultracentrifuge and then
filtered through 0.22 µm syringe filters. An aliquot of filtrate
was determined by high-performance liquid chromatography (HPLC) to evaluate the dissolved amount of BCN.
In vitro dissolution studies of BcN-sNs
Dissolution characterization of BCN-SNS, coarse BCN powder, and physical mixture containing the same amount of BCN (100 mg) was evaluated. According to the China Pharmacopoeia Appendix XC paddle method, a dissolution apparatus (RC-8; Tianjin Guoming Medicine and Equipment, Tianjin, People’s Republic of China) was used.
Phosphate-buffered saline (900 mL, pH 7.4) at 37°C was used as a
dis-solution medium. The rotation speed of the paddles was set at 100 rpm. At predetermined time intervals (5, 10, 20, 30, 45, and 60 minutes), 2 mL samples were withdrawn and filtered
through 0.22 µm filter membrane immediately.
Simultane-ously, equal blank medium was compensated immediately after withdrawal. The amount of dissolved BCN in the sample solution was assayed by HPLC.
Pharmacokinetic studies in vivo of BcN-sNs
Blood-sample preparation
Wister rats (body weight 280 ± 20 g) were supplied by
the Experimental Animal Center of Jiangxi University of
Traditional Chinese Medicine (Nanchang, People’s Republic of China). The experimental protocol was approved by the University Ethics Committee for the use of experimental
animals and conformed to the Guide for the Care and Use
of Laboratory Animals. All rats were divided randomly into two groups of six animals each. Rats were fasted for 12 hours prior to the study. BCN was administered to them by gavages (30 mg/kg of body weight) in the form of either BCN suspension (dispersed in 10% [w/w] TPGS and MCCS aqueous solution) or BCN-NS. Blood samples of approxi-mately 0.25 mL were collected by retroorbital puncture at predetermined intervals 0.25, 0.5, 0.75, 1, 1.5, 2, 3, 4, 6, 8, 10, and 24 hours. Plasma was obtained from whole blood in heparinized tubes by centrifugation at 3,000 rpm for 15
min-utes and frozen at -20°C until analysis.
To a 100 µL aliquot of plasma sample, 300 µL
metha-nol and 300 µL acetonitrile were added and vortexed for
3 minutes in a 2.0 mL polypropylene tube. The mixture was centrifuged at 12,000 rpm for 10 minutes, and then the supernatant was transferred to a clean tube and evaporated
to dryness under a nitrogen gas stream in a 37°C water bath.
The dried residue was then redissolved in 100 µL of mobile
phase and centrifuged at 12,000 rpm for 10 minutes, and the aliquot of the supernatant was injected into the HPLC system for analysis. The mobile phase was modulated to acetonitrile and 0.2% (v/v) aqueous phosphoric acid (47:53) at a flow rate of 1 mL/minute and a detection wavelength of 280 nm.
statistical analysis
The plasma concentration-versus-time profile was analyzed by statistical software (DAS 2.0; Boying, Beijing, People’s Republic of China). A noncompartmental model was chosen to calculate the main pharmacokinetic parameters. The results
were expressed as means ± standard deviation. Differences
in pharmacokinetic parameters among the three groups
were tested by one-way ANOVA. Values of P, 0.05 were
considered statistically significant.
Results and discussion
Box–Behnken design
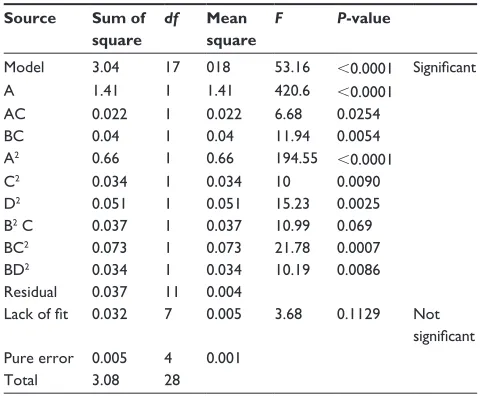
Table 2 shows the experimental conditions of the Box– Behnken design along with the corresponding values observed for the three response values. Experimental data were fitted to the cubic model by ANOVA. The ANOVA results for the three responses are shown in Tables 3–5. The results indicated that all the three models were significant at 95% confidence and the lack of fit was not significant. This
International Journal of Nanomedicine downloaded from https://www.dovepress.com/ by 118.70.13.36 on 23-Aug-2020
Dovepress
Yue et al
indicated that the fitted three models were adequate. The fitted models in terms of coded factors are demonstrated in
Equations (3)–(5). Coefficient of determination (R2) values
for particle size, span, and SI are 0.9880, 0.9972, and 0.9936,
respectively. The closer R2 is to 1, the better the empirical
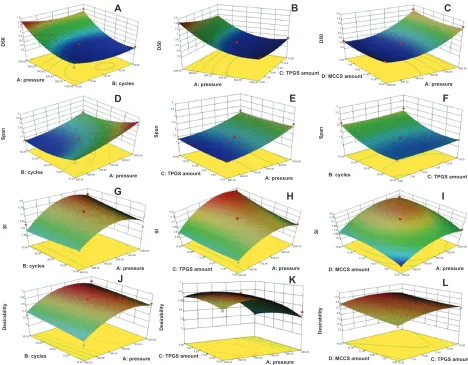
models fit the actual data. Figure 3 shows surface-response graphs obtained using the fitted model.
Y A B C AB
AC A B
1 0 59 0 42 0 16 0 084 0 0072
0 075 0 30 2 0 13 2
= − − − −
+ + +
+
. . . . .
. . .
00 055. C2+0 16. A B2 +0 063. AC2 (3)
Y A B C AB
AC A B
2 1 66 0 61 0 62 0 011 0 13
0 066 0 24 0 42
0
2 2
= + − + −
− + +
+
. . . . .
. . .
.0060C2+0 26. A B2 +0 10. AC2 (4)
Y A B C D
AB AC
3 0 74 0 066 0 0021 0 023 0 049
0 023 0 024 0 018
= + − + +
+ + −
. . . . .
. . . BBD A
B C D A B
AB
−
+ + − +
−
0 086
0 0039 0 016 0 051 0 037
0 029
2
2 2 2 2
2
.
. . . .
. (5)
The results corresponding to the three response values are discussed as follows.
The effect of process parameters
on the particle size of BcN-Ns
Figures 3A–C show the surface-response plot of the effect of process parameters on the particle size of BCN-NS. The surface-response plot of interaction homogenization
pressure × cycles (Figure 3A) shows that the particle size was
attained with homogenization pressure between 600 and 1000 bar. This increased as power increased from 600 to 800 bar. Homogenization cycles significantly affected particle size (Figure 3A). As can be seen from Figure 3A, the particle size
decreased from 1.454 µm to 0.503 µm as the homogenization
pressure and homogenization cycles increased. As can be seen from Figures 3B and C, the amount of TPGS affected particle size; particle size decreased with increasing TPGS amount. Figure 3B demonstrates that particle size decreased as the TPGS amount increased to 15%.
The effect of process parameters
on the span of BcN-Ns
Figures 3D–F show the surface-response plot of the effect of process parameters on the span of BCN-NS. Figure 3D
Table 3 analysis of variance for response surface quadratic model of Y1
Source Sum of
square
df Mean
square
F P-value
Model 3.04 17 018 53.16 ,0.0001 Significant
a 1.41 1 1.41 420.6 ,0.0001
ac 0.022 1 0.022 6.68 0.0254
Bc 0.04 1 0.04 11.94 0.0054
a2 0.66 1 0.66 194.55 ,0.0001
c2 0.034 1 0.034 10 0.0090
D2 0.051 1 0.051 15.23 0.0025
B2 c 0.037 1 0.037 10.99 0.069
Bc2 0.073 1 0.073 21.78 0.0007
BD2 0.034 1 0.034 10.19 0.0086
residual 0.037 11 0.004
Lack of fit 0.032 7 0.005 3.68 0.1129 Not
significant
Pure error 0.005 4 0.001
Total 3.08 28
Table 4 analysis of variance for response surface quadratic model of Y2
Source Sum of
square
df Mean
square
F P-value
Model 10.52 17 0.62 232.93 ,0.0001 Significant
a 2.99 1 2.99 1125.6 ,0.0001
B 3.11 1 3.11 1171.64 ,0.0001
aB 0.66 1 0.066 24.85 0.0004
ac 0.017 1 0.017 6.51 0.027
a2 0.69 1 0.69 261.44 ,0.0001
B2 1.47 1 1.47 553.80
ac2 0.028 1 0.028 10.39 0.0081
residual 0.029 11 0.003
Lack of fit 0.009 7 0.001 0.27 0.9362 Not
significant
Pure error 0.02 4 0.005
Total 10.55 28
Table 5 analysis of variance for response surface quadratic model of Y3
Source Sum of
square
df Mean
square
F P-value
Model 0.16 19 0.008 73.48 ,0.0001 Significant
a 0.016 1 0.016 144.74 ,0.0001
c 0.005 1 0.005 41.46 ,0.0001
D 0.02 1 0.02 181.65 ,0.0001
aB 0.002 1 0.002 18.03 0.0022
ac 0.002 1 0.002 20.09 0.0015
BD 0.001 1 0.001 11.22 0.0085
a2 0.048 1 0.048 431.29 ,0.0001
c2 0.002 1 0.002 14.94 0.0038
D2 0.017 1 0.017 151.94 ,0.0001
a2 B 0.004 1 0.004 32.72 0.0003
aB2 0.002 1 0.002 12.27 0.0067
residual 0.001 9 0.0001
Lack of fit 0.0008 5 0.0002 3.85 0.1081 Not
significant
Pure error 0.0002 4 0.00004
Total 0.16 28
International Journal of Nanomedicine downloaded from https://www.dovepress.com/ by 118.70.13.36 on 23-Aug-2020
Dovepress Process optimization and evaluation
indicates that homogenization pressure and cycle significantly affected the span of BCN-NS. The optimum homogenization pressure was between 600 and 800 bar, while the optimum cycles were located between 20 and 25 cycles. Homogeniza-tion pressure had a significant effect on the span of BCN-NS, and the minimized span was achieved at pressure 600 bar for 20 cycles (Figure 3D). As can be seen from Figures 3E and F, the TPGS amount as well as the MCCS amount did not significantly affect the span of BCN-NS.
The effect of process parameters
on the stability index of BcN-Ns
Figures 3G–I show the surface-response plot of the effect of process parameters on the SI of BCN-NS. Figure 3G shows that homogenization pressure more significantly affected the SI compared with homogenization cycles. The optimum homogenization pressure was located between 800 and 900 bar. As can be seen from Figure 3H, the SI was
not significantly affected by the TPGS amount. Meanwhile, Figure 3I indicates that MCCS significantly affected the SI. The SI increased as the MCCS amount increased to 15%.
Desirability optimization
The aim of optimization was to find good conditions that give the maximum SI and minimum particle size and span. The desirability-function approach was used to achieve this goal. Constraints for this optimization that were set in the software can be seen in Table 6. Figures 3J–L show the surface-response graphs of the desirability. The desirability was 0.77. The optimum values of homogenization pressure, cycles, TPGS amount, and MCCS amount were 850 bar, 25 cycles, 10%, and 10%, respectively.
Verification
In order to evaluate the optimization capability of the models of the Box–Behnken design, the BCN-NSs were
Spa n Spa n Spa n SI SI SI Desirabilit y Desirabilit y Desirabilit y D5 0 B: cycles B: cycles B: cycles B: cycles B: cycles A: pressure A: pressure A: pressure A: pressure A D G J D5
0 D50
C: TPGS amount
C: TPGS amount
C: TPGS amount
C: TPGS amount
D: MCCS amount
D: MCCS amount
D: MCCS amount A: pressure A: pressure A: pressure A: pressure A: pressure A: pressure
C: TPGS amount C: TPGS amount
B E H K C F I L 4 3.5 2.5 1.5 3 2 1 4 3.5 2.5 1.5 3 2 1 4 3.5 2.5 1.5 3 2 1 25.00 25.00 20.00 20.00 15.00 15.00 30.00 30.00 10.00 25.00 20.00 15.00 30.00 10.00 10.00 25.00 20.00 15.00 30.00 10.00 600.00 600.00 0.2 0.4 0.8 0.6 1 1.2 1.4 1.6 680.00 680.00 760.00 760.00 840.00 840.00 920.00 920.00 1000.00 600.00 680.00 760.00 840.00 920.00 1000.00 25.00 20.00 15.00 30.00 0 1 0.2 0.4 0.6 0.8 0 1 0.2 0.4 0.6 0.8 1 0.4 0.3 0.6 0.5 0.9 0.8 0.7 10.00 600.00 600.00 680.00 680.00 760.00 760.00 840.00 840.00 920.00 920.00 1000.00 1000.00 1000.00 13.00 13.00 13.00 11.00 11.00 11.00 5.00 5.00 5.00 7.00 7.00 7.00 9.00 5.00 7.00 9.00 11.00 13.00 15.00 9.00 9.00 15.00 15.00 13.00 11.00 5.00 7.00 9.00 15.00 13.00 11.00 5.00 7.00 9.00 15.00 13.00 11.00 5.00 5.00 7.00 7.00 9.00 9.00 11.00 13.00 15.00 15.00 0.55 0.65 0.75 0.6 0.7 0.8 0.55 0.65 0.75 0.6 0.7 0.8 15.00 600.00 600.00 0.2 0.2 0.4 0.4 0.8 0.8 0.6 0.6 1 1 1.2 1.2 1.4 1.4 1.6 1.6 680.00 680.00 760.00 760.00 840.00 840.00 920.00 920.00 1000.00 1000.00 600.00 680.00 760.00 13.00 11.00 5.00 7.00 9.00 15.00 0.55 0.65 0.75 0.6 0.5 0.7 0.8 600.00 680.00 760.00 840.00 920.00 1000.00 840.00 920.00 1000.00 840.00 760.00 680.00 600.00 920.00 1000.00
Figure 3 (A–L)Fitted surface for response values as a function of the pressure (a), homogenization cycles (B), TPgs amount (c), and Mccs amount (D). (A–C) Particle size (D50); (D–F) span; (G–I) stability index; (J–L) desirability.
Abbreviations: Mccs,microcrystalline cellulose and carboxymethyl cellulose sodium mixture; TPgs, d-α-tocopherol polyethylene glycol 1000 succinate; sI, stability index.
International Journal of Nanomedicine downloaded from https://www.dovepress.com/ by 118.70.13.36 on 23-Aug-2020
Dovepress
Yue et al
prepared according to the optimal process-variable settings, wherein A, B, C, and D were equal to 850 bar, 20 cycles, 10%, and 10%, respectively. The particle size, span, and SI of BCN-NS obtained by predicted models are shown in Table 7. The results indicated that there was good agreement on preparation properties with theoretical predictions.
Freeze-drying of BcN-Ns
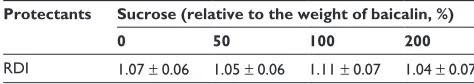
It is well known that protectants such as polysaccharides were usually used to protect NS from the impairments of freezing and desiccation. However, apart from polysaccharides, the stabilizers were effective enough to prevent damage during freeze-drying. The results (Table 8) showed that there was no significant difference in RDI of BCN-SNS after freeze-drying, compared with that of BCN-SNS with different concentrations of sucrose. BCN-SNS stabilized with TPGS and MCCS possessed good redispersibility after freeze-drying. These results indicated that TPGS and MCCS were prominent stabilizers for BCN-NS, and played an important role in protecting BCN-NS from irreversible agglomeration during freeze-drying.
Morphology of BcN-sNs
Unsuitable freeze-drying procedure of NS can induce desta-bilization of the particles, leading to irreversible aggregation.
Therefore, morphology evaluation of the redispersed BCN-NS is needed. In this study, the morphology of the freshly prepared BCN-NS and redispersed BCN-NS after lyophiliza-tion was evaluated by TEM (Figure 4). TEM images of freshly prepared BCN-NS (Figure 4A) and redispersed BCN-NS (Figure 4B) were similar. This experiment revealed that the particle size of the freeze-dried BCN-SNS was distributed homogeneously as single particles. The morphology of freeze-dried BCN-SNS was evaluated by SEM. As shown in Figure 5, the BCN-SNS stabilized by TPGS postlyophiliza-tion were flocculent in shape and formed slight aggregapostlyophiliza-tions (Figures 5A and B). However, no significant aggregation was observed in the redispersed BCN-NS. TPGS homogeneously adsorbed on the surface of the baicalin nanocrystals and effectively prevented possible polymer-chain entanglement during lyophilization. Therefore, a slight aggregation after lyophilization did not impair the redispersibility of BCN-SNS. This result also agreed well with particle-size values of redispersed NS from BCN-SNS determined by laser diffractometry (Figure 6). Therefore, the BCN-SNS after lyophilization possessed good redispersibility.
crystalline state analysis of BcN-sNs
Crystalline state is a very important factor, which can influ-ence the dissolution and stability behavior of a compound. High power density in the piston-gap homogenizer leads to high-energy input during the high-pressure homogenization
process.29,30 In some cases, this may induce changes in the
Table 7 Model-predicted and observed values of particle size, span and sI of BcN-lNs prepared according to the optimal experimental conditions (a = 850bar, B = 25, c = 10%, D = 10%) (n = 5)
Dependent variable Predicted Observed Bias*/%
Mean diameter (Y1) 477.2 nm 483.4 nm -1.29
span (Y2) 1.307 1.243 4.89
sI (Y3) 81.48% 80.56% 1.12
Notes: Bias* was calculated according to the equation: Bias/% = (predicted value– observed value)/predicted value × 100%.
Abbreviations: sI, stability index; BcN-lNs, baicalin liquid nanosuspension.
1µm
A B
1µm
Figure 4 Transmission electron microscopy images of (A) baicalin liquid nanosuspensions freshly prepared and (B) baicalin solid nanocrystals after lyophilization treatment.
Table 6 constraints of factors and responses for optimization
Name Goal Lower
limit
Upper limit
Importance
homogenization pressure (bar)
Is in a range 800 1000
homogenization cycles Is in a range 15 25 TPgs amount (%) Is in a range 10 15 Mccs amount (%) Is in a range 8 12
Mean diameter (nm) Minimize 5
span Minimize 3
stability index Maximize 4
Abbreviations: Mccs, microcrystalline cellulose and carboxymethyl cellulose sodium mixture; TPgs, d-α-tocopherol polyethylene glycol 1000 succinate.
Table 8 The rDI of BcN-sNs with different concentrations of sucrose after freeze-drying
Protectants Sucrose (relative to the weight of baicalin, %)
0 50 100 200
rDI 1.07 ± 0.06 1.05 ± 0.06 1.11 ± 0.07 1.04 ± 0.07
Abbreviations: rDI, redispersibility index; BcN-sNs, baicalin solid nanocrystals.
Note: Values are mean ± standard deviation.
International Journal of Nanomedicine downloaded from https://www.dovepress.com/ by 118.70.13.36 on 23-Aug-2020
Dovepress Process optimization and evaluation
crystalline state, increasing the amorphous fraction or even
creating completely amorphous particles.31 The extent of
such changes depends on the chemical and on the physical hardness of the active ingredient, as well as on the applied
power density.32 Therefore, before and following particle-size
reduction, DSC and XRD analyses were conducted to assess if the initial crystalline state was preserved.
Figure 7 shows the XRD pattern of BCN-SNS. The pow-der XRD study of BCN-SNS showed no significant shift in the main peaks, compared with coarse BCN. The
character-istic peak for BCN-SNS was observed at the same 2θ value
as that of coarse drug. A slight decrease in intensity of peaks was observed with BCN-SNS.
The results of thermal analysis by DSC are shown in Figure 8. The diagram reveals a similarity in melting points. As shown in the DSC thermograms, the melting temperatures of BCN (coarse BCN and BCN-SNS) were
similar. According to these results, neither the stabilizer nor the applied physical treatment affected the crystalline state of BCN.
From the DSC and XRD results (Figures 7 and 8), it was shown that BCN remained in a crystalline state that was physicochemically and thermodynamically more stable than BCN in an amorphous state.
solubility and dissolution-velocity studies
of BcN-sNs
NS could effectively enhance solubility for poorly water-soluble drugs. BCN-SNS possessed enhanced
solubil-ity (188.6 ± 0.33 µg/mL) compared with the solubility
(53.51 µg/mL) of coarse BCN. As shown in Figure 9,
dissolu-tion velocities of the freeze-dried BCN-SNS were distinctly superior compared to those of the crude powder and physical mixture. Within 60 minutes, approximately 80.87% of BCN
20
Particle size distribution
Particle size (µm) 15
Volume (%
)
10 5 0
20121217 - Average-2012
0.01 0.1 1 10 100 1000 3000
Figure 6 Particle-sizedistribution of redispersed baicalin solid nanocrystals (BcN-sNs).
WD HV
15.00 kV 4.5 mmspot4.0 100 000 xmsg TLDdet Nove Nano-SEM1 µm 15.00 kVHV 4.5 mmWD spot4.0 100 000 xmsg TLDdet None50
A B
Figure 5 scanningelectron microscopy images of baicalin solid nanocrystals after lyophilization (A 5,000×; B 10,000×).
International Journal of Nanomedicine downloaded from https://www.dovepress.com/ by 118.70.13.36 on 23-Aug-2020
Dovepress
Yue et al
2θ (°)
5 15 25 35 55
A
B
C
D 45
Figure 7 X-ray diffraction pattern of coarse baicalin (A), Mccs (microcrystalline cellulose and carboxymethyl cellulose sodium mixture) (B), the physical mixture (C) and baicalin solid nanocrystals (D).
−80.59
−60
−40
−20
Heat flow endo down (mW)
0
20
40
80 100 120 140
Temperature (°C)160 180 200 220 240 260 A
B
C
D
E
280 52.72
PeakX = 226.83°C
PeakX = 220.24°C PeakX = 217.94°C
Figure 8 Differential scanning calorimetry thermograms of Mccs (A), TPgs (B), coarse baicalin (C), the physical mixture (D), and baicalin solid nanocrystals (E).
Abbreviations: Mccs, microcrystalline cellulose and carboxymethyl cellulose sodium mixture; TPgs, d-α-tocopherol polyethylene glycol 1000 succinate.
90
80
70
60
50
40
30
20
10
100 80
60
Time (minutes)
Cumulative release (%
)
40 20
0
A B C
Figure 9 Dissolutionprofiles of baicalin coarse powder (A), physical mixture of baicalin (B), and freeze-dried baicalin solid nanocrystal powder (C).
International Journal of Nanomedicine downloaded from https://www.dovepress.com/ by 118.70.13.36 on 23-Aug-2020
Dovepress Process optimization and evaluation
was dissolved from the freeze-dried BCN-SNS. In contrast to this, only 41.15% and 43.37% was dissolved from the coarse BCN and physical mixture, respectively. We concluded that particle-size reduction led to enhanced dissolution velocity.
This could be explained by the Noyes–Whitney equation.33,34
As when drug particles are smaller, the corresponding surface area is larger, so the nanoparticles provided a large increase in the surface area. Furthermore, according to the Prandtl
equation,35 the diffusion distance, h, decreases for very small
particles. The increase of surface area and the simultaneous decrease of diffusion distance could lead to enhancement in dissolution velocity of the drug.
Pharmacokinetic study in rats of BcN-sNs
To confirm the advantage of NS in improving the bioavail-ability of BCN, an in vivo pharmacokinetic study of BCN-SNS was performed in rats. The plasma concentration–time curves of the BCN coarse suspension (CS) and BCN-SNS are displayed in Figure 10, and the pharmacokinetic parameters are shown in Table 9. After oral administration of these three different BCN formulas, their individual mean plasma concentration–time curve profile showed a biphasic absorption phenomenon. The first absorption peak presented at about 30 minutes, and then a second absorption peak occurred at about 6 hours. This might be explained by enterohepatic circulation of BCN, wherein BCN was hydro-lyzed to baicalein by intestinal bacteria and then restored to
its original form from the absorbed baicalein in the body,
resulting in the second absorption peak.36,37
The results showed that coarse BCN and NS were different from each other in the corresponding parameters. Compared with the BCN-CS, the BCN-SNS had higher
maximum concentration (Cmax; 5.808 ± 0.785 mg/L),
higher area under the curve, 0 to time t (AUC0–t;
73.384 ± 8.1847 mg/L ⋅ hour), and shorter mean residence
time (10.758 ± 1.348 hours), which indicated BCN-NS was
easier to be absorbed in vivo.
BCN-NS was absorbed easily, which induced an
increase in AUC0–t and Cmax and decreased mean residence
time. These phenomena were probably caused by the absorption pattern of BCN. Greater exposure of the drug
Table 9 Main pharmacokinetic parameters of baicalin coarse suspension (BcN-cs) and BcN nanosuspension (BcN-Ns) redispersed by BcN solid nanocrystals (BcN-sNs) after oral administration in rats (n = 6, mean ± standard deviation)
Unit BCN BCN-PM BCN-SNS
MrT(0–∝) hours 8.271 ± 0.237 7.85 ± 0.508 6.758 ± 1.348*
Tmax hours 7.6 ± 0.894 6.8 ± 1.789 7.2 ± 1.095 cmax mg/l-1 3.827 ± 0.489 4.212 ± 0.805 5.808 ± 0.785* t½ hours 5.26 ± 4.361 3.223 ± 0.864 6.795 ± 4.572 aUc0–24 mg/
(l ⋅ hour)
43.604 ± 4.394 40.421 ± 10.156 73.384 ± 8.184**
Notes: *P , 0.05, **P , 0.01, versus control group.
Abbreviations: MrT, mean residence time; Tmax, time to maximum concentration;
cmax, maximum concentration; t½, half-life; aUc, area under the curve.
8
7
6
5
4
3
2
1
0
25 20
15 Time (hours)
Drug concentration in blood
(
µ
g/mL)
10 5
0
A B C
Figure 10 Meanplasma concentration–time curve of (A) baicalin coarse suspension, (B) baicalin physical mixture, and (C) baicalin solid nanocrystals after oral administration (n = 6).
International Journal of Nanomedicine downloaded from https://www.dovepress.com/ by 118.70.13.36 on 23-Aug-2020
Dovepress
Yue et al
function group would assist uptake of the drug. Therefore, particle size has been recognized as a crucial parameter for bioadhesion and absorption from gastrointestinal tis-sue.38,39 The results showed that drug NS had the higher
dis-solution rate compared with the coarse drug. Because drug NS had a greater surface area compared with the coarse particles drug under equivalent conditions, they dissolved easily into intestinal fluid, and smaller particles showed a higher extent of uptake than larger ones via both
follicle-associated epithelia and absorptive enterocytes.40
Conclusion
Process optimization of NS prepared by high-pressure homogenization was a complex process, since it involved a large number of factors that could affect the characteristics of NS. The Box–Behnken design was applied successfully to optimize formulation and process parameters for NS. From this study, it was concluded that homogenization pressure, homogenization cycles, amount of TPGS to drug, and amount of MCCS to drug played a significant role in control-ling the particle size, span, and SI of NS. Homogenization pressure and homogenization cycles were considered to be significant factors that affected particle-size D50 and span of NS. The graphical optimization method helped in finding the “sweet spot” or design space to get NS with the desired physicochemical properties. This study also helped in identifying certain formulation and processing parameters, such as high polymer concentration and high homogeniza-tion pressure, which may affect the manufacturing of NS on a larger scale. The SI of the NS was found to be more dependent on polymer concentration compared to surfactant concentration.
The fabricated BCN-NS by optimization presented a sphere-like shape under TEM. SEM results demonstrated that no significant aggregation or crystal growth was observed in the redispersed BCN-SNS. By reducing BCN particle size into the nanometer range, its dissolution rate and oral bioavailability exhibited greater enhancement compared with coarse BCN. Through this study, it has been demonstrated that SNS might be a good choice for oral administration of poorly soluble BCN.
Acknowledgments
The authors would like to acknowledge the support from the National Natural Science Foundation of China (81102821), the Natural Science Foundation of Jiangxi Province (20122BAB215038), and the Scientific Research Foundation of Jiangxi Education Bureau (GJJ13607).
Disclosure
The authors report no conflicts of interest in this work.
References
1. Xing J, Chen X, Zhong D. Absorption and enterohepatic circulation of
baicalin in rats. Life Sci. 2005;78(2):140–146.
2. Shen YC, Chiou WF, Chou YC, Chen, CF. Mechanisms in mediating the anti-inflammatory effects of baicalin and baicalein in human leukocytes.
Eur J Pharmacol. 2003;465(1–2):171–181.
3. Tsai PL, Tsai TH. Pharmacokinetics of baicalin in rats and its interac-tions with cyclosporin A, quinidine and SKF-525 A: a microdialysis
study. Planta Med. 2004;70(11):1069–1074.
4. Liversidge GG, Cundy KC. Particle size reduction for improvement of oral bioavailability of hydrophobic drugs: I. Absolute oral bioavailability of
nanocrystalline danazol in beagle dogs. Int J Pharm. 1995;125(1): 91–97.
5. Liversidge EM, Liversidge GG, Cooper ER. Nanosizing: a
formula-tion approach for poorly-water-soluble compounds. Eur J Pharm Sci.
2003;18(2):113–120.
6. Muller RH, Jacobs C, Kayser O. Nanosuspensions as particulate drug formulations in therapy: rationale for development and what we can
expect for the future. Adv Drug Deliv Rev. 2001;47(1):3–19.
7. Liu ZD, Zhang XH, Wu HY, et al. Preparation and evaluation of solid lipid nanoparticles of BCN for ocular drug delivery system in vitro and
in vivo. Drug Dev Ind Pharm. 2011;37(4):475–481.
8. Chen YJ, Jia Y, Jin RX, et al. Preparation of BCN flexible
nano-liposomes. Chin J Exp Tradit Med Formula. 2011;17:1–4.
9. Wang C, Zhao XM, Hao JF, Lin J. The process on new technology and
novel dosage form to improve the bioavailability of BCN. Chin Tradit
Pat Med. 2012;34(3):545–549.
10. Keck CM, Müller RH. Drug nanocrystals of poorly soluble drugs
produced by high pressure homogenization. Eur Pharm Biopharm.
2006;62(1):3–16.
11. Gao L, Zhang D, Chen M. Drug nanocrystals for the formulation of poorly soluble drugs and its application as a potential drug delivery
system. J Nanopart Res. 2008;10(5):845–862.
12. Van Eerdenbrugh B, Vercruysse S, Martens Johan A, et al. Microcrystalline cellulose, a useful alternative for sucrose as a matrix former during freeze-drying of drug nanosuspensions – a case study
with itraconazole. Eur J Pharm Biopharm. 2008;70(2):590–596.
13. Yue PF, Wang Y, Wan J, et al. [The research progress of preparation
methods of solid nanocrystal delivery system.] Yao Xue Xue Bao.
2012;47(9):1120–1127. Chinese.
14. Li XS, Wang JX, Shen ZG, Zhang PY, Chen JF, Yun J. Preparation of uniform prednisolone microcrystals by a controlled microprecipitation
method. Int J Pharm. 2007;342(1–2):26–32.
15. Rabinow BE. Nanosuspension in drug delivery. Nat Rev Drug Discov.
2004;3(9):785–796.
16. Van Eerdenbrugh B, Van den Mooter G, Augustijns P. Top-down production of drug nanocrystals: nanosuspension stabilization,
miniaturization and transformation into solid products. Int J Pharm.
2008;364(1): 64–75.
17. Patravale VB, Date AA, Kulkarni RM. Nanosuspension: a promising
drug delivery strategy. J Pharm Pharmacol. 2004;56(7):827–840.
18. Singare DS, Marella S, Gowthamrajan K, Kulkarni GT, Vooturi R, Rao PS. Optimization of formulation and process variable of
nanosuspen-sion: an industrial perspective. Int J Pharm. 2010;402(1–2):213–220.
19. El-Malah Y, Nazzal S, Khanfar NM. D-optimal mixture design: optimiza-tion of ternary matrix blends for controlled zero-order drug release from
oral dosage forms. Drug Dev Ind Pharm. 2006;32(10):1207–1218.
20. Yue PF, Yuan HL, Li XY, Yang M, Zhu WF. Process optimization, characterization and evaluation in vivo of oxymatrine-phospholipid
complex. Int J Pharm. 2010;387(1–2):139–146.
21. Yue PF, Zheng Q, Wu B, et al. Process optimization by response surface
design and characterization study on geniposide pharmacosomes. Pharm
Dev Technol. 2012;17(1):94–102.
International Journal of Nanomedicine downloaded from https://www.dovepress.com/ by 118.70.13.36 on 23-Aug-2020
International Journal of Nanomedicine
Publish your work in this journal
Submit your manuscript here: http://www.dovepress.com/international-journal-of-nanomedicine-journal The International Journal of Nanomedicine is an international,
peer-reviewed journal focusing on the application of nanotechnology in diagnostics, therapeutics, and drug delivery systems throughout the biomedical field. This journal is indexed on PubMed Central, MedLine, CAS, SciSearch®, Current Contents®/Clinical Medicine,
Journal Citation Reports/Science Edition, EMBase, Scopus and the Elsevier Bibliographic databases. The manuscript management system is completely online and includes a very quick and fair peer-review system, which is all easy to use. Visit http://www.dovepress.com/ testimonials.php to read real quotes from published authors.
Dovepress
Dove
press
Process optimization and evaluation
22. Yue PF, Yuan HL, Li XY, Yang M, Zhu WF, Xiao XH. Development and optimization of intravenous puerarin emulsions formation by a
novel complex-phase inversion-homogenization technology. Chem
Pharm Bull. 2007;55(11):1563–1568.
23. Müller RH, Gohla S, Keck CM. State of the art of nanocrystals – special features, production, nanotoxicology aspects and intracellular delivery.
Eur J Pharm Biopharm. 2011;78(1):1–9.
24. Yue PF, Zheng Q, Liao MX, Zhang ZZ, Zhu WF. Process optimization, characterization, and release study in vitro of an intravenous puerarin
lipid micropheres loaded with the phospholipid complex. J Dispers Sci
Technol. 2010;32(1):1–7.
25. Liao ZG, Wang GF, Liang XL, Zhao GW, Jiang QY. Optimiza-tion of microwave-assisted extracOptimiza-tion of active components from
Yuanhu Zhitong prescription. Sep Purif Technol. 2008;63(2):
424–433.
26. Zheng SH, Deng YH. Application of dynamic light scattering on the evaluation of the particles size and distribution of submicroemulsion
for injection. Chin J Pharm. 2005;3(3):126–131.
27. Gao L, Zhang DR, Chen MH, Zheng TT, Wang SM. Preparation and characterization of an oridonin nanosuspension for solubility and
dis-solution velocity enhancement. Drug Dev Ind Pharm. 2007;33(12):
1332–1339.
28. Mauludin R, Müller RH, Keck CM. Kinetic solubility and dissolution
velocity of rutin nanocrystals. Eur J Pharm Biopharm. 2009;36(4–5):
502–510.
29. Möschwitzer J, Müller RH. Spray coated pellets as carrier system for
mucoadhesive drug nanocrystals. Eur J Pharm Biopharm. 2006;62(3):
282–287.
30. Wang Y, Liu Z, Zhang D, et al. Development and in vitro evaluation
of deacety mycoepoxydiene nanosuspension. Colloids Surf B
Biointerfaces. 2011;83(2):189–197.
31. Kocbek P, Baumgartner S, Kristl J. Preparation and evaluation of
nano-suspensions for enhancing the dissolution of poorly soluble drugs. Int
J Pharm. 2006;312(1–2):179–186.
32. Mauludin R, Müller RH, Keck CM. Development of an oral rutin
nanocrystal formulation. Int J Pharm. 2009;370(1–2):202–209.
33. Xia DN, Cui FD, Piao HZ, et al. Effect of crystal size on the in vitro
dissolution and oral absorption of nitrendipine in rats. Pharm Res.
2010;27(9):1965–1976.
34. Junghanns JU, Müller RH. Nanocrystal technology, drug delivery and
clinical applications. Int J Nanomedicine. 2008;3(3):295–309.
35. Pu X, Sun J, Wang Y, et al. Development of a chemically
sta-ble 10- hydroxycamptothecin nanosuspensions. Int J Pharm.
2009;379(1): 167–173.
36. Akao T, Kawabata K, Yanagisawa E, et al. Balicalin, the predominant flavone glucuronide of Scutellariae radix, is absorbed from the rat gastrointestinal tract as the aglycone and restored to its original form.
J Pharm Pharmacol. 2000;52(12):1563–1568.
37. Hao J, Wang F, Wang X, et al. Development and optimization of baicalin-loaded solid lipid nanoparticles prepared by coacervation method using
central composite design. Eur J Pharm Sci. 2012;47(2):497–505.
38. Jung T, Kamm W, Breitenbach A, Kaiserling E, Xiao JX, Kissel T. Biodegradable nanoparticles for oral delivery of peptides: is there a
role for polymers to affect mucosal uptake? Eur J Pharm Biopharm.
2000;50(1):147–160.
39. Guo JJ, Yue PF, Lv JL, et al. Development and in vivo/in vitro
evalua-tion of novel herpetrione nanosuspension. Int J Pharm. 2013;441(1–2):
227–233.
40. Jani P, Halbert GW, Langridge J, Florence AT. Nanoparticle uptake by the rat gastrointestinal mucosa: quantitation and particle size dependency.
J Pharm Pharmacol. 1990;42(12):821–826.
International Journal of Nanomedicine downloaded from https://www.dovepress.com/ by 118.70.13.36 on 23-Aug-2020