Experimental and
Computational
Studies of Bismuth
Molybdates
Lee Martin Reilly
Supervisor: Professor C. Richard A. Catlow
University of London
(University College London, and the Royal
Institution of Great Britain)
ProQ uest Number: U 641828
All rights reserved
INFORMATION TO ALL U SE R S
The quality of this reproduction is d ep en d en t upon the quality of the copy subm itted.
In the unlikely even t that the author did not sen d a com plete manuscript
and there are m issing p a g e s, th e se will be noted. Also, if material had to be rem oved, a note will indicate the deletion.
uest.
ProQ uest U 641828
Published by ProQ uest LLC(2015). Copyright of the Dissertation is held by the Author.
All rights reserved.
This work is protected against unauthorized copying under Title 17, United S ta tes C ode. Microform Edition © ProQ uest LLC.
ProQ uest LLC
789 East E isenhow er Parkway P.O. Box 1346
Table of Contents
Abstract 14
Acknowledgements 15
Chapter 1 An Introduction to Bismuth Molybdates
1 .1 An Overview of Catalysis 17
1 . 2 Applications of Bismuth Molybdates 19
1.3 What are Bismuth Molybdates 2 0
1.3.1 a Phase 2 0
1.3.2 P Phase 2 2
1.3.3 y Phase 23
1.4 Phase Transformations 25
1.5 Other Bismuth Molybdate Phases 27
1 .6 Catalytic Activity 28
1.7 Reaction Mechanism 30
1 . 8 Redox Behaviour 31
1.9 Aims of This Thesis 33
1 . 1 0 References 34
Chapter 2 Experimental Methods
2 .1 Summary 36
2 . 2 Sample Preparation 36
2.3 Thermal Methods 38
2.4 Synchrotron Radiation 40
2.5 X-ray Diffraction 41
2 . 6 X-ray Absorption Spectroscopy 43
2.6 .1 Theory of the X-ray Absorption Process 43
2.6 . 2 XANES 45
2.6.4 Data Collection 49
2.6.5 EXAFS Data Analysis 52
2.6.5.1 Data normalisation (EXCALIB) 52
2.6.5.2 Background subtraction (EXBROOK) 52
2.6.5.3 Curve Fitting structural parameters 55
2.7 Combined XAS/XRD 55
2 . 8 References 60
Chapter 3 Phase formation of Bismuth Molybdates
3.1 Introduction
3.2 Experimental 62
3.2.1 Sample Preparation 62
3.2.2 Thermal Measurements 63
3.2.3 IR Studies 6 8
3.2.4.1 Y B i2Mo0 6 formed from the gel in Air (Mo edge) 70
3.2.4.2 Y B i2Mo0 6 formed from the gel in Nitrogen 83
3.2.4.3 Y B i2MoOô formed from the gel in Air (Bi edge) 8 8
3.2.5 Y B i2MoOô formed by the Solid State Method 94
3.3 Discussion 105
3.4 Conclusion 106
3.5 References 108
Chapter 4 Phase transformations in the BizOg.MoOs System
4.1 Introduction 109
4.2 Experimental 109
4.2.1 Sample Preparation 1 1 0
4.2.2 Ex-situ Studies 1 1 0
4.2.2.1 X-ray diffraction 1 1 0
4.2.2.2 X-ray Absorption Spectroscopy 114
4.2.3 In-situ Studies 118
4.2.3.1 Differential Scanning Calorimetry 118
4.2.3.2 Conductivity 1 2 0
4.2.3.3 Combined XAS/XRD 1 2 2
4.2.3.3.1 Data collected in Air 1 2 2
4.2.3.3.2 Data collected in Nitrogen 129
4.3 Discussion 133
4.4 Conclusion 135
4.5 References 136
Chapter 5 Computational Modelling
5.1 Introduction 137
5.2 Interatomic Potential Based Methods 138
5.2.1 Born Model 138
5.2.2 Shell Model 139
5.2.3 Short Range Potentials 140
5.2.4 Defects 141
5.3 Calculations 143
5.4 Results 145
5.4.1 Intrinsic Defects 145
5.4.2 Extrinsic Defects 149
5.4.2.1 Charge Compensation Mechanisms 150
5.4.2.2 Solution Energies 152
5.5 Discussion and Conclusion 156
Appendix A Structural changes due to Catalytic Activity in the y
Bi
2Mo
0 6phase
A .l Introduction 160
A.2 Experimental 161
A.2.1 Sample Preparation 161
A.2.2 Phase Formation in a non-Oxidising Atmosphere 162
A.2.3 Electron Yield Studies 163
A.2.4 In-situ studies in Propene 166
A.3 Discussion 172
A.4 Conclusion 173
A.5 References 174
Appendix B Computational Data
List of Figures
Chapter 1.
Figure Caption Page
1.1 A Dobereiner’s fire lighter, given to Michael Faraday by 18
Dobereiner. This was the first commercial use o f a catalyst.
These lighters where popular up until the First World War
1.2 The a B i2MosO]2 phase, Mo polyhedra are shown in green, Bi are 21
purple.
1.3 The p Bi2Mo2 0cj phase. Mo is tetrahedrally co-ordinated (shown 22
in green).
1.4 The y B i2M o0 6 structure contains layers o f distorted Mo 24
octahedra, sandwiched between layers o f Bi2 0 2^^, in a classic
Aurvillius structure
1.5 y Bi2MoOô, Mo is tetrahedrally co-ordinated (shown in green), in 26
a defect fluorite structure.
1.6 Restructuring o f molybdenum octahedra into shears (taken from 33
Grasselli et-al, 1981).
Chapter 2
2.1 An idealised TGA plot, weight loss is plotted against temperature 39
or time.
2.2 A schematic, XAS spectra, illustrating the different parts into 44
which the spectra can be divided.
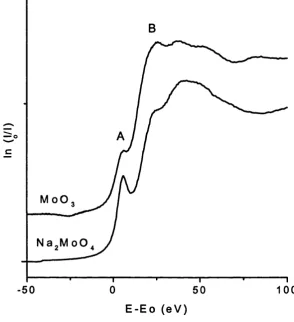
2.3 A typical Mo XANES spectra, feature A is due to the promotion o f 46
an electron from the Is to 4d band. Feature B is due to the
promotion o f an electron from the Is to 5p level. This model
compound, Na2M o0 4, is tetrahedrally co-ordinated.
2.4 An X-ray is absorbed by an ion, a photoelectron is ejected which is 47
then back scattered by surrounding ions. This gives rise to
absorption o f XAS spectra.
2.5 Schematic representation o f the experimental arrangement fo r 50
transmission mode XAS.
2.6 Schematic representation o f the arrangement fo r fluorescence 51
mode XAS.
2.7 Schematic representation, o f the arrangement fo r XAS electron 51
yield collection.
2.8 The effect o f subtracting the mass absorption from the spectrum. 53
The polynomial dashed line in (a) is subtracted from the raw data
to give the absorption per absorbing atom depicted in (b).
2.9 EXAFS data which has been normalised and had the mass 54
absorption subtracted, the dotted line represents the background
absorption above the edge. This line bisects the mid-point o f the
oscillations.
2.10 A schematic illustration o f the combined XAS/XRD instrumental 58
arrangement on station 9.3 at the Daresbury Laboratory.
Chapter 3
3.1 TGA o f Y precursor being heated in air, two separate weight losses 64
are noted at ca. 60 (-1.40 %) and 260 "C (-51.96 %).
3.2 DSC o f y precursor heated in air, fo u r peaks are evident at 57 ^'C, 65
/ 3 7 T , 777 T ,
3.3 TGA o f y precursor heated in flow ing nitrogen. Two weight losses 66
are visible, firstly at ca. 60 "C when 1.1 0% is lost, and second at
258 ^’C when 50% weight is lost
3.4 DSC o f y precursor heated in flow ing nitrogen and oxygen. Four 67
peaks are again visible at 57 ^'C, 131 ^’C, 171 "C, and 259 ‘'C.
3.5 FTIR spectra o f the Bi2MoOô precursor material recorded in the 69
diffuse reflectance mode at room temperature, lOC’C and 30(f'C.
3.6 Selected XRD patterns recorded at 5(fC , 3 0 0 ’C, 400”C and 5 3 0 ’C 71
are shown here to highlight the formation o f the crystalline
3.7 (a) Ex-situ scans o f the
y
precursor being heated to 560" C, 72confirming the in-situ observations. (b)X R D patterns (all
converted to 1=0.6272
A)
o f simulated patterns fo r thea,
andy
phases, the in-situ sample at 560"C (I) and the sample prepared in
the Lab (L)
3.8 Mo K-edge XANES plots o f the two model compounds, M0O3 and 74
Na2M o0 4. These two materials represent typical distorted
octahedral and tetrahedral co-ordination systems around
molybdenum respectively
3.9 (a) Stacked Mo K-edge XANES {obtained after normalisation) plot 76
recorded during the heat treatment o f the Bi2M o0 6 precursor in
air. (b) Graph showing the variation in the intensity o f the
features marked A and B in Fig 3.8 as a function o f temperature.
3.10 (a) Stacked plot showing Fourier transform magnitude o f the Mo 78
K-edge EXAFS data recorded during the course o f heating the
Bi2MoOe precursor in air.(b) Variation in the Debye-Waller factor
o f the M o- 0 shells at ca. 1.78
A
and 2 .2A,
as a function o ftemperature.
3.11 Typical best fi t to the EXAFS data o f the starting material (at 80
65"C) and the final product (at 530"C), respectively. The solid
line shows the experimental data and the dashed curve represents
the best f i t using the model described in Table 3.2.
3.12 Contribution o f first and second shells to the fi t o f Mo K-edge 83
EXAFS data fo r the y phase. The experimental data is the
unbroken line, the first shell is a dotted line and the second shell is
a dot-dash line.
3.14 Selected XRD patterns fo r the y B i2M o0 6 precursor heated in 84
nitrogen at 48"C, 30(f*C, 450"C and 56ŒC.
3.15 (a) A stack plot showing the Mo K-edge XANES fo r the y B i2MoOô 85
phase precursor material. It shows how the edge features vary
with temperature, (b) A plot o f the intensities o f peaks A and B
illustrating how they vary with temperature.
factors with temperature fo r the yBizMoOo precursor heated in
nitrogen.
3.17 Selected XRD patterns at 65‘*C 58Ù‘C, in comparison to the 89
simulated pattern..
3.18 Stacked XANES plots fo r the Bi Ls edge, as the jBizM oOô 90
precursor is heated in air, there are no obvious changes occurring
to the pre-edge as the fin a l phase is formed.
3.19 Fourier transform o f the simulated and data at 580'’C. Large 93
differences can be seen between the two spectra (experimental
data is in red, the simulated is blue).
3.20 A comparison o f the simulated and experimental (collected at 94
580'’C) Fourier transforms fo r the Bi Lj-edge (collected at 580'’C).
The model is only out to 3 Â.
3.21 Three powder XRD patterns, the first o f Bi20s and M oO j in a 1:1 95
ratio before firing. The second pattern is o f the sample after 2
days at 500'’C and the third o f the sample after 11 days at 500'’C.
3.22 Stack plot o f Mo K-edge X A N F Sfor samples that have been heat- 96
treated fo r different lengths o f time during the solid state
preparation o f yB i2M o0 6.
3.23 Stack plot o f Bi Lj-edge X A N F Sfor samples that have been heat 97
treated fo r different lengths o f time during the solid state
preparation o f yB i2M o0 6
3.24 FXAFS spectra and Fourier Transforms fo r Mo K-edge after the 98
solid state sample has been heated at 500'’C fo r 2, 4, 6, and 8 days
respectively.
3.25 Comparison between Fourier transforms o f the solid state sample 100
after eight days (red), simulated data (blue), and a pattern
collected in-situ o f the material form ed from a precursor
gel( green).
3.26 Plots fo r the Bi Lj-edge comparing the models (blue) with the 102
experimental data (red) with both the FXAFS and Fourier
Chapter 4.
4.1 Experimental powder XRD patterns fo r the7Bl2M o0 6 and Y H I
Bi2M o0 6 phases (labelled L) and simulated patterns (labelled S).
4.2 Mo K-edge XANES plots fo r both the y and 7' phases o f Bi2M o0 6- 112
4.3 Mo K-edge EXAFS and F T patterns fo r the 7 and Y phases o f 113
Bi2MoOô (the experimental data is in red, the model in blue).
4.4 Bi Ls-edge XANES fo r the
y
and / polymorphs. Little difference is 114observable.
4.5 Bi Ls-edge EXAFS data and Fourier transforms, o f the 7 and 115
Y Bi2MoO6 polymorphs (the experimental data is in red, the
model is in blue).
4.6 A comparison o f the Fourier transforms fo r the simulated (Red) 117
and observed EXAFS data (blue) o f the Y Bi2M o0 6 phase.
4.7 DSC scan o f the y B i2M o0 6 phase being heated in air, oxygen and 118
nitrogen, from 550*C to 70CC. Note two exothermic features at
4.8 DSC scan o f y Bi2MoO6 being heated from 550“C to 640“C and 119
then being cooled. Note the exothermic peak at 608“C on the
heating ramp and the endothermie feature on the cooling ramp at
4 .9 A plot o f the conductivity o f the sample pellet as it is heated from 120
room temperature to 700“C.
4.10 (a) A stack plot o f the XANES data fo r the y Bi2MoO6 sample 122
heated in air from room temperature to 700“ C. (b) A graph o f how
the intensities o f the edge features A and B vary with temperature.
4.11 XRD scans o f the sample at 50“C and 580“C (after 240 mins). 123
4.12 (a) A stack plot o f the XANES patterns fo r the sample held at 124
580“C fo r 240 minutes, (b) The variation in intensties o f the
features, A and B as a function o f time.
4.13 (a) A stack plot fo r the XRD data collected between 580“C and 126
700“C. (b) Powder patterns o f the sample at 580“C and 700“C.
4.15 a) A stack plot o f the XRD patterns collected between 560‘’C and 130
7 j y C fo r the Bi20 3.Mo0 3 system heated in nitrogen, (b) XRD
patterns fo r the BÎ2 0 3.Mo0 3 system at 5 6 0 'C, 635" C, and 715"C.
4.16 (a) A stack plot o f the Mo K-edge XANES data collected between 131
560"C and 715"C. (b) A and B values plotted as a function o f
temperature.
Chapter 5.
5.1 The shell model, a core with charge X is surrounded by a massless 140
shell with charge Y. The two are joined by a harmonic spring with
force constant k.
5.2 The Mott-Littleton method divides the lattice into three regions, an 142
inner one (I) where the ions are relaxed explicitly, a middle
interface region (II a) and an outer region (II b) which is treated
as a quasi-dielectric continuum.
5.3 Dopant energies as a function o f ionic radius, note the ionic 155
radius fo r B i ^ is 0.96
A.
Appendix A.
A .l Powder XRD patterns fo r the green material, y sample form ed in 163
Ar, in comparison to a sample form ed in air. No noticeable
differences between the samples can be observed.
A.2 XANES spectra fo r the sample both fo r the (a) Bi L3-edge and (b) 165
Mo K-edge. It can be seen there is no obvious change in the Bi L 3
-edge pattern, or to the fine features o f the Mo K--edge spectra
either
A 3 Powder XRD patterns before and heating 60"C and at 400"C. 166
A 4 (a) A stack plot o f the Mo K-edge XANES spectra collected during 168
the reduction o f the y B i2MoOô phase, (b) A plot o f the variation
in intensities o f edge features A and B, as a function o f
A.5 Experimental (red) and modelled EXAFS data and Fourier 171
transforms fo r the data collected at (a) 3 7 'C and (b) 40(fC . Note
List of Tables
Chapter 1.
Table Caption Page
1.1 Thermodynamics o f Oxidation reactions [from Stull et-al 29
(1969)].
1.2 Mechanisms fo r Propylene ammoxidation in the literature 32
(published by Arora et-al, 1996).
Chapter 3.
3.1 Temperatures and changes fo r each peak o f the fo u r peaks 6 8
shown in the DSC scans’. <
3.2 Structural parameters derived from the Mo K-edge EXAFS 80
data recorded at 6S ’C and 530"C temperatures
3.3 Summary o f the fitted data fo r each EXAFS pattern recorded 81
between 6T C and 530"C. f* means that the data was not o f
sufficient quality to analyse).
3.4 Comparsion o f model parameters fo r the same sample at 87
45(f^C, in one model the radius o f the second shell was refined
in the others held constant at 2.28
A
and 2.30A
respectively3.5 Model parameters fo r each Mo K-edge spectrum collected, fo r 87
the 7 BizMoOc) precursor material being heated to 56(f^C
under flow ing nitrogen.
3.7 Model parameters fo r Bi Ls-edge EXAFS data fo r the in-situ 90
phase formation experiment, all the shells contain oxygen ions
3.8 Parameters used to fi t models to data fo r Mo K-edge data fo r 99
the solid state sample after being heated fo r 2,4, 6 and 8 days
respectively
State p rep a ra tio n method.
Chapter 4.
4.1 Table o f parameters used to f it data to the 7 and Y 113
polymorphs o f Bi2MoOô.
4.2 Parameters used to model Bi Ls-edge EXAFS data fo r the 7 116
and Y BizMoOf, polymorphs.
4.3 Parameters used to model Bi Ls-edge data from 580‘*C to 127
683^’C, all the shells contain oxygen ions.
Chapter 5.
5.1 Parameters fo r the Buckingham potentials used fo r these 144
calculations, which were derived by Cherry ( 1995).
5.2 Parameters fo r the shell models used, derived by Cherry. 144
5.3 Calculated and experimental lattice parameters fo r the ft 144
B12M02O9 phase, taken from Cherry (1995).
5.4 Vacancy energies fo r b Bi2M o2 0g phase, the lattice site the 145
energy was calculated fo r is in brackets.
5.5 Energies calculated fo r interstitial defects in p Bi2Mo2 0g 145
phase.
5.6 Schottky energies fo r
p
BZ2M02O9, lattice energies have been 146calculated using Cherry’s potentials (Cherry 1995).
5.7 Frenkel energies fo r p Bi2Mo2 0 9 146
5.8 Redox processes in Bi2Mo2 0g. 147
5.9 Redox energies fo r the p phase. The value used fo r electron 149
formation is -9 .45 eV.
A p p e n d ix A.
A .l A table listing the parameters used to model the EXAFS data 169
collected fo r the Mo K-edge during the reduction o f the y
Bi2MoOé phase in propene. Both the first and second shells
contain oxygen ions in all the models presented
A.2 A comparison between EXAFS models containing 4, 5 and 6 172
oxygens respectively, fo r the first and last spectra recorded
Appendix B
B .l Co-ordinates fo r the ion cores used in modelling Bi2Mo2 0g. 175
B.2 Defect Energies fo r Bi sites. 176
B.3 Defect energies fo r Mo Sites. 176
B.4 Defect energies fo r oxygen sites: 177
B.5 Lattice energies calculated fo r other bismuth and 177
molybdenum phases using Cherry's (1995) potentials.
B.6 Interatomic potentials fo r Bi2M o2 0g derived by Bush (1995) 178
using the shifted electron-gas cloud method, used in this thesis
fo r calculating redox energies.
i) Short Range
Abstract
The work described in this thesis has two main strands. The first concerns the
characterisation of the phase formation and transformation of the Bi2 0 3.Mo0 3
system. The second strand involves an investigation of the behaviour of the p
Bi2M o2 0 9 phase, using Interatomic Potential Modelling methods.
The experimental work has utilised a large number of techniques such as
Thermal Gravimetric Analysis, Infra Red Spectroscopy, and Combined
XAS/XRD to study the phase changes. All of these methods used in conjunction
bring a powerful insight into the physical processes that occur when a phase is
formed from a precursor or transforms into a new structure.
In the formation of y Bi2Mo0 6 (which has an Aurvillius structure), from a co
precipitate it is shown that the Bi2 0 2^^ sheets form at 300"C, but the Mo only becomes octahedrally co-ordinated at 400°C. This observation is only possible
with the use of in-situ Combined XAS/XRD, which probes both local and long
range order in a system.
The two-reported phase transformations are identified as occurring at ca. 608°C
and ca. 670°C. The temperature that they occur at is independent of the
atmosphere. The first phase change is not characterised by any obvious change
in co-ordination around either the Mo or Bi ions. The second phase change is
characterised by a change from octahedral to tetrahedral co-ordination around the
Mo ion.
Computational Redox and Dopant studies are presented for the p Bi2Mo2 0 9
Acknowledgements
I would like to thank Professor Richard Catlow for supervising me as a Ph.D. student over the last few years.
Dr. Gopinathan Sankar whose advise and ideas have been invaluable over the course o f my studies, especially in relation to XAS techniques.
Dr. Saiful Islam at the University o f Surrey who has taken a great interest in my calculations o f the P Bi2Mo2 0 9 phase.
Professor Alan Chadwick at the University o f Kent, who let me use his conductivity rig, also the two Georges for their practical help running the samples.
Dr. John Cooves at BP as my industrial contact took a keen interest in my research.
Dr. Fred Mosselmans at Daresbury, for being always ready to help me with any problems I had with XAS, and the odd Chelsea ticket.
Mr. Mike Sheehy and Mr. David Madill, who have always been quick to deal with any problems I’ve had, and suggest solutions.
For proof reading this thesis, I would like to thank Dr. Phil Barrett and Alice Witney.
David Coombes, John Turner, Ian Watts, Furie Corée, Sam French, Scott Woodley, Scott Turner. I am sure there are people who I’ve forgotten to mention, and I apologise to them, as this Ph.D. in many small ways involved “a cast o f thousands”.
Chapter 1
An Introduction to Bismuth Molybdates
1.1 Introduction
1.1.1 Overview of Catalysis
Catalysis is one o f the main areas o f chemical research, helping to provide the chemicals that make the modem industrial world possible; plastics, dmgs, and possibly most importantly, ammonia, the main ingredient in fertilisers, produced using the Haber process. This last example has allowed farmers to dramatically increase crop yields, one of the main reasons for the population explosion of the last hundred years.
Catalysts are defined as “a substance that increases the rate at which chemical equilibrium is attained without undergoing any chemical change itself’ by The Oxford Chemistry Mini Dictionary. Real catalysts however do undergo change, and can be degraded with use. The last half o f the definition should be “without being consumed in the reaction”. Catalysts can be divided into two broad categories, homogeneous or heterogeneous, depending on their mode of action. Both are important to industry, each having their advantages and disadvantages. A homogeneous catalyst is one, which is in the same phase as the reactants. An example is sulphuric acid, which is used extensively as a source o f acidity for acid catalysis in ligand phase, or Metallocenes, which are used extensively in polymerisation reactions (C. Janiak, 1998).
Heterogeneous catalysis involves the use o f catalysts that are in a different phase
from the reactants, i.e. the reactants are in the gas or liquid phase, and pass over
the surface o f a solid upon which they can react. The main advantage for this
type o f catalyst is that no separation problems exist; also the catalyst itself
normally lasts a lot longer and can be regenerated. Disadvantages are that the
number o f active sites might be low and some products might stick to the
surface, blocking the active site, and so preventing further reaction. The first
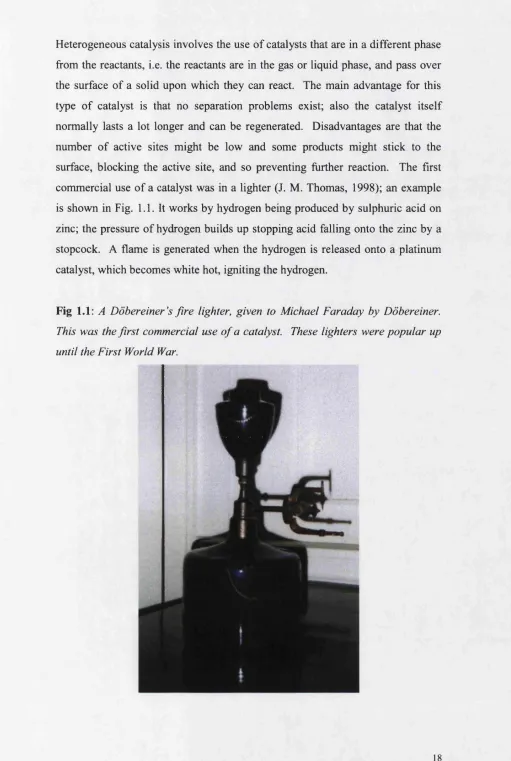
commercial use o f a catalyst was in a lighter (J. M. Thomas, 1998); an example
is shown in Fig. 1.1. It works by hydrogen being produced by sulphuric acid on
zinc; the pressure o f hydrogen builds up stopping acid falling onto the zinc by a
stopcock. A flame is generated when the hydrogen is released onto a platinum
catalyst, which becomes white hot, igniting the hydrogen.
Fig 1.1: A Dobereiner's fire lighter, given to Michael Faraday by Dobereiner.
This was the first commercial use o f a catalyst. These lighters were popular up
Current examples o f commercial uses for catalysts are catalytic exhausts in cars, which comprise supported noble metals. C0-M0/AI2O3 as a hydrodesulphurisation catalyst, and Cr/silica is used as an ethylene polymerisation catalyst. An important class of industrial catalysts for the last thirty years has beèn the bisihuth mblÿbdatês, which were originally used on their own, but now they are the base component for complicated multiphasic systems. This thesis reports the detailed characterisation o f the synthesis o f bismuth molybdate, subsequent phase transformations, and redox behaviour. Apart from experimental techniques, computer modelling has been utilised to investigate redox behaviour and doping effects.
1.2 Applications of Bismuth Molybdates
Bismuth molybdates are the basis for the industrial selective oxidation and ammoxidation catalysis of the lower olefins, allowing the conversion of propene to acrolein, in the presence o f oxygen:
C H 2= C H -C H 3 + O2 C H 2= C H -C H 0 + H2O
Acrylonitrile may be formed if ammonia is present as well as oxygen in the reaction mixture.
C H 2= C H -C H 3 + 3 /2 O 2 + N H 3 C H 2 = C H -C N + 3H 2O
1.3 What are Bismuth Molybdates?
A couple o f phase diagram studies have been performed on the Bi2 0 3 M0O3
system [Egashira et-al (1968), and Haber (1994)] and both indicate there are many phases, with a complicated relationship. There are though only three catalytically important phases o f bismuth molybdate, which have the general formula Bi2 0 3.nMo0 3 where n is 3, 2, or 1. These are referred to respectively as
the (X, p , and Y phases. In all the phases. Mo has a formal charge o f plus six, and bismuth of plus three.
Structures
1.3.1 a Phase
Bi2Mo3 0i2 or the a phase was refined by Theobald and Laarif (1985) using powder neutron diffraction. The space group was identified as P2i/c, and its lattice parameters as:
a
-7.7104(3)A
b -
11.5313(4)A
c - 11.9720(5)
A
a = Y = 90°, p = 115.276(3)
p Phase
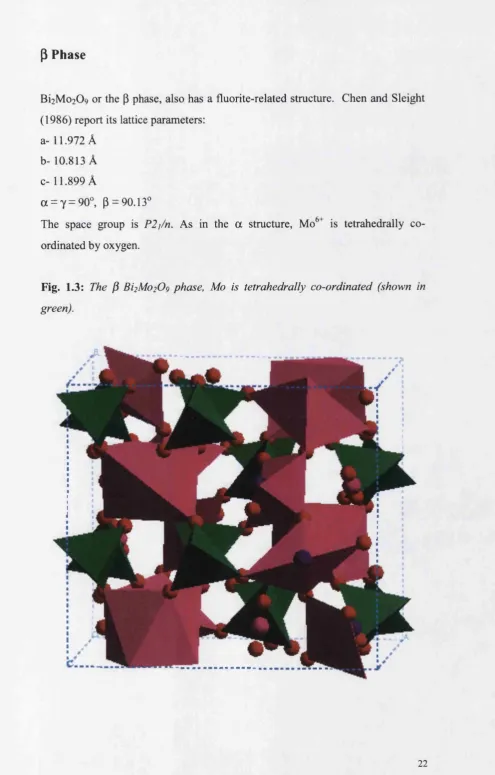
B12M02O9 or the p phase, also has a fluorite-related structure. Chen and Sleight (1986) report its lattice parameters:
a- 11.972 Â
b- 10.813 Â
c- 11.899 Â
a = y=90^ P = 90.13‘’
The space group is P2i/n. As in the a structure, Mo^^ is tetrahedrally co
ordinated by oxygen.
Fig. 1.3: The P Bi2Mo209 phase, Mo is tetrahedrally co-ordinated (shown in
Y Phase
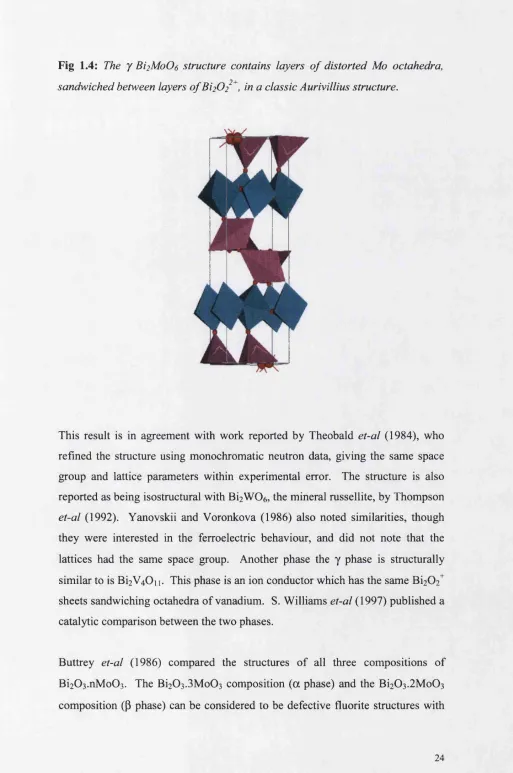
Unlike the a and p phases, the y B12M0O6 phase, occurs naturally as the mineral
Koechlinite. Also, unlike the other two phases, it has an Aurivillus structure. Teller et-al (1984) refined a structure using time-of-flight powder neutron diffraction data. They reported its space group as Pca2i (though a printing error in the abstract notes the space group as Pna2j), and the unit cell as being orthorhomic with the following lattice parameters:
a- 5.4822(3)
A
b- 16.1986(8)
A
c - 5.5091(3)
A
a=p=y=90°
Fig 1.4: The y Bi2Mo06 structure contains layers o f distorted Mo octahedra,
sandwiched between layers o f Bi202^^, in a classic Aurivillius structure.
This result is in agreement with work reported by Theobald et-al (1984), who
refined the structure using monochromatic neutron data, giving the same space
group and lattice parameters within experimental error. The structure is also
reported as being isostructural with Bi2W0 6, the mineral russellite, by Thompson
et-al (1992). Yanovskii and Voronkova (1986) also noted similarities, though
they were interested in the ferroelectric behaviour, and did not note that the
lattices had the same space group. Another phase the y phase is structurally
similar to is Bi2V4 0i i. This phase is an ion conductor which has the same Bi2 0 2^
sheets sandwiching octahedra o f vanadium. S. Williams et-al (1997) published a
catalytic comparison between the two phases.
Buttrey et-al (1986) compared the structures o f all three compositions o f
cation vacancies, with columns o f Mo polyhedra enclosing bismuth oxide chains. Conversely, the stable Bi2 0 3.Mo0 3 (y phase) is a classic example o f an
Aurivillius phase with sheets o f Bi202^^ sandwiching octahedrally co-ordinated cations (Mo in this instance). A high temperature polymorph however, known as the y phase can be considered in the same way as the a and P phases, comprising Mo polyhedra enclosing chains of bismuth oxide in a defective fluorite related structure. Two other phases are also discussed with compositions
3Bi2 0 3.2Mo0 3 and 19Bi203.7Mo03 (Buttrey designates them as the Ô and £ phases respectively), both these also have structures that can be described as defective fluorite structures.
1.4 Phase Transformations
The Y phase also undergoes phase changes reported by a number o f groups (Sankar et-al {1995} and Wananabe et-al{\9^1}). The first transformation is to an high temperature intermediate phase (generally referred to as the y* phase) which then further transforms to the highly stable y’ phase.
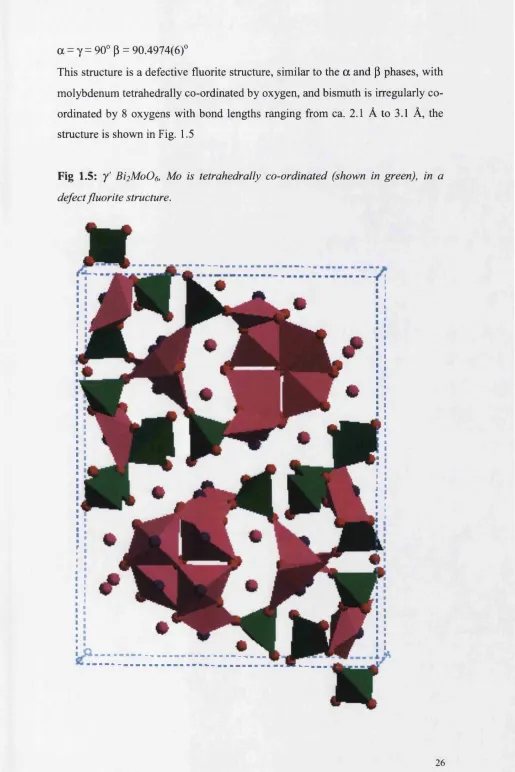
Sankar et-al (1995) carried out a combined XAS/XRD study o f the phase change. Firstly, a reversible change to an unknown structure was noted. XAS studies of the Mo k-edge show the phase contains Mo^^ in a highly distorted octahedra. They also refined the structure using the space group, Pca2j, which is surprising, as a first order phase change has occurred. Another possibility is that this phase transformation is analogous to that in the structural analogue Bi2W0 6, whose space group transforms from Pca2i to Aba2 at 933 K (696°C). Structurally, the ions are in an irregular octahedra, as reported by Knight (1993). On further heating, the y ’ phase transforms irreversibly to the y’ phase, which has been reported as being monoclinic, with the space group P2i/c with the following lattice parameters (Buttrey et-al, 1994), based on neutron powder diffraction and X-ray single crystal data:
a- 17.2627(1) Â b - 22.4296(2)
A
a = y = 90° p = 90.4974(6)°
This structure is a defective fluorite structure, similar to the a and P phases, with
molybdenum tetrahedrally co-ordinated by oxygen, and bismuth is irregularly co
ordinated by 8 oxygens with bond lengths ranging from ca. 2.1 Â to 3.1 Â, the
structure is shown in Fig. 1.5
Fig 1.5: 7' Bi2MoOs, Mo is tetrahedrally co-ordinated (shown in green), in a
The intermediate y* phase was studied by Theobald et-al (1982), who used single crystal X-ray diffraction to look at their sample. They suggest that any o f the following space groups are possible: P42/nmc, P4/nmn, P4/n or P42/n. They note that the unit cell is tetragonal with the following axes a = b = 11.880(5) Â, c= 10.778(1) Â. The method o f sample preparation is unusual, the y*’ crystals being synthesised by the decomposition of the P phase.
1.5 Other Bismuth Molybdate Phases
Other phases o f bismuth molybdates, with different stoichiometries, exist but do not appear to have any significant catalytic activity. Phases mentioned in the literature are BiM0 2 0 7 0H»2H2 0 by Hriljac et-al (1993). This unit cell is
monoclinic, P2;/w, with dimensions: a = 6.34321(3) Â, b = 11.59703(5) Â, c = 5.79244(3)
A,
p = 113.329(1) °. The refinement was carried out using XRD data collected using synchrotron radiation. The authors report that Mo and Bi have formal charges o f 6+ and 3+ respectively; the overall formula unit from thecrystallographic data is reported as being BiMoiOio. The material is charge balanced by 5 H ions per formula cell. Mo as in the y phase is co-ordinated by in a distorted octahedron with 2 short bonds {ca. 1.72
A),
2 regular bonds {ca. 1.94A),
and 2 long bonds {ca. 2.27A).
The Mo octahedra form edge-sharing dimers, which are linked to form chains. These chains are linked by long bonds to bismuth chains, forming a much more open structure than in the y phase. Hriljac et-al (1995) also report a neutron diffraction study o f the material, the two refinements are in good agreement. They also note that the BiMo2 0io is a candidate for an ammoxidation catalyst, being bimetallic with a fairly open framework structure, which would allow oxygen mobility. Unfortunately, it is not structurally stable above 150°C , though it is suggested that more tightly binding ligands than water might increase the stability.and it was concluded that the space group was more likely to be P2/c-Cf2h- The lattice parameters are reported as:
a- 24.786
A
b-
5.805A
c- 23.527
A
a = 7 = 90° p = 102.56°
Buttrey et-al (1986) reported another new phase, BiggMoyOyg, which is fluorite related, and has an orthorhombic unit cell. Using x-ray powder diffraction, the space group was identified as Pccn, with lattice parameters:
a - 16.818(3)
A
b- 28.658(2)
A
c- 16.903(5)
A
a = p
= 7= 90°1.6 Catalytic Activity
TABLE 1.1 Thermodynamics o f oxidation reactions [from Stull et-al (1969)]
R e a c tio n s AG®427®c (k cal/m ol)
OsHe + O2 CH2=CHCH0 + H2O -8 0 .8 2
C3H6 + 3/2O2 CH 2=CH C00H + H2O -1 3 1 .4 2
C3H6 + 3O2 3 0 0 + 3H2O -3 0 4 .9 5
C3H6 + 9/2O2 —> 3CO2 + 3H2O -4 6 3 .8 6
C3H6 + NH3 + 3/2O2 CH2=CHCN + 3H2O -1 3 6 .0 9
C3H6 + 3/2NH3 + 3 / 2 0 2 -> 3/2CH3CN + 3H2 0 -142.31
C3H6 + 3NH3 + 3O2 ^ 3HCN + 6H2O -2 7 3 .4 8
SOHIO workers came up with a hypothesis, which had the two postulates, listed below in their early research into selective oxidation catalysts (Grasselli and Burrington 1981):
1) The number of active oxygens in isolated groups should be limited (site isolation).
2) The metal-oxygen bond energy for the active oxygens, at reaction conditions, should allow the rapid removal and addition of oxygen to the system.
1.7 Reaction Mechanism
Early work on the mechanism of selective oxidation used copper oxide as the catalyst. Voge et-al (1963) proposed a number o f possible pathways for the oxidation reaction. The first involved the removal o f a H from the methyl group, or alternatively, the addition o f O to the double bond. To elucidate which process occurs, they isotopically labelled the C on the methyl group, and observed the reaction products using mass spectroscopy. In the final reaction products they observed that 50% of the labelled C occurred on the CHO group. This observation can most easily be explained by a mechanism in which a H on the methyl group is extracted first, followed by isomérisation o f the intermediate, and addition of an oxygen atom to either of the two terminal carbon atoms. If the first step had been the addition o f an oxygen atom to the double bond, no should occur in the CHO, above natural levels.
Adams and Jennings (1963) used deuterium in an isotopic labelling study. Propene with the methyl deuterated, C 3H 5D , was used to study the mechanism
for oxidation and ammoxidation over copper oxide and bismuth molybdate. Their results ruled out any exotic three carbon ring intermediates because D was only found on the terminal carbons of acrolein and acrlyonitrile. They report that the only model, which fits the data, involves hydrogen being abstracted from the methyl group. Further abstraction of hydrogen atoms can occur from either o f the terminal carbons, as they are electronically equivalent. They also note ‘that the path of reactions to acrolein and acrlyonitrile is the same over the two catalysts’. For the oxidation o f propene therefore to acrolein, the pathway below is the most likely:
CH2=CH-CH3 -catalyst surface
A hydrogen is abstracted from the methyl group, giving.
Oxygen is then added to either end of the molecule, giving: CH2=CH-CH= 0 or 0 =CH-CH=CH2
A second hydrogen atom is abstracted from either terminal carbon; oxygen can then be attached to either o f the two terminal carbons, as they are equivalent. In a subsequent paper Adams and Jennings (1964) studied the kinetic isotope effect for the catalytic reaction over a bismuth molybdate catalyst. The kinetics o f this reaction are first order with respect to propene concentration and independent o f O2. If the propene was deuterated on the methyl group, a kinetic
effect was observed, this was not seen if the sample was deuterated on either of the other two carbons. This further supports their proposed mechanism.
Buttrey et-al (1996) suggested that the catalytic Bi2Mo0 6 phase, might be the
high temperature y’ polymorph, rather than the y phase since the y’ structure is closely related to that o f the a Bi2Mo3 0i2 and p Bi2Mo2 0 9. Portela et-al (1991)
carried out a comparison between the two phases using but-l-ene as the reactant gas. They report that the y phase has a higher activity for this process, and they infer that the removal o f oxygen is easier than for the more open layer structure that the y phase has.
1.8 Redox properties
Table 1.2: Mechanisms fo r Propylene ammoxidation in the literature (published by Arora et-al, 1996)
Step Matsuura Haber Sleight Grasselli et-al
Olefin Chemisoiption Mo (B site) Bi Mo Mo
NH3 Mo (B site) Mo Mo Mo
Chemisoiption
NH formation
1*‘ allylic H abstraction Mo (B site) Bi Mo Bi
2nd abstractions Mo (B site) Mo Mo Mo
0(N H ) insertion Mo (A site) Mo Mo Mo
A number o f spectroscopic studies have been performed using Hoefs et-al
Fig. 1.6: Restructuring o f molybdenum octahedra into shears (taken from
Grasselli et-al, 1981)
r e d u c t i o n
v e r y a c t i v e
s e l e c t i v e e g e n e r a t i o n
□ =
v a c a n c yo x y g e nX
X V
X
X X
v e r y
X
a c t i v e
X
v e r y s e l e c t i v e
l e s s a c t i v e
r e s t r u c t u r i n g
An interesting observation concerning the y phase is that it changes colour when reduced from yellow to green or grey (Buker and Greaves, 1987). This colour change is not associated with any change in the XRD pattern of the sample. This colour change is also reversible on heating in oxygen.
1.10 Aims of this Thesis
References
C. R. Adams, T. J. Jennings, J. CataL, 2, 63, (1963) C. R. Adams, T. J. Jennings, J. Catal 3, 549, (1964)
N. Arora, G. Deo, I. E. Wachs, A. M. Hirt, J. Catal., 159,1, (1996) R. A. Barker, C. Greaves, J. Catal. 108, 247, (1987)
D. J. Buttrey, D.A. Jefferson, J. M. Thomas, Phil. Mag. A, 53, 897, (1986) D. J. Buttrey, D.A. Jefferson, J. M. Thomas, Mat. Res. Bull, 21, 739, (1986) D. J. Buttrey, T. Vogt, U. Wildgruber, W. R. Robinson, J. Solid State Chem.,
111,118, (1994)
D. J. Buttrey, T, Vogt, G. P. A. Yap, A. L. Rheingold, Mater. Res. Bull, 32, 947, (1997)
J. L. Callahan, R. K. Grasselli, AIChEJ., 9,755 (1963) H-Y Chen, A. W. Sleight, J. Solid State Chem., 63, 70, (1986)
A. Chippendale, A. Cheetham, “Molybdenum: An outline o f its Chemistry and Uses”, Chp. 3, Ed. E. R. Braithwaite, J. Haber, Elsevier, Amsterdam, (1994) M. Egashira, K. Matsuo, S. Kagawa, T. Seiyama, J. Catal, 58,409, (1979) B. C. Gates, ^^Catalytic Chemistry*, Wiley., New York ,(1992)
R. K. Grasselli, Catal, 15,127, (1985)
R. K. Grasselli, J. D. Burrington, Advances Catal, 30, 133, (1981)
R. K. Grasselli, J. D. Burrington, J. F. Bradzil, Faraday Discussions, 72, 203, (1981)
J. Haber, Molybdenum: An Outline o f its Chemistry and Uses**, Ed. E. R. Braithwaite and J. Haber, Elsevier, Amsterdam Lausanne New York Oxford Shannon Tokyo, (1994)
G. W. Heame, M. Adams, U.S. Patent, 2,451,485 (to Shell Development Company), (1948)
E. V. Hoefs, J. R. Monnier, G. W. Keulks, J. Catal, 57, 331, (1979) J. A. Hrilijac, C. C. Torardi, Inorg. Chem., 32, 6003, (1993)
c . Janiak, “Metallocenes'\ Chp. 9, Ed. A. Togni, R. L. Halteraian, Wiley-VCH, Weinheim, (1998)
K. S. Knight, Ferroelectrics, 150, 319, (1993)
Y. Moro-Oka, W. Ueda, Advances Catal., 40,233, (1994)
S. Miyazawa, A. Kawana, H. Koizumi, H. Iwasaki, Mater. Res. Bull, 9, 41, (1974)
M. F. Portela, C. Pinherio, C. Dias, M. J. Pires,. ^^Structure-Activity and Selectivity Relationships in Hetrogeneous Catalysis.^' Ed. R. K. Grasselli, A. W. Sleight, Elsevier, Amsterdam (1991)
G. Sankar, M. A. Roberts, J. M. Thomas, G. U. Kulkami, N. Rangavittal, C. N. R. Rao,y. Solid State Chem., 119, 210, (1995)
D. R. Stull, E. F. Westrum, G. C. Sinke., “The Chemical Thermodynamics o f Organic Compounds. " Wiley, New York (1969)
R. G. Teller, J. F. Bradzil, R. K. Grasselli., Acta Cryst. C 40,2001, (1984) F. Theobald, A. Laarif, Mat. Res. Bull,. 20, 653, (1985)
F. Theobald, A. Laarif, A. W. Hewat,. Ferroelectrics, 56, 219, (1984) F. Theobald, A. Laarif, M. Tachez, J. Catal, 73, 357, (1982)
J. M. Thomas, W. J. Thomas, “Principles o f Hetrogenous Catalysis”, VCH, Weinheim, (1998)
J. G. Thompson, S. Schmind, R. L. Withers, A. D. Rae, J. D. Fitzgerald,. J. Solid State Chem., 101, 309, (1992)
C. N. R. Rao, J. Gopalakrishnan, “New Directions in Solid State Chemistry”,
Cambridge University Press, Cambridge, (1986)
T. Uda, T. T. Lin, G. W. Keulks, J. Catal, 129, 307 (1991)
H. H. Voge, C. D. Wagner, D. P. Stevenson, J. Catal, 2, 58, (1963)
Chapter 2
Experimental Methods
2.1 Summary
In chapter 1, the structural chemistry, properties and catalytic activity of bismuth
molybdates were described. In this chapter the experimental techniques used to
investigate these materials are discussed. In particular X-ray absorption
spectroscopy, X-ray powder diffraction, thermal methods and infra red
spectroscopy have all been applied in this thesis. In each case an overview of the
technique is presented and its applicability to the work reported in this thesis
discussed before a description of the practice and data analysis procedure is
given.
2.2 Sample preparation
A large number of preparative techniques are used throughout solid state
chemistry (see Corbett, 1988, for an in depth overview of these methods). Bi
metallic oxides have traditionally been prepared by a “Bake and Grind” method,
using the single oxides of the metals. The general method involves the
stoichiometric ratio of oxides (or carbonates) being measured out, ground
together, before pressing into a pellet and then fired at the appropriate
temperature, with occasional regrinding if the reaction is slow. The phase is
formed by single oxide grains touching, allowing cations to migrate from one
particle to the other, so that a layer of product is formed. The main advantage of
this method of preparation is its ease. However there are a number of
disadvantages:
1) Long preparation times, due to reactions only occurring at the surface of
relatively large particles (typically in the |L i m range).
2) Impurities, due to poor mixing, regions can be non-stoichiometric and lead to
To overcome some of these drawbacks a number of other methods are in use to
prepare bimetallic and higher oxides. A common one is a nitrate method, where
the nitrates of the metals are dissolved in acid and combined. The solution is
dried and the remaining powder is fired. The advantage of this method is that all
the metals are mixed at the atomic level so reaction times are greatly reduced and
the formation of unwanted phases is also decreased. The only obvious
disadvantage of this method is that it can not be used in cases where the metal
nitrate solubilities are highly different or when nitrates of the correct valency do
not exist. Other exotic sample preparation methods exist for oxide powders such
as the use of foams of citric acid and ethylene glycol (Tai and Lessing, 1992).
Acetate glasses, which can then be dissolved away to leave a homogeneous
precursor material, have been used to make rare earth analogues of YBaiCu^O?
(McHale et-al, 1995).
The a and y bismuth molybdate phases are normally prepared using a co
precipitation technique (examples are Teller et-al {1984} and Herrmann et-al
{1984}). Separate solutions of bismuth nitrate (Bi2 0i dissolved in nitric acid)
and ammonium heptamolybdate (NH4)6Mo?024.4H20, dissolved in ammonium
hydroxide are prepared. These two solutions are then combined in the
appropriate stoichiometric ratios and the resulting solution is then neutralised
using ammonium hydroxide. A precipitate is formed which is then heated at 500
“C temperature overnight to form either the a or y phase. The p phase is
prepared in almost the same way, but instead of adjusting the pH to 7 it is
adjusted to 2. According to Grasselli (1981) at higher pH’s a mixture of a and y
phases are formed instead. A detailed study of this preperative method for the p
phase was carried out by Grzybowska et-al (1972). They concluded that Mo is
present in two different forms in the precipitate at pH 2, further raising of the pH
dissolves one of theses types.
The solid state method is also used to form bismuth molybdate phases, Bi2 0 3 and
M0O3 are ground together in the correct stoichiometric ratio and fired (below
550^C for the y phase). Both these two methods have been used to prepare
and the solid state reaction using IR spectroscopy with particular attention to the
(3 Bi2Mo2 0 9 phase. A further paper studying the solid state reaction between the
bismuth and molybdenum oxides was written by Rastogi et-al (1982), they
concluded from capillary studies and particle size measurements that the Mo is
the mobile cation, diffusing into the Bi2 0 3 grains to form the product.
Another technique to prepare bismuth molybdates is the “slurry” method,
reported by Buker and Greaves (1987) and Batist et-al (1973). This method
involves BiONO^ and H2M0O4. This method has not been used to produce any
samples in this thesis.
2.3 Thermal Analysis
Thermal analysis is defined as the measurements of physical and chemical
properties as a function of temperature. An obvious example is the change in
length of a metal bar when heated or cooled. There are a number of different
thermal measurements, which are commonly used by chemists to study solids.
The two most common techniques are thermogravimetric analysis (TGA) and
differential thermal analysis (DTA), a refinement of DTA is differential scanning
calorimetry (DSC).
TGA is simply the measurement of the change in weight of a sample with
temperature or time. The sample weight is normally a few milligrams (small
sample sizes are preferable, since they minimise thermal gradient effects), and if
the sample is being heated the heating rate is normally in the range of 1 to 20°C
min'*. Fig 2.1 shows an idealised TGA plot. What should be noted is that the
weight change is a fundamental property of the sample; the temperature at which
it occurs is variable. Factors that can affect the onset of decomposition are the
heating rate, particle size of the solid and the atmosphere used. CaCO] shows a
striking example of the effect of atmosphere on the temperature of
decomposition. In-vacuo CaCOs decomposes at 500°C, in CO2 at 1 atmosphere
Fig 2.1: An idealised TGA plot, weight loss is plotted against temperature or
time.
Ui
O)
Temp / Time
DTA involves the comparison between the heat difference of the sample and an
inert reference material as function of temperature; an example of its use with
respect to bismuth molybdates is by Batist et-al (1968). The sample and the
reference should be at the same temperature until a thermal event occurs such as
a phase change or decomposition. When a change occurs the sample temperature
is either lower than the reference material for an endothermie event, or is higher
if the event is exothermic. DTA has a number of disadvantages in that it is
difficult to use the data quantitatively to measure changes in enthalpy. DSC is
very similar to DTA, but the power input difference between the reference and
the sample are normally measured which is more accurate. The difference in
temperature may also be used but very careful attention must be paid to the cell
design.
Thermal measurements are commonly used to study phase changes and also
decompositions. An example of the use of DSC and TGA to complement each
other is in the study of the thermal decomposition of three different
In this work TGA and DSC have been used as complementary techniques to
study both the formation of bismuth molybdates from precipitates and their
transformations at higher temperatures.
2.4 Synchrotron Radiation
Though not a method in itself synchrotron radiation has been vitally important to
the experiments which are presented in this thesis. Synchrotron radiation is an
intense source of white radiation generated by a beam of charged particles (either
electrons or positrons) travelling at speeds approaching that of light, around
circular accelerators. These accelerators are normally storage rings like the
Daresbury Synchrotron Radiation Source. These allow an injected beam of
electrons to be captured for a number of hours as their energy is boosted by a
series of magnets around the circumference of the ring. The radiation generated
has a number of advantages over other sources:
1) Intensity. Synchrotrons generate beams that are up to 10^ times greater than
that of a rotating anode, the most powerful laboratory source of X-rays.
2) Tuneability. Synchrotron radiation has a spread of wavelengths from 0.1 À to
10^ A. Moreover the emission spectra is smooth, unlike laboratory sources,
which are broken by characteristic lines.
3) Collimation. The beam is highly collimated, i.e. it has a very narrow angular
divergence in the plane of the accelerator; typical values are 0.0 1° to 0.0 2°. Developments in magnet technology have also helped reduce divergence of
the beam.
4) Polarisation. At X-ray wavelengths the beam is over 95% polarised in the
plane of the accelerator.
These characteristics of the radiation generated by synchrotrons have a number
of advantages to the chemist.
1) Small sample sizes, typically a few mg in weight only are needed for
2) The high intensity with modern detector technology allows high quality data
to be collected in a short period time be it XAS or XRD. This allows
dynamic processes to be studied in real time.
3) White radiation allows experiments such as EDXAS and EDXRD to be
performed.
4) XAS for all most all elements is possible with a smooth tuneable source.
Tuneability of the wavelength also allows techniques such as anomalous
diffraction to be performed.
The University of Wisconsin-Madison opened the first dedicated synchrotron
radiation source at Tantalus in 1966. Now there are sources all over the world
and many such as Diamond in the planning stage. A general introduction to
synchrotron radiation has been written by Catlow and Greaves (1986) and two
books, which describe the characteristics of synchrotron radiation and its
applications in more detail are by Margaritondo (1988) and Catlow and Greaves
(1990)
2.5 X-Ray Diffraction Techniques
X-ray diffraction provides information on the long-range atom order.
Crystal structures have been investigates using x-ray diffraction since the 1920’s.
Bragg published his first paper on the subject (1913), but the war stopped further
development until later. Originally only single crystals with simple structures
could be fully characterised by these methods. With the advent of electronic
computers more complex structures could be attempted as the number of
calculations needed to solve a complex structure was no longer a limiting factor.
In the late sixties Rietveld introduced his refinement process which allows the
lattice structure to be deduced from data collected from polycrystalline powders.
Before this powder diffraction was used primarily for phase identification, using
the recorded pattern as a finger print. To gain further information is difficult as a
powder XRD pattern is a projection of the 3D crystal structure into ID. In many
being obtained. Part of these difficultties are overcome by the Rietveld method,
which allows a structural model to be refined over the whole XRD pattern. For
an overview of the Rietveld technique see Young (1993). In addition McCusker
et-al (1999) provides a step by step guide to actually carrying out a structure
refinement from powder data. A. K. Cheetham (1988) gives an overview of
diffraction methods as applied to solid state chemistry.
Two other types of radiation are used apart from X-rays for diffraction, neutrons
and electrons. Neutron diffraction is expensive as a nuclear reactor (such as the
ILL in Grenoble) or a high-energy spalation source (such as ISIS just outside
Didcot) is required. It has the advantage that the neutron scattering power is not
dependent on electron density, so light ions, such as oxygen in systems
containing ions like Bi and Mo, can be observed.
In this project powder x-ray diffraction has been employed for phase
identification. The Bragg equation (Eqn. 2.1) relates the recorded 20 values to d
spacings for the symmetry allowed reflections.
nX = 2 d ûn 0
Eqn 2.1Changes in peak positions allow us to monitor changes in the size of the unit cell.
In addition from the number of peaks present and in particular the presence of
systematic absences, the lattice symmetry can also be deduced. Throughout this
thesis a STOE D500 diffracometer with a Cu Ka source operated in flat plate
mode was used. X-ray diffraction patterns were recorded and compared with
other samples, which had been previously made in the lab, and the JCPDS
2.6 X-ray Absorption spectroscopy
X-ray absorption spectroscopy or XAS is a technique that has been developed
since the 1960s to study the local structure around a specific ion in a system, in
contrast to XRD, which is a long-range order technique, and the information can
only be gained if the sample is an ordered material. XAS however gives
information on glasses and other disordered systems, which are only structurally
ordered over a very short distance (i.e. a bond length)(for a general discussion
see Evans, 1986). Another advantage is that in crystals where two elements
share the same crystallographic site, the data is averaged out, so it is not possible
to get specific bond lengths for either ion by XRD. In XAS this problem does
not arise, as the technique is ion specific. A recent review of the technique
covers its theory and application to the study of solids (Etourneau, 1998).
With the introduction of synchrotron radiation in the 1980s XAS become an ever
more useful tool as scanning times are of the order of minutes not hours, which
allows processes, such as phase changes and catalysts under operating conditions
to be studied in real time. Thomas et-al (1998) gives an overview of recent
advances in this area.
2.6.1 Theory of the X-ray Absorption Process
The general principle is that an element has a characteristic energy at which its
atoms will absorb and eject an inner core electron to a higher unoccupied shell.
How the absorption varies with energy yields information on bond distances,
bond strength, co-ordination number, oxidation state, and static disorder. The
absorption of X-rays by the sample follows the Beer-Lambert Law (Eqn 2.2).
f i x
= l0 g (Iq I I )
E q n2.2:I is the intensity of the transmitted beam for an incident intensity lo, x is the
![Fig 1.2: The a Bi2MosO]2 phase Mo polyhedra are in green, and Bi are purple.](https://thumb-us.123doks.com/thumbv2/123dok_us/8614994.1404702/24.595.26.540.30.802/fig-bi-moso-phase-mo-polyhedra-green-purple.webp)