INTER AND INTRA CONSTITUENT ANALYSIS OF
INTELLECTUAL CAPITAL CONSTITUENTS
*Dr. Priti Sharma
**Ravinder Kaur
ABSTRACT
This analysis has been made by the researcher to study whether the components of Intellectual Capital have any momentous distinctness between them or not, that is whether they belong to the same family- the Intellectual capital family along with this ascertainment of difference or similarities between the sub-constituents of a factor to know whether being a part of the same factor they have any relationship or not. Here, relationship means significant or momentous
relationship. This helps in apprehending the nature of factor more precisely. T- Test has been used by the researcher here in order to check the level of distinction. Result in case of inter-constituents analysis shows that both belongs (all inter-constituents) to the same family and has no internal distinctness in them but in case of intra-constituent analysis, it has been found that most of the sub-constituents enjoy great disparity between them. Despite belonging to the same family, their nature is different.
Keywords: Intellectual Capital, Human Capital, Relational Capital, Structural Capital, Organizational culture and value system capital, service sector.
* Assistant Professor, Department of Commerce, M. D. University, Rohtak
Introduction
The term “Intellectual Capital” was first introduced by economist John Kenneth Galbraith in 1969. Bontis (1998) believed that Intellectual Capital was more than pure intellect but it also included “intellectual action”. Andriessen’s (2001) assertion that “The Intellectual capital
movement is relatively young in terms of research, but already rich in history” means it existed in yesteryears but its existence has been realised a few decades back only. Its role as the main value driver has been objectively established by different scholars in the annals of Intellectual Capital and its development.
In a treatise, Galbraith (1969) described the term intellectual capital as “the difference of an organization’s market value and book value”. In another concept, Bontis (1996) demonstrated intellectual capital as “the difference between the market value of the company and the replacement cost of assets”. In other studies, Intellectual Capital has been described as the difference between the market value and financial capital of that enterprise at a given date (Roos, Roos, Dragonetti, and Edvinsson, 1997, pp. 2; Sveiby, 1997, pp. 3-18). In another study, Brooking (1996) elucidated the concept of Intellectual Capital as the combination of market assets, human-centered assets, intellectual property assets, and infrastructure assets.In an article, Edvinsion and Malone (1997: 44) defined intellectual capital in the following way:
“Intellectual Capital is the possession of the knowledge, applied experience, organisational
technology, customer relationships and professional skills that provide Skandia with a
competitive edge in the market”
Taxonomy of Intellectual Capital Constituents- A Literature Review
Karl-Erik Sveiby first proposed a classification for IC, dividing it into three broad areas of intangibles, viz., human capital, structural capital and customer capital (Sveiby, 1997)—the classification that was most accepted and which was later modified and extended by replacing customer capital with relational capital by Nick Bontis, (1996). Classification of Intellectual
Human Capital = Know-how, Education, Vocational qualification, Work-related knowledge, Occupational assessments, Work-related competencies, Entrepreneurial élan, innovativeness, proactive and reactive abilities, and changeability.
Organisational Capital (Structural Capital) = Intellectual Property, Patents, Copyrights, Design
rights, Trade secrets, Trademarks, Service marks.
Relational (Customer) Capital = Brands, Customers, Customer loyalty, Company names, Backlog orders, Distribution channels, Business collaborations, Licensing agreements, Favourable contracts, Franchising agreements. This classification has almost included all the aspects besides, organisational culture, process and procedure, value system etc.
In another classification made by Guilding and Pike (1990) divided intangibles into three groups taking marketing view: value creator, marketing assets and value manifestations. Mortensen et. al. (1997) classified Intellectual Capital, from financial perspective, into innovation capital, structural capital, executory contracts, market capital and goodwill. In another taxonomy given by Roos et. al. (1997), Intellectual capital yields two classes: human capital and structural capital. This division is based on the principle of the location of particular capital. According to Bontis (2001, 2002), the generative intangibles, like human capital, internal capital and external capital, also called Intellectual Capital. In this, he classified IC into three categories namely: human, internal, and external capital.
In another categorisation, Leliaert et. al. (2003) defined four base classes of IC: (1) Human;
(2) Customer;
(3) Structural capital; and
(4) Strategic alliance (or partner) capital.
In another demarcation, Stewart (1997) classified IC as in figure given below:
The classification given by Stewart is not all inclusive because it has taken only customer capital in place of relational capital. In another classification, Sveiby (1997) divided Intellectual Capital in three parts. First employee’s competences, second internal structure and third external structure. In this, employee’s competencies include the ability of acting in a variety of situations to create tangible and intangible assets using their experience and education. Internal structure consists of patents, concepts, models and IT systems. The external structure includes relations with clients and suppliers. It includes brands, reputations and images. This conceptualisation hasn’t included the organisational capital in it. According to Edvinsson and Malone (1997), IC consists of three basic components: human capital, structural capital, and customer capital.
1. Human capital includes knowledge, skills, and abilities of employees. It is an organization’s combined human capability for solving business problems.
2. Structural capital is everything in an organization that supports employees (human capital) in their work. It is the supportive infrastructure that enables human capital to function. Because of its diverse components, Edvinsson and Malone, (1997) further classified structural capital into organizational, process, innovation and intangible capital.
– Organizational capital includes the organization philosophy and systems for leveraging the organization’s capability.
– Process capital includes the techniques, procedures, and programs that implement and enhance the delivery of goods and services.
– Innovation capital includes intellectual properties and intangible capital. Intellectual properties
– Intangible capital is all of the other talents and theory by which an organization is run.
3. Customer capital is the strength and loyalty of customer relations. The relationship with customers is distinct from other relationships either within or outside an organization.
In this categorisation, author had not included relationship with other stakeholders, but this had
made good delineation with structural and human capital.
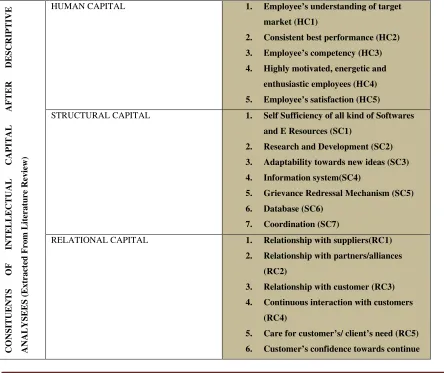
For the purpose of analysis, researcher has divided Intellectual Capital Constituents into four categories i.e. human capital, relational capital, structural capital and organizational culture and value system capital.
Table 1. LOGICAL CATEGORISATION OF INTANGIBLE ASSETS (With their Codes)
C
O
N
S
IT
U
E
N
T
S
O
F
IN
T
E
L
L
E
C
T
U
A
L
C
A
P
IT
A
L
A
F
T
E
R
D
E
S
C
R
IP
T
IV
E
A
N
A
L
Y
S
E
E
S
(
E
x
tr
a
ct
ed
F
ro
m
L
it
er
a
tu
re
R
ev
ie
w
)
HUMAN CAPITAL 1. Employee’s understanding of target market (HC1)
2. Consistent best performance (HC2) 3. Employee’s competency (HC3) 4. Highly motivated, energetic and
enthusiastic employees (HC4) 5. Employee’s satisfaction (HC5)
STRUCTURAL CAPITAL 1. Self Sufficiency of all kind of Softwares and E Resources (SC1)
2. Research and Development (SC2) 3. Adaptability towards new ideas (SC3) 4. Information system(SC4)
5. Grievance Redressal Mechanism (SC5) 6. Database (SC6)
7. Coordination (SC7)
RELATIONAL CAPITAL 1. Relationship with suppliers(RC1) 2. Relationship with partners/alliances
(RC2)
3. Relationship with customer (RC3) 4. Continuous interaction with customers
(RC4)
their association with organization (RC6) 7. Loyalty and goodwill enjoyed among
customers (RC7)
8. Image/ Market share (RC8)
ORGANISATIONAL CULTURE AND VALUE SYSTEM CAPITAL
1. Recognition to employee’s efforts (OC2) 2. Up-gradation of employee’s skill and
knowledge when they require (OC3) 3. Comprehensive recruitment policy and
dedicated towards hiring best candidate (OC4)
4. Quality of service (OC5)
5. Foster development and maintenance of internal relationship (OC6)
6. Feedback from customer/client (OC7) 7. Receptiveness towards employee’s
innovative ideas (OC9)
8. Supportive and conducive atmosphere (OC10)
9. Continuous on schedule (OC11) 10. Prevalence of fraternity values (OC12) (Source: Self developed by the researcher thorough literature review)
Research Methodology
In this study, exploratory-cum-descriptive research design has been used by the researcher.
Sample Design
“A sample design is a definite plan determined before any data are actually collected for obtaining a sample from a given population”.
Sample design process consists of certain steps like Defining the target population, Determining the Sampling frame, Sampling size, and Sample technique.
Target Population
organizations of services industry have been taken because this is the industry which basically works upon or excel upon the soft or Intellectual Capital. Service industry mainly includes various kinds of sectors, but in this study seven strata’s of the same have been taken up, i.e. Banking, Insurance, Information Technology, Consultancy, Telecommunication, Hospitality, and
Education sector. In order to attain the data pertaining to the constituents of intellectual capital, the managers or branch managers or the CEO’s have been selected for filling the survey instrument.
Sample size
This refers to the number of elements to be included in the study. Initially, a sample of 160 organizations was selected and collected, but at the time of application of the Structural Equation Modeling Technique, the researcher realized that at least 200 samples were the minimum requirement for running this technique. Then, later on, the researcher extended the sample size from 160 to 201. Originally, 600 questionnaires have been sent, and in return, the researcher got only 201 (means response rate was 33.5%). Hence, a total of 201 sample size has been used in this study.
Sampling Technique
Initially, stratified random sampling technique was used by following the criteria:
Banking Sector 25 Insurance Sector 25
Information Technology Sector 25 Hospitality Sector 25
Consultancy Sector 25 Telecommunications Sector 10
Education Sector 25
But, when the researcher needed an extension in the sample size as well non-availability of respondents in Information Technology and Hospitality sector, then quota non-probability sampling has been used to increase the sample size. In upshot, Quota Sampling has been used in
Banking Sector 38 Insurance Sector 29
Information Technology Sector 23 Hospitality Sector 23
Consultancy Sector 31 Telecommunications Sector 11
Education Sector 46
In this way, a total of 201 samples were collected using the above-mentioned criteria, in order to
attain the objectives of the study.
Data Collection
In this study, the researcher has developed a well-structured questionnaire on five point Likert scale, from “Strongly Agree” to “Strongly Disagree.” 33 statements, concomitant with the constituents of Intellectual Capital, were put in a randomized way in order to identify new constituents by applying Common Factor Analysis which is also known as Principal Component analysis with Equamax Rotation. During Pilot study, the researcher found that Cronbach Alpha value was good (.832); then questionnaires were implemented on large scale.
Questionnaires were filled through personally as well as through on-line mode by preparing a questionnaire on Google Doc. (On-line survey).
Analytical Technique used
T- Test has been used by the researcher here in order to check the level of distinction. If Table value or critical value of ‘T’ is greater than the calculated value of ‘T’, accept the hypothesis or vice-versa. To analyse the data, T-test has been used here in order to check the momentous internal distinctness or similarities.
H01: There is no momentous distinction between the components of Intellectual Capital
Human Capital Relational
Capital
Structural
Capital
Org. Cul. & Val.
Sys. Cap
Mean
S.D
4.338
.364
4.162
.383
4.235
.306
3.74
.622
t-stat
table value =
1.96
HC vs. RC
t-value = .895
d.f. = 11
RC vs. SC
t-value = .393
d.f. = 14
SC vs. OC
t-value = 1.90
d.f. = 18
OC vs. HC
t- value = 1.89
d.f. = 15
HC vs. SC
t-value = .442
d.f. = 11
RC vs. OC
t-value = 1.68
d.f. = 18
Explanation:
In Table 1, the distinction between the constituents namely human capital, relational capital,
structural capital, and organisational cultural and value system capital have been shown, which has been checked or scrutinized using t-test (for independent variables with different variance). It has been found that there were no momentous or noteworthy difference between the constituents of Intellectual Capital as the table or critical value was greater than the calculated value of T-statistics (5% level of significance).
Hence, the researcher accepts the Null Hypothesis H01 and asserts that all the constituents were
the part of Intellectual Capital. Intra Constituent Analysis
H02: There is no momentous internal distinction between the sub-constituents of Intellectual
Capital components.
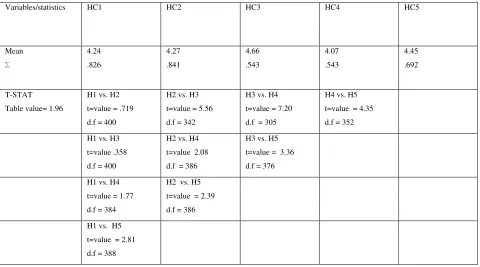
Variables/statistics HC1 HC2 HC3 HC4 HC5
Mean 4.24
.826
4.27
.841
4.66
.543
4.07
.543
4.45
.692
T-STAT
Table value= 1.96
H1 vs. H2
t=value = .719
d.f = 400
H2 vs. H3
t=value = 5.56
d.f = 342
H3 vs. H4
t=value = 7.20
d.f = 305
H4 vs. H5
t=value = 4.35
d.f = 352
H1 vs. H3
t=value .358
d.f = 400
H2 vs. H4
t=value 2.08
d.f = 386
H3 vs. H5
t=value = 3.36
d.f = 376
H1 vs. H4
t=value = 1.77
d.f = 384
H2 vs. H5
t=value = 2.39
d.f = 386
H1 vs. H5
t=value = 2.81
d.f = 388
Explanation:
In Table 2, the disparity between the sub-constituents of human capital namely HC1 (Employees understanding of target market), HC2 (consistent best performance of employees), HC3
(Employee’s Competency), HC4 (Employee’s enthusiasm) and HC5 (Employee’s satisfaction) has been assessed using large sample T-Test. It has been found that besides HC1 vs. HC2, HC1vs. HC3, and HC1 vs. HC4, all manifest that there is apparent disparity among them.
Hence, the researcher accepts the hypothesis in case of HC1 vs. HC2, HC1vs. HC3, and HC1 vs. HC4 and rejects the hypothesis in case of HC1 vs. HC3, HC3 vs. HC4, HC4 vs. HC5, HC1vs. HC5, HC2 vs. HC4, HC3 vs. HC5, and HC2 vs. HC5 which affirms that besides belonging to the same factor (human capital), some sub-components have significant distinction between them (at 5% level of significance and t-critical value=1.96).
R C 8 3 .2 9 1 .1 1 R C 7 4 .3 5 .8 1 7 R 7 v s. R 8 T -t es t= 7 .1 3 d .f . 3 8 7 R C 6 4 .3 1 .7 3 8 R 6 v s. R 7 T -t es t= 1 .4 3 d .f . 3 9 7 R 6 v s. R 8 T -t es t= 8 .6 6 d .f . 3 7 4 R C 5 4 .1 3 .8 5 6 R 5 v s. R 6 T -t es t= -4 .2 5 d .f . 3 7 4 R 5 v s. R 7 T -t es t= -2 .8 6 d .f . 3 8 7 R 5 v s. R 8 T -t es t= 3 .9 3 d .f . 4 0 0 R C 4 4 .5 7 .5 3 5 R 4 v s. R 5 T -t es t= 3 .7 5 d .f . 3 9 0 R 4 v s. R 6 T -t es t= -.3 6 d .f . 3 9 6 R 4 v s. R 7 T -t es t= 1 .0 0 d .f . 4 0 0 R 4 v s. R 8 T -t es t= 3 .9 8 d .f . 3 9 0 R C 3 4 .3 4 .7 4 5 R 3 v s. R 4 T -t es t= 3 .8 5 d .f . 3 6 0 R 3 v s. R 5 T -t es t= 7 .6 6 d .f . 3 2 8 R 3 v s. R 6 T -t es t= 3 .6 9 d .f . 3 7 9 R 3 v s. R 7 T -t es t= 5 .0 7 d .f . 3 6 4 R 3 v s. R 8 T -t es t= 1 2 .4 2 d .f . 3 2 7 R C 2 4 .2 9 .7 5 4 R 2 v s. R 3 T -t es t= -1 .1 6 d .f . 3 9 4 R 2 v s. R 4 T -t es t= 2 .7 1 d .f . 3 8 1 R 2 v s. R 5 T -t es t= 6 .5 2 d .f . 3 5 2 R 2 v s. R 6 T -t es t= 2 .4 8 d .f . R 2 v s. R 7 T -t es t= 3 .8 6 d .f . 3 8 4 R 2 v s. R 8 T -t es t= 1 1 .1 2 d .f . 3 5 1 R C 1 4 .1 2 1 .0 2 0 R 1 v s. R 2 T -t es t= -2 .5 1 d .f . 3 9 2 R 1 v s. R 3 T -t es t= 3 .7 1 d .f . 3 7 5 R 1 v s. R 4 T -t es t= .3 0 d .f . 3 9 7 R 1 v s. R 5 T -t es t= 4 .1 5 d .f . 3 7 8 R 1 v s. R 6 T -t es t= -.0 6 d .f . 4 0 0 R 1 v s. R 7 T -t es t= -1 .4 3 d .f . 3 9 7 R 1 v s. R 8 T -t es t= 7 .1 3 d .f . 3 8 7 V ar ia b le s/ st at M ea n s .d T - S T A T T ab le v al u e= 1 .9 6 Explanation:
researcher found that RC1 v/ s RC4, RC1 vs. RC6, RC1 v/ sRC7 and RC2 vs. RC3 shows apparent or significant distinction among them.
Hence, researcher accepts the Null hypothesis in case of RC1 v/ s RC4, RC1 vs. RC6, RC1 v/ sRC7, RC4 vs. RC6, RC4 vs. RC7, RC6 vs. RC7 and RC2 vs. RC3 and rejects in case of RC1
vs. RC2, RC1vs. RC3, RC1 vs. RC4, RC1 vs. RC8, RC2vs. RC4, RC2 vs. RC5, RC2 vs. RC6,RC2 vs. RC7 , RC2 vs. RC8, RC3 vs. RC4, RC3 vs. RC5, RC3 vs. RC6, RC3 vs. RC7, RC3 vs. RC8, RC4 vs. RC5, , RC4 vs. RC8, RC5 vs. RC6,RC5 vs. RC7, RC5 vs. RC6, RC6 vs. RC8, RC7 vs. RC8, which affirms that besides belonging to the same factor (Relational Capital), most of the sub-constituents have significant distinction between them (at 5% level of significance and t-critical value=1.96).
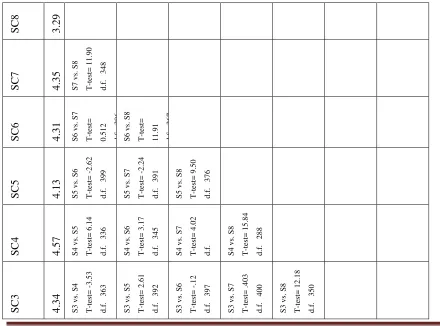
Table 4: INTRA CONSTITUENT ANALYSIS: STRUCTURAL CAPITAL
S C 2 4 .2 9 S 2 v s. S 3 T -t es t= -. 5 9 d .f . 4 0 0 S 2 v s. S 4 T -t es t= -4 .1 9 d .f . 3 6 1 S 2 v s. S 5 T -t es t= 2 .0 4 d .f . 3 9 7 S 2 v / S 6 T -t es t= -.6 9 7 d .f . 3 9 7 S 2 v s. S 7 T -t es t= -.2 0 d .f . 4 0 0 S 2 v s. S 8 T -t es t= 1 1 .6 6 d .f . 3 5 2 S C 1 4 .1 2 S 1 v s. S 2 T -t es t= 1 .8 9 d .f . 3 6 8 S 1 v s. S 3 T -t es t= 2 .4 d .f . 3 6 6 S 1 v s. S 4 T -t es t= -5 .4 5 d .f . 3 6 3 S 1 v s. S 5 T -t es t= . 0 5 2 d .f . 3 8 8 S 1 v s. S 6 T -t es t= 2 .4 2 d .f . 3 8 2 S 1 v s. S 7 T -t es t= -2 .0 7 d .f . 3 6 4 S 1 v s. S 8 T -t es t= 8 .7 9 d .f . 3 9 7 V ar ia b le s/ st at is ti cs M ea n T - S T A T T ab le v al u e 1 .9 6 Explanation:
Table 4, evaluation of relationship between the sub-constituents of structural capital namely SC1 (Software exuberance), SC2 (Research and Development), SC3 (Adaptability of new ideas), SC4 (Information System), SC5 (Grievance Redressal machinery), SC6 (Database), SC7 (Coordination), and SC8 (Organisational structure) has been ascertained using T-Test. Researcher found that besides SC1 v/ s SC2, SC1 vs. SC5, SC2 v/ SC3, SC2 vs. SC6, SC2 vs. SC7, SC3 vs. SC6, SC6 vs. SC7, and SC3 vs. SC7, all showed noteworthy or significant distinction between them.
Hence, the researcher accepts the Null hypothesis in case of SC1 v/ s SC2, SC1 vs. SC5, SC2 v/ SC3, SC2 vs. SC6, SC2 vs. SC7, SC3 vs. SC6, SC6 vs. SC7, and SC3 vs. SC7 and rejects in case SC1 v/ s SC3, SC1 vs. SC4, SC1 vs. SC6, SC1 vs. SC7, SC1 vs. SC8, SC2 vs. SC4, SC2 vs. SC5, SC2 vs. SC6 , SC2 vs. SC8, SC3 vs. SC4, SC3 vs. SC5, SC3 vs. SC8, SC4 vs. SC5, SC4 vs. SC6, SC4 vs. SC7, SC4 vs. SC8, SC5 vs. SC6,SC5 vs. SC7, SC5 vs. SC6, SC6 vs. SC8, SC7 vs. SC8, which affirms that besides belonging to same factor (Structural Capital), most of the
Table 5: INTRA CONSTITUENT ANALYSIS: ORGANISATIONAL CULTURE AND VALUE SYSTEM CAPITAL
O C 1 2 3 .0 5 1 .1 3 9 O C 1 1 4 .3 0 .8 1 3 O C 1 1 v s. O C 1 2 T -t es t= 1 2 .6 5 d .f . 3 6 2 O C 1 0 4 .3 1 .8 0 9 O C 1 0 v s. O C 1 1 T -t es t= . 1 2 3 d .f . 4 0 0 O C 1 0 v s. O C 1 2 T -t es t= 1 2 .7 7 d .f . 3 6 1 O C 9 3 .3 9 1 .1 2 2 O C 9 v s. O C 1 0 T -t es t= -9 .3 8 d .f . 3 6 4 O C 9 v s. O C 1 1 T -t es t= -9 .2 6 d .f . 3 6 4 O C 9 v s. O C 1 0 T -t es t= 3 .0 4 d .f . 4 0 0 z O C 8 2 .5 1 .9 6 0 O C 8 v s. O C 9 T -t es t= -8 .4 5 d .f . 3 9 1 O C 8 v s. O C 1 0 T -t es t= 2 0 .2 8 d .f . 3 8 9 O C 8 v s. O C 1 1 T -t es t= -2 0 .1 3 d .f . 3 8 9 O C 8 v s. O C 1 2 T -t es t= -5 .1 1 d .f . 3 8 9 O C 7 3 .9 9 .9 0 8 O C 7 v s. O C 8 T -t es t= 1 5 .8 0 d .f . 3 9 9 O C 7 v s. O C 9 T -t es t= 5 .8 1 d .f . 3 8 3 O C 7 v s. O C 1 0 T -t es t= -3 .7 6 d .f . 3 9 5 O C 7 v s. O C 1 1 T -t es t= -3 .6 4 d .f . 3 9 5 O C 7 v s. O C 1 2 T -t es t= 9 .1 0 d .f . 3 8 1 O C 6 3 .1 7 1 .1 6 8 O C 6 v s. O C 7 T -t es t= -7 .7 7 d .f . 3 7 7 O C 6 v s. O C 8 T -t es t= 6 .2 0 d .f . 3 8 5 O C 6 v s. O C 9 T -t es t= -1 .9 1 d .f . 3 9 9 O C 6 v s. O C 1 0 T -t es t= -1 1 .2 0 d .f . 3 5 7 O C 6 v s. O C 1 1 T -t es t= -1 1 .2 0 d .f . 3 5 7 O C 6 v s. O C 1 2 T -t es t= 1 .0 8 d .f . 4 0 0 O C 5 4 .4 7 .7 3 5 O C 5 v s. O C 6 T -t es t= 1 3 .2 8 d .f . 3 3 7 O C 5 v s. O C 7 T -t es t= 5 .8 5 d .f . 3 8 3 O C 5 v s. O C 8 T -t es t= 2 2 .9 3 d .f . 3 7 5 O C 5 v s. O C 9 T -t es t= 1 1 .3 5 d .f . 3 4 5 O C 5 v s. O C 1 0 T -t es t= 2 .0 6 d .f . 3 9 6 O C 5 v s. O C 1
1 T-tes
t= 2 .1 8 d .f . 3 9 6 O C 5 v s. O C 1
2 T-tes
t= 1 4 .8 2 d .f . 3 4 2 O C 4 4 .3 4 .8 1 6 O C 4 v s. O C 5 T -t es t= 1 .6 0 5 d .f . 3 9 6 O C 4 v s. O C 6 T -t es t= 1 1 .6 3 d .f . 3 5 8 O C 4 v s. O C 7 T -t es t= 4 .1 5 d .f . 3 9 6 O C 4 v s. O C 8 T -t es t= 2 0 .6 0 d .f . 3 9 0 O C 4 v s. O C 9 T -t es t= 9 .7 0 d .f . 3 6 5 O C 4 v s. O C 1 0 T -t es t= .4 2 9 d .f . 4 0 0 O C 4 v s. O C 1 1 T -t es t= . 5 5 1 d .f . 4 0 0 O C 4 v s. O C 1 2 T -t es t= 1 3 .0 8 d .f . 3 6 3 O C 3 4 .2 6 .8 8 0 O C 3 v s. O C 4 T -t es t= -.9 3 9 d .f . 3 9 8 O C 3 v s. O C 5 T -t es t= -2 .5 2 d .f . 3 8 8 O C 3 v s. O C 6 T -t es t= 1 0 .5 6 d .f . 3 7 2 O C 3 v s. O C 7 T -t es t= 3 .1 2 d .f . 4 0 0 O C 3 v s. O C 8 T -t es t= 1 9 .0 6 d .f . 3 9 7 O C 3 v s. O C 9 T -t es t= 8 .6 5 d .f . 3 7 9 O C 3 v s. O C 1
0 T-tes
V
ar
ia
b
le
s/
st
a
ti
st
ic
s
M
ea
n
s.
d
T
-s
ta
t
T
ab
le
V
al
u
e
=
1
.9
6
Explanation:
Table 5, evaluation of relationship between the sub-constituents of organisational culture and value system capital namely OC1 (Provision of succession training programme for employees), OC2 (Recognition to employees efforts), OC3 (Up gradation of skill and knowledge when they require), OC4 (Comprehensive recruitment policy and dedicated towards hiring the best candidate), OC5 (Preparedness towards sudden discontinuance of service from employee’s side ), OC6 (Quality of service), OC7 (Foster development and maintenance of internal relationship), OC8 (dissemination of data pertaining to customer’s feedback), OC9 (Receptiveness towards employees innovative ideas), OC10 (Supportive and conducive atmosphere), OC11(Continuous on schedule with new ideas), and OC12 (Prevalence of fraternity values) has been assessed using T-Test. The researcher found that except OC1 vs. OC6, OC1 vs. OC9, OC1 vs. OC12, OC2 vs. OC7, OC3 vs. OC4, OC3 vs. OC10, OC1 vs. OC11, OC4 vs. OC10, OC4 vs. OC11, OC6 vs. OC9, OC6 vs. OC12, and OC10 vs. OC11, all showed noteworthy or significant difference among them.
Hence, the researcher accepts the Null hypothesis in case of OC1 vs. OC6, OC1 vs. OC9, OC1 vs. OC12, OC2 vs. OC7,OC3 vs. OC4,OC3 vs. OC10, OC1 vs. OC11, OC4 vs. OC10, OC4 vs. OC11, OC6 vs. OC9, OC6 vs. OC12, and OC10 vs. OC11and rejects in case of OC1 vs. OC2, OC1 vs. OC3, OC1 vs. OC4, OC1 vs. OC5, OC1 vs. OC7, OC1 vs. OC8, OC1 vs. OC10, OC1 vs. OC11, OC2 vs. OC3, OC2 vs. OC4, OC2 vs. OC5, OC2 vs. OC6,OC2 vs. OC8,OC2 vs.
0C12, OC10 vs. OC12, and OC11 vs. OC12 which affirms that besides related to the same factor (Organisational culture and value system Capital), most of the sub-constituents have significant distinction between them (at 5% level of significance and t-critical value=1.96).
CONCLUDING REMARKS
In macro analysis, it has been found that there is no momentous distinction between components
of Intellectual Capital, namely human capital, structural capital, relational capital, and organisational culture and value system capital (evaluated through t-test at 5% level of significance). This shows that both belongs to the same family and has no internal distinctness in them. In upshot, the researcher affirms that all are momentous components of Intellectual Capital.
In intra-factor analysis, it has been found that most of the sub-constituents enjoy great disparity between them. Despite belonging to the same family, their nature is different.
REFERENCES
1. Andriessen, D. (2001), “Weightless wealth: four modifications to standard IC theory”, Journal of Intellectual Capital, Vol. 2, pp. 204-214.
2. Bontis, N. (1996), “There’s a Price on your Head: Managing Intellectual Capital Strategically”, Business Quarterly, summer, pp. 40-47.
3. Bontis, N. (1998), “Intellectual capital: An exploratory study that develops measures and model”, Management Decision, Vol. 36, No. 2, pp. 63-76.
4. Bontis, N. (2001), “Assessing knowledge assets: a review of the models used to measure intellectual capital”, International Journal of Management Reviews, Vol. 3 No. 1, pp. 41-60.
6. Brooking, A. (1996), “Intellectual Capital: Core Asset for the Third Millennium Enterprise”, London: International Thomson Business Press.
7. Edvinsson, L. and Malone, M. S. (1997), “Intellectual Capital: Realizing Your Company’s True Value by Finding Its Hidden Brainpower”, Harper Business, New York.
8. Galbraith, J. K. (1969), “The New Industrial State: Harmondsworth”, Penguin.
9. Guilding, C., Pike, R. (1990), “Intangible Marketing Assets: A Managerial Accounting Perspective”, Accounting and Business Research, Vol. 21, No. 18, pp. 41-49.
10.IFAC (1998), “Measurement and Management of Intellectual Capital”, IFAC.
11.Leliaert, P. J. C., Candries, W. and Tilmans, R. (2003), “Identifying and managing IC: a new classification”, Journal of Intellectual Capital, Vol. 4, No. 2, pp. 202-214.
12.Mortensen, J. Eustace, C., Lannoo, K. (1997), “Intangibles in the European Economy”, Paper presented at the CEPS workshop on intangibles in the European economy, Brussels 13.Roos, J., Roos, G., Dragonetti, N.C. and Edvinsson, L. (1997), “Intellectual Capital:
Navigating in the New Business Landscape”, London: Macmillan.
14.Stewart, T.A. (1997), “Intellectual Capital: The New Wealth of Organizations”, Doubleday/Currency, New York, NY.