* Corresponding author: [email protected]
Flow behaviour and structure of heterogeneous particles-water
mixture in horizontal and inclined pipes
Pavel Vlasák1*, ZdeněkChára1, JiříKonfršt1
Institute of Hydrodynamics CAS, v. v. i., 166 12 Prague 6, Czech Republic
Abstract. The effect of slurry velocity and mean concentration of heterogeneous particle-water mixture on flow behaviour and structure in the turbulent regime was studied in horizontal and inclined pipe sections of inner diameter D = 100 mm. The stratified flow pattern of heterogeneous particle-water mixture in the inclined pipe sections was revealed. The particles moved mostly near to the pipe invert. Concentration distribution in ascending and descending vertical pipe sections confirmed the effect of fall velocity on particle-carrier liquid slip velocity and increase of in situ concentration in the ascending pipe section. Slip velocity in two-phase flow, which is defined as the velocity difference between the solid and liquid phase, is one of mechanism of particle movement in two-phase flow. Due to the slip velocity, there is difference between transport and in situ concentrations, and the slip velocity can be determined from comparison of the in situ and transport concentration. For heterogeneous particle-water mixture flow the slip velocity depends on the flow structure.
1 Introduction
Hydraulic pipeline transport is commonly used for transport of different loose (granular, powdery) materials, e.g. in dredging, building, mining, or land reclamation [1]. A lot of theoretical or experimental studies have been carried out on transport of sand or fine particles in horizontal pipes [2, 3]. However, a relatively little research has been done on hydraulic conveying in vertical and inclined pipes, especially of coarse particles as gravel or pebbles.
From operational point of view transport concentration, operational velocity and pressure drops are the most important parameters for pipeline transport design and operation. The particles in the turbulent flow are supported by turbulent diffusion, and near the pipe wall a lift force, associated with slip velocity and concentration profile, contributed to the particle lift-off, too. For the particles with size larger than the thickness of viscous sub-layer, Saffman force, induced due to the shear of the fluid, supports particle movement and together with Magnus force (due to the particle rotation) [4] could reach a significant fraction of the total weight of particles [5].
Based on macroscopic modelling, where the conservation equations are formulated using averaged quantities over the control volume, Wilson [6] proposed a two-layer model for heterogeneous slurries with a fully stratified flow pattern. Heterogeneous mixture flow in a pipe may be defined as the flow with an asymmetrical velocity and concentration distribution. When the Reynolds number, friction factor and Coulomb type friction are defined for each layer as well as the interfacial friction factor, the flow parameters could be determined [7]. Because the layers differ in the local
solids concentration and velocity, there is a difference in the mean velocities of the particles and the liquid. Slip between the particles and the liquid results in a continuous transfer of energy from the fluid to the particle and from the particle to the pipe wall [8].
Friction losses in pipeline flow of heterogeneous solid particle-water mixtures are strongly dependent on the flow pattern [9]. If the operational velocity of the mixture is close to deposition limit, a granular bed forms at the pipe invert. The bed slide over the pipe invert at velocities above the deposition limit and it is stationary below the deposition limit. The contact bed is important contributor to solid friction in mixture flow.
2 Experimental equipment and material
The experimental investigation was carried out on the
pipe loop of inner diameter D = 100 mm with horizontal
(A) and inclinable (B) pipe sections, see Figure 1. The total length of the loop is 93 m, the loop is suitable for studying of mixture velocity and concentration effect on the mixture flow behaviour, concentration distribution and pressure drop.
The measured solid-liquid mixture was prepared in a mixing tank (1) and pumped by a centrifugal slurry pump GIW LCC-M 80-300 (2) with variable speed drive Siemens 1LG4283-2AB60-Z A11 (3) to a measurement section of transport pipe. Transparent viewing pipe sections (7) for visual observation were situated on the end of the horizontal pipe section (A) and in the
inclinable section (B). The transparent viewing pipe
Fig. 1. Experimental test loop D = 100 mm (IH AS CR) A – horizontal section, B – inclinable section, C – short vertical
section; 1 – mixing tank, 2 – centrifugal dredge pump, 3 – electric motor, 4 – slide valves, 5 – pycnometer, 6 – slurry output tank, 7 – transparent viewing pipe section , 8 – differential pressure transducer, 9 – electromagnetic flow meter,
10 – radiometric devices, 11 – flow divider, 12 – flexible hose.
The pressure drops were measured by the Rosemount DP transmitters 1151DP (8) in the horizontal and inclined measuring sections within a broad range of mean mixture velocities, from values close to the
deposition limit velocity (Vdl ≈1 m/s), to maximum
values Vmax≈ 4.0/s.
Slurry mean velocities were measuredby a Krohne
OPTIFLUX 5000 magnetic flow meter (9), mounted in the short vertical section (C) at the end of the circuit. The flow divider (11) allows collection of slurry samples in the calibrated sampling tank (5) and measuring of the delivered concentration, cv, and the flow rate Q. The vertical U-tube (B) enables evaluating the delivered concentration of solid phase.
To measure local concentration and concentration profiles the loop is equipped with radiometric density meters (10) placed on a special support controlled by the computer [10]. The support serves for vertical linear positioning of both the source and the detector to measure chord averaged vertical concentration profiles.
To determine local concentration distribution through the pipe cross-section (the concentration maps) the
parallel projections of γ-ray beam were provided at
several angles around the pipe axis (i.e. step of 15° from
zero to 165°), and the collected data were processed by
computer tomography method.
The radiometric density meters consist of a γ-ray
source (Caesium137Cs, activity 740 MBq) and of a
detector (a scintillating crystal of NaI(Tl)). A multi-channel digital analyser enables an evaluation of the energy spectrum of the detected signal. The measuring time period of 16 seconds was used to sense the local concentration at each position [11].
The radiometric device was mounted upstream of the measuring and viewing sections in the horizontal or inclinable sections of the loop.
The studied solid-liquid mixtures consist of basalt
pebbles (particle diameter, d, ranging from 8 to 16 mm,
the mean diameter d50≈ 11.5 mm, particle density ρp = 2
895 kg m-3) and water, the overall volumetric
concentration, cv, ranged from 3 to 15%.
3 Slip velocity
Slip velocity in two-phase flow is defined as the velocity difference between the solid and liquid phase. It is one of mechanism of particle movement in two-phase flow. In the homogeneous model of two-phase flow the slip velocity Vsl is by definition assumed to be close to zero (no slip). For heterogeneous slurry flow it was experimentally observed that the slip velocity depends on the flow pattern (e.g. suspended flow, stratified flow, slug flow). Due to slip velocity, there is difference between delivery (transport cd) and spatial (in situ cv) concentrations, and the slip ratio (cd / cv= Vsl /Vs) is the parameter describing flow stratification in a pipe. In vertical two-phase flow the slip velocity can be approximated by hindered settling velocity. The slip-velocity will be determined from comparison of the mean in situ and mean transport concentration.
Effect of mean mixture velocity Vs and pipe
inclination angle α on values of slip ratio in the
horizontal, vertical, and inclined ascending (Vsl,a /Vs) and descending (Vsl,d /Vs) pipe sections, determined from the measured mixture transport and in-situ concentrations is
indicated in Table 1 for mean mixture velocity about Vs
= 2.85 m/s and in Table 2 for mean mixture velocity
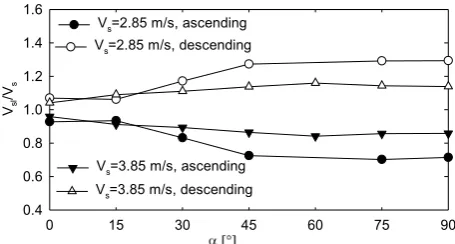
about Vs= 3.85m/s and transport concentration cd ≈ 0.06. From Figure 2 it is evident that value of the slip ratio
increases with the inclination angle α and with
decreasing flow velocity Vs. The slip ratio is practically constant for inclination angle in range 0 -15° and 45-90°.
0 15 30 45 60 75 90
Vsl /Vs
0.4 0.6 0.8 1.0 1.2 1.4 1.6
Vs=2.85 m/s, ascending
Vs=2.85 m/s, descending
Vs=3.85 m/s, ascending Vs=3.85 m/s, descending
Fig. 2. Effect of pipe inclination angle α on slip ratio Vsl /Vs.
Table 1. Effect of the pipe inclination angle α on slip ratio in ascending Vsl,a /Vs, and descending Vsl,d /Vs pipe sections.
Vs= 2.85 [m/s]
α [°] cd cv, a cv, d Vsl,a /Vs Vsl,d /Vs 0° 0,0385 0,0360 0,0415 1,06944 0,92771 15° 0,0397 0,0425 0,0374 0,93412 1,06150 30° 0,039 0,0469 0,0333 0,83156 1,17117 45° 0,0392 0,0541 0,0308 0,72458 1,27273 75° 0,0372 0,0530 0,0288 0,70189 1,29167 90° 0,0370 0,0518 0,0286 0,71429 1,29371
in vertical flow the differences between slip ratios Vslip /
Vs in ascending and in descending pipe sections
decreases with increasing flow velocity Vs. These slip
ratios are nearly symmetrical to line Vslip / Vs = 1. The values of the slip ratio in horizontal and ascending vertical flow are very similar.
Table 2. Effect of pipe inclination angle α on slip ratio in ascending Vsl,a /Vs, and descending Vsl,d /Vs pipe sections.
Vs= 3.85 [m/s]
α [°] cd cv, a cv, d Vsl,a /Vs Vsl,d /Vs 0 0,06110 0,0637 0,0587 0,9592 1,0409 15 0,06410 0,0703 0,0588 0,9118 1,0901 30 0,06050 0,0677 0,0545 0,8936 1,1101 45 0,05470 0,0633 0,0481 0,8641 1,1372 60 0,05380 0,0639 0,0464 0,8419 1,1595 75 0,05065 0,0591 0,0443 0,8570 1,1433 90 0,05330 0,0621 0,0468 0,8580 1,1390
Vs [m/s]
1.5 2.0 2.5 3.0 3.5 4.0
Vslip /Vs
0.6 0.8 1.0 1.2 1.4 1.6 1.8 2.0
horizontal ascending descending
Fig. 3. Slip ratio Vslip /Vs in horizontal and vertical pipe
sections.
4 Local concentration distribution
Distribution of the local concentration in the pipe
cross-section has a great effect on both the mixture’s flow
behaviour and pressure drop and it is important for understanding the mechanism of the heterogeneous mixture flow. Various methods have been used for measurement of the local concentration, e.g. isokinetic sampling, different visualization techniques, electrical resistance and capacity, or radiometric methods [5, 6, 12-19].
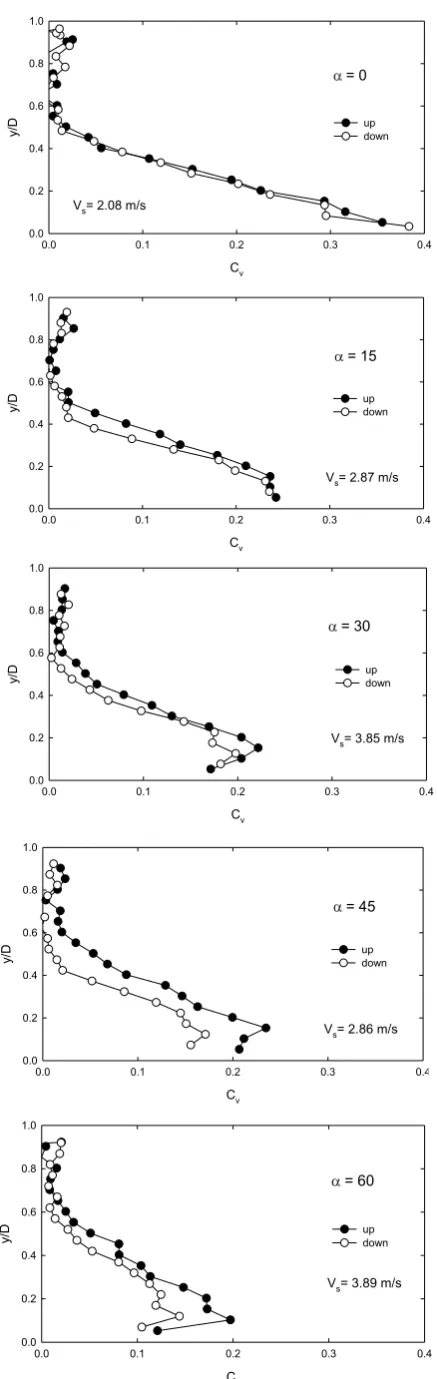
The effect of different flow parameters on the local concentration distribution in chord-averaged vertical concentration profiles in pipe sections, e.g. the pipe inclination and the mixture velocity Vs was studied for three values of the transport concentration and three mixture flow velocities. The measured concentration profiles confirmed the stratified flow pattern of the coarse particle-water mixture in the inclined pipe sections, see Figure 4. The chord-averaged concentration profiles can be divided into three parts similarly as in the chord-averged horizontal pipe sections [20-21].
Cv
0.0 0.1 0.2 0.3 0.4
y/D
0.0 0.2 0.4 0.6 0.8
up down
= 0
Vs= 2.08 m/s
Cv
0.0 0.1 0.2 0.3 0.4
y/D
0.0 0.2 0.4 0.6 0.8 1.0
up down = 15
Vs= 2.87 m/s
Cv
0.0 0.1 0.2 0.3 0.4
y/D
0.0 0.2 0.4 0.6 0.8 1.0
up down
= 30
Vs= 3.85 m/s
Cv
0.0 0.1 0.2 0.3 0.4
y/D
0.0 0.2 0.4 0.6 0.8 1.0
up down
= 45
Vs= 2.86 m/s
Cv
0.0 0.1 0.2 0.3 0.4
y/D
0.0 0.2 0.4 0.6 0.8 1.0
up down
= 60
Cv
0.0 0.1 0.2 0.3 0.4
y/D
0.0 0.2 0.4 0.6 0.8 1.0
up down
= 75
Vs= 3.87 m/s
Cv
0.00 0.05 0.10 0.15 0.20
y/D
0.0 0.2 0.4 0.6 0.8 1.0
up down
= 90
Vs= 3.82 m/s
Fig. 4. Effect of the inclination angle and the mean mixture velocity Vs on profiles of local concentration cv
(transport concentration cd ≈ 0.06).
The local concentration cvapproaches practically zero in the upper portion of the pipe, this region increases for
the descending flow with decreasing mixture velocity Vs
and mean transport concentration cd. A nearly linear
concentration distribution was determined in the central portion of the concentration profiles.
Solids concentration reached maximum near the pipe invert, and for the higher mixture velocity a thin layer with nearly constant local concentration formed. However, for studied conditions the bed concentration in inclined pipe sections never reached values close to the loose-packed value. It demonstrates the permanent movement of bed particles along the bed of the pipe (sliding, rolling or saltation mode) for given flow condition (i.e. for velocities higher than the deposition limit).
Similarly as it was confirmed for pressure drop, the effect of pipe inclination for low values of angle (up to
about 30°) is not significant, see Figure 5, especially in
the upper and central portions of the pipe [8, 10]. Local concentration cv at the pipe invert slightly decreased with the increasing pipe inclination. For higher values of
angle , a decrease in concentration close to the pipe
invert was observed; the local concentration in the central portion of the pipe increased and for the vertical pipe a nearly constant concentration distribution was observed. The local concentration in the bed layer decreased with increasing velocity and with increasing
inclination angle . No maximum of local concentration
was observed for descending flow direction and the inclination angle = 15°, concentration profiles were
nearly linear in the lower portion of the pipe. The effect of inclination was similar for both higher mixture
velocities, for low mixture velocity (Vs = 2.05 m/s) a bed layer was observed.
Cv
0.0 0.1 0.2 0.3
y/D
0.0 0.2 0.4 0.6 0.8 1.0 1.2
= 0o
= 15o, up
= 30o, up
cd= 9%
Vs= 2.85 m/s
Cv
0.0 0.1 0.2 0.3
y/D
0.0 0.2 0.4 0.6 0.8 1.0 1.2
= 90o, up = 45o, up = 0o
cd= 9% Vs= 2.85 m/s
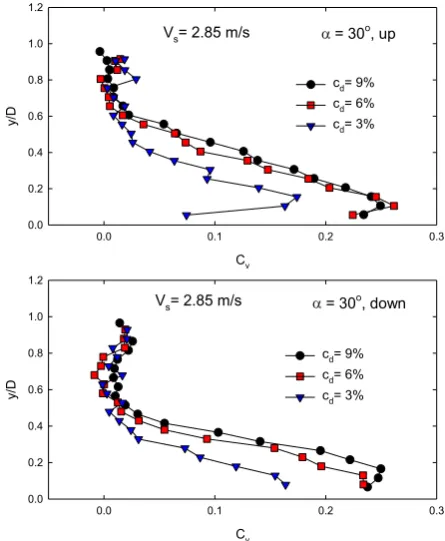
Fig. 5. Effect of the inclination angle on local concentration cv. The effect of the mean transport concentration cd for the inclination angle = 30° and the mixture velocity Vs
= 2.85 m s-1, is illustrated on Figure 6, both for the
ascending and descending flow directions.
Cv
0.0 0.1 0.2 0.3
y/D
0.0 0.2 0.4 0.6 0.8 1.0 1.2
cd= 9%
cd= 6% cd= 3% = 30o, up Vs= 2.85 m/s
Cv
0.0 0.1 0.2 0.3
y/D
0.0 0.2 0.4 0.6 0.8 1.0 1.2
cd= 9% cd= 6% cd= 3%
= 30o, down Vs= 2.85 m/s
Fig. 6. Effect of the transport concentration cd on local
With the increasing mean transport concentration the local concentration in the bed layer, as well as in central proportion of the pipe increased, and in ascending flow direction the bed layer was distinct even for low
concentration value. For the descending flow direction
concentration profiles are nearly linear in the lower portion of the pipe, and the zero concentration part of the pipe cross-section is significantly bigger than that for the ascending flow direction due to the braking effect of gravity force on ascending flow and accelerating effect of gravity force on descending flow [22]. The positive and negative effect of gravity decreases and increases, respectively, the particle-liquid slip velocity.
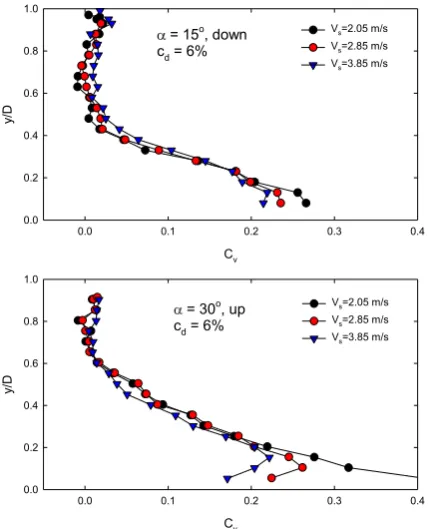
The same was observed from Figure 7, which illustrated the effect of mean mixture velocity Vs for low
values of the pipe inclination angle =15° and 30°. For
moderate and higher mixture velocities bed layers with thickness of about 20% of the pipe diameter were formed. The local concentration in the bed layer decreased with increasing velocity; probably due to increasing saltation intensity more particles reach higher portion of the pipe. This effect increased with increasing inclination angle.
Cv
0.0 0.1 0.2 0.3 0.4
y/D
0.0 0.2 0.4 0.6 0.8 1.0
Vs=2.05 m/s Vs=2.85 m/s Vs=3.85 m/s = 15o, down
cd = 6%
Cv
0.0 0.1 0.2 0.3 0.4
y/D
0.0 0.2 0.4 0.6 0.8 1.0
Vs=2.05 m/s Vs=2.85 m/s Vs=3.85 m/s = 30o, up
cd = 6%
Fig. 7. Effect of the mean mixture velocity Vs on local
concentration cv.
The effect ofthe ascending and descending flow is
clearly illustrated in Figure 8, for the low and high
mixture velocities (Vs = 2.05 and 3.85 m/s), and wide
range of the inclination angle , from 15° to 90°. The
local in situ concentration in ascending pipe sections is due to the effect of particle fall velocity always higher than that in descending pipe sections. Solid particles move in the ascending section with lower velocity than in the descending section, of course the transport concentration is constant over the whole pipe loop. It is valid also for vertical up-ward and down-ward flow,
where difference between the concentration values corresponds to particle slip velocity.
Cv
0.0 0.1 0.2 0.3 0.4
y/D
0.0 0.2 0.4 0.6 0.8 1.0
=15o, up
=15o, down
=45o, up
=45o, down
Vs= 2.05 m/s cd = 6%
Cv
0.0 0.1 0.2 0.3 0.4
y/D
0.0 0.2 0.4 0.6 0.8 1.0
=30o, up
=30o, down
=75o, up
=75o, down
=90o, up
=90o, down
Vs= 3.85 m/s cd = 6%
Fig. 8. Effect of the ascending and descending flow on local concentration cv
4 Conclusions
The coarse particles (basalt pebbles) – water mixtures flow behaviour was studied in horizontal and inclined
smooth pipe sections of inner diameter D = 100 mm. The
visualization and local concentration measurements revealed the stratified flow pattern of the coarse particle-water mixture in the inclined pipe sections.
Similarly to horizontal flow the chord averaged concentration profiles in the inclined pipe sections can be divided in three parts: a zero-concentration region in the upper portion of the pipe, a region with nearly linear concentration distribution in the central portion of the pipe, and a region with a maximum concentration near the pipe invert.
For velocities close to deposition limit dune formations or sliding bed were formed. For moderate and higher mixture velocities, particle saltation became the dominant mode of sediment transport.
The in situ concentration reached higher values in the ascending section than in the descending section, the particles moved mostly near to the pipe invert.
Value of slip ratio increases with the inclination angle and with decreasing flow velocity; the slip ratio is practically constant for the inclination angle in range 0
-15° and 45-90°.
For the inclination angle up to about 30°, the effect
increasing mean mixture velocity the local concentration in the bed layer slightly decreased; this effect increased with increasing inclination angle.
Acknowledgements
Supports under the project 17-14271S of the Grant Agency of the Czech Republic, and RVO: 67985874 of the Czech Academy of Sciences are gratefully acknowledged.
References
1. P. Vlasak, B. Kysela, Z. Chara, J. Hydrol.
Hydromech., 60, 115 (2012).
2. P. Vlasak, Z. Chara, Powder Technol, 104, 200
(1999).
3. P. Vlasak, Z. Chara, Part. Sci.Technol,, 27, 428
(2009).
4. N. Lukerchenko, Yu. Kvurt, I. Keita, Z. Chara, P.
Vlasak, Part. Sci.Technol,, 30, 55 (2012).
5. K.C. Wilson, R.S. Sanders, R.G. Gillies, C.A. Shook,
Powder Technol, 197, 247 (2010).
6. K.C. Wilson, Proc. HYDROTRANSPORT 4, Banff
(Canada), Paper A (1976).
7. K.C. Wilson, R.G. Addie, A. Sellgren, R. Clift,
Slurry Transport Using Centrifugal Pumps (Springer,US., 2006)
8. P. Vlasak, Z. Chara, J. Konfrst, J. Hydrol.
Hydromech. 65, 183 (2017).
9. V. Matousek, V., Experimental Thermal and Fluid
Science, 26, 693 (2002).
10.P. Vlasak, Z. Chara, J. Krupicka, J. Konfrst, J.
Hydrol. Hydromech. 62, 241 (2014).
11.J. Krupicka, V. Matousek, J. Hydrol. Hydromech.,
62, 126 (2014).
12.J. Dolanský, Z. Chara, P. Vlasak, B. Kysela, J.
Hydrol. Hydromech. 65, 105 (2017).
13.V. Matousek, P. Vlasak, Z. Chara, J. Konfrst,
Maritime Engineering, 168, 93 (2015).
14.K. Przewlocki, A. Michalik, K. Wolski, K. Korbel,
Proc. HYDROTRANSPORT 6, Canterbury (U.K.), 1,
105 (1979).
15.F.J. Pugh, K.C. Wilson, Powder Technol, 104, 221
(1999).
16.J. Sobota, F. Plewa, EJPAU 3(2), #01,
http://www.ejpau.media.pl/volume3/issue2/environm ent/art-01.html (2000)
17.J. Sobota, P. Vlasak, G. Strozik, F. Plewa, Proc.
Eighth ISOPE Ocean Mining (& Gas Hydrates) Symp., Chennai (India), 220 (2009).
18.P. Vlasak, B. Kysela, Z. Chara, Part. Sci.Technol, 32, 179 (2014).
19.M. Zych, R. Hanus, P. Vlasak, M. Jaszczurd, L.
Petryka,Powder Technol, 318, 491 (2017).
20.P. Vlasak, Z. Chara, J. Konfrst, J. Krupicka, EPJ
Web of Conferences92, 02111(2015)
21.P. Vlasak, Z. Chara, J. Konfrst, J. Krupicka, Can. J.
Chem Engng, 94, 1040 (2016).