High-resolution evaluation of the U5(n,f) cross
section from 3 keV to 30 keV
I. Duran1), C. Paradela,1,2), M. Caamaño1), P. Cabanelas 1), L. Tassan-Got3), L.
Audouin3), on behalf of the CERN - nTOF Collaboration
1) Universidad de Santiago de Compostela, 15782, Spain 2) EC-JRC-IRMM, Retieseweg 111, B-2440 Geel, Belgium 3) CNRS/IN2P3-Université Paris-Sud- IPN, Orsay,
Abstract.235U neutron-induced fission cross-section is commonly used as
reference for determining other isotope fission cross-section. However, below 150 keV this cross section is only included as Standard at the thermal point and recently its integral value between 7.8 eV and 11 eV [1]. The resolved resonance region, spanning up to 2.25 keV, has been re-evaluated with high resolution in the last ENDF/B-VIII release [2] and a SAMMY resonance analysis was done by L. Leal et al. [3] including the CERN-nTOF experimental work of Paradela el al. [4] up to 10 keV, taken into account the IAEA Reference file.
In this work the 235U(n,f) low-background and high-resolution
experimental data obtained at the CERN-nTOF facility is combined with previous high-resolution experimental data, in order to produce a very fine grid dataset with normalisation to the IAEA Reference file. The extremely-high energy calibration required to reproduce the resonance sharp profiles is based on the nTOF DAQ system with a resolution below 0.1% with reference to the 8.78 eV resonance and to the sharp Al(n,g) capture dip at 5.904 keV.
The comparison of the so-evaluated profile with the experimental data and with the evaluated ones will be discussed.
1 Introduction
Accurate data on the fission of heavy nuclei at energies beyond the resolved resonance region (RRR) are of a renewed interest for both fundamental and applied nuclear physics. Most neutron cross section measurements are made relative to the neutron cross section standards, being so the basis for measurements and evaluations. Very few cross sections can be measured absolutely and in most cases cross sections are measured relative to the standards or to the data files retrieved from the evaluated libraries. An important point is that the accuracy of a cross section is limited by the uncertainty in the reference cross section relative to which it is measured. There is so a need for additional data related to standard isotopes used as reference and the extension in energy range of certain cross sections, as remarked in Ref [1].
of JEFF (JEFF-3.3). Above 2.25 keV the current ENDF/B-VIII shows a coarse energy resolution, notwithstanding its integral mean values are in fine agreement with the point-wise dataset in the IAEA Reference file. JEFF-3.3 and JENDL-4.0, on the other hand, are giving only a smooth line.
235U(n,f) reaction has been amply measured and a bunch of entries can be retrieved at the EXFOR library, many of them consisting on single points, mean cross-section values in a broad energy interval or low energy resolution cross-section spectra. The aim of this work is to determine the shape of the 235U(n,f) cross section with an improved energy resolution, in the energy region of the Unresolved Resonance Region (URR) up to 30 keV. So that, after inspection of the EXFOR library some selected datasets have been retained arriving to the conclusion that, besides the CERN-nTOF-PPAC results, the dataset of Weston and Todd [5] is the one having the best compromise between statistics and energy resolution, even though its bad energy calibration.
In the RRR, below 2.25 keV, most of the resonances found are of Class I, having so its energy intervals increasingly closer. On the other hand, in the transition from the RRR to the URR, the resonance structures due to the coupling of Class II states to Class I ones become more and more probable, resulting in a too high density of barrier transition states that make it almost impossible to resolve (for a detailed explanation see Ref. [6] and references therein). Above 3 keV, nevertheless, the cross-section spectrum is dominated by the grouping of the observed cross section peaks, pointing to the existence of resonance structures that have been so far not well resolved.
2 Evaluation procedure
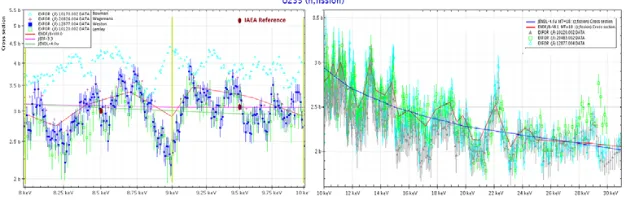
When looking for the best energy achievable from the experimental data sets, only a few can be retrieved having both high statistics and an energy resolution high enough, as otherwise is difficult discerning statistical artifacts from real resonances. To overcome these difficulties different datasets must be compared between them, but only after a careful energy re-calibration and a suited re-normalisation. In Fig 1 can be seen some results from
Fig. 1. 235U(n,f) experimental data from EXFOR. The ENDF/B-VIII. JENDL-3.2 and the IAEA
evaluations are also included.
EXFOR [5] and [7-12] for two energy ranges. In both panels can be perceived that an evident correlation exists, even though the scatter of the points due to not having a correct calibration. It is worth of mention the coarse miscalibration of the Bowman’s dataset [7] shown in the left panel (light blue).
in Refs. [13] and [14], and the data analysis is described in Refs [4] and [15 - 17]. We take advantage of the very high stability of both the neutron flux and the DAQ system timing that having a clock frequency of 2 GHz gets an energy resolution well below 0.1%, all along this energy range,
2.1 Data reduction and conditioning
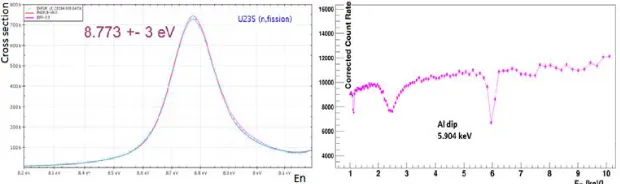
As above mentioned, there is in EXFOR many entries for the 235U(n,f) reaction measurements, but only a few having both high statistic and fine energy resolution. So that, this work is based in only those susceptible of passing a suited filter without loss of the required information. Every dataset was managed to have around 2000 bin/decade in order to cope with the extremely-high energy calibration required to reproduce the resonance sharp profiles. Then a triangular Barlett filter was applied in order to reduce the statistical scatter without reducing the binning. The nTOF energy calibration has been taken as reference with reference to the 235U(n,f) 8.775(3) eV resonance and to the sharp Al(n,g) capture dip at 5.904(5) keV. In Fig 2 (left) is shown the nTOF data (in blue) matching the ENDF/B-VIII evaluation and in the right plot is the dip produced by the capture and by the
Fig. 2.235U(n,f) peak at 8.773 eV and Al(n,tot) dip at 5.904 keV used as time references in this work.
from an experiment performed at CERN-nTOF using a FIC detector has been used too, as it can be taken as an independent experiment. The analysis of this experiment [18] is not yet finished but it shows a very high energy resolution and has been useful to prove the existence of some doubtful peaks. So that, every peak introduced in the USC-Eval file required to be present in at least two different experiments and having some trace in others. It is worth to mention that, after the correct calibration of all the datasets, the grade of coincidence has been surprisingly high, as it will be shown in the next section.
Finally, the whole USC-Eval dataset was normalised in order to fit with the point-wise values recommended by the IAEA Reference file [19]. This result is shown in Table 2, at the end of the text, compared with the recent evaluations.
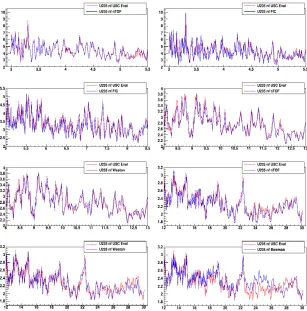
Fig. 3. Comparison of the USC-Eval with experimental datasets at different energy intervals.
3 Results
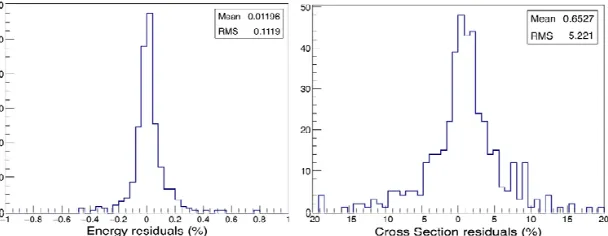
are in a fair agreement with the GMA nodes used by the IAEA for the Reference files. In Fig.3 are shown some plots comparing the result of our evaluation with the experimental data at different energy intervals. In Fig 4 are summarised the statistics of such a comparison for the four experimental datasets: namely: nTOF-PPACs, nTOF-FIC, Weston and Bowman. In the left panel is the histogram of the energy residuals, showing that after the energy re-calibration the dispersion of the energy at the resonance peaks is 0.11% which is compatible with the energy resolution of each individual setup. In the right is the histogram with the residual of the cross-section values at the peaks with a RMS dispersion of 5.2% with maximum values of 20%. As the evaluated values are a compromise between the experimental ones, the differences from experiments to evaluation are lower than the differences between experiments. It must be noted that this differences arose because most resonances have a very narrow peak, depending so its apparent height on the energy binning.
Fig. 4. Statistics of the energy and cross section values of the resonance peaks, taken as the differences between evaluation and experiments in percent.
3.1 Main findings
The high degree of coincidence found between the Paradela data at CERN-nTOF and those of Weston at ORNL is confirmed by other high-resolution datasets. More than 280 peaks have been unambiguously identified, distributed as follows: 70 from 3 to 5 keV; 73 from 5 to 8 keV; 56 from 8 to 13 keV; and 82 from 13 to 30 keV. The position in energy of these points is statistically distributed with a RMS of 1.1 % (Fig. 3-left).
Fig. 5. Smoothed profile of the 235U(n,f) cross section
3.2 Numerical results
The numerical values of the USC-Eval data file are at the end, in Table 1. The uncertainty in energy is 0.1 % and in the cross section it can be estimated to be 2.6 %, assuming that the evaluated values are the mean of the experimental data with an energy binnig of 2000 bin / decade. In Table 2are the integral mean values compared with last evaluated libraries
4 Conclusions
An evaluation of the 235U(n,f) reaction has been made in the energy range from 3 keV to 30 keV, comparing datasets from different experiments having high statistics and a fine energy resolution. The very high coincidence between those experimental datasets allow us to unambiguously assign the energy and cross section value at the identified peaks with the resolution equivalent to 2000 bin/decade, with an uncertainty in energy below 0.1% and in cross section of 2.6%.
The shape of the cross section suggest the existence of resonance structures paving the way to a further understanding of the compound nucleus fission barriers.
References
[1] A. D. Carlson et al., Nuclear Data Sheets 148 (2018) 143-188 [2] M. B. Chadwick et al., EPJ WoC 146 (2017) 02001 [3] L. Leal et al. EPJ WoC 146 (2017) 02021
[4] C. Paradela et al., EPJ WoC 111 (2016) 02003 EXFOR 23294.003
[5] L.M. Weston and J.H. Todd, . Nucl. Sci. and Eng. 88 (1984) 567 EXFOR 12877.004 [6] M. Sin, R. Capote, M.W. Herman and A. Trkov, Nuclear Data Sheets 139 (2017)138 [7] C.D. Bowman et al. Nucl.Data React. Conf (Helsinki) 2 (1970) 65 EXFOR 10170.002 [8] P. Lemley et al., Nucl. Sci. and Eng. 43 (1971)281 EXFOR 10120.002
[9] T.A. Mostovaya et al., Conf. Neutron Phys (Kiev) 3 (1980)30 EXFOR 40616.002 [10] J. Blons et al., Nucl. Phys. 69 (1965)545 EXFOR 201483. 002
[11] C. Wagemans et al., Annals of Nucl. Ener. 3(1976)437
[12] R.B. Perez et al., Nucl. Sci. and Eng. 55 (1974)203 EXFOR 10302.002 [13] C. Guerrero et al., Eur. Phys. J. A49 (2013)27-42
[16] C. Paradela et al., Phys. Rev. C 82 (2010)034601 [17] E. Leal-Cidoncha et al. EPJ WoC 146 (2017) 04057
[18] nTOF-FIC U5(n,f) dataset. W. Furman, private communication (not yet published) [19] IAEA NDS Reference file
https://www-nds.iaea.org/standards/references/235U_nf_Reference_xs_data.txt
[20] G.F. Bertsch, D. Brown and E.D. Davis, Phys. Rev. C 98 (2018)014611 [21] R.B. Perez et al., Nucl. Sci. Eng. 55 (1974)203
======================================================================= Table 1. USC-Eval [Energy in eV – Cross section in barn]
13407 2.730 13442 2.852 13505 2.799 13540 2.850 13580 2.537 13610 2.791 13650 2.487 13678 2.669 13710 2.601 13780 2.212 13810 2.253 13850 2.548 13892 2.477 13942 2.563 13990 2.431 14044 2.678 14140 2.295 14218 2.588 14250 2.527 14325 2.619 14420 2.275 14495 2.722 14528 2.676 14572 2.741 14619 2.443 14677 2.835 14760 2.639 14795 2.619 14874 3.050 14921 2.806 14975 2.999 15011 2.761 15047 2.259 15081 2.155 15118 2.154 15118 2.154 15193 2.369 15264 2.246 15338 2.330 15381 2.249 15460 2.365 15527 2.162 15645 2.516 15712 2.372 15777 2.400 15822 2.285 15895 2.507 15992 2.224 16065 2.604 16119 2.142 16182 2.527 16220 2.436 16290 2.603 16362 2.497 16441 2.603 16535 2.154 16615 2.608 16672 2.497 16755 2.575 16825 2.152 16863 2.350 16922 2.220 17022 2.355 17066 2.254 17137 2.445 17217 2.183 17295 2.214 17389 1.940 17460 2.123 17560 2.021 17625 2.386 17690 2.455 17780 2.436 17855 2.391 17944 2.471 18056 2.274 18095 2.487 18200 2.426 18250 2.426 18309 2.222 18360 2.380 18405 2.334 18470 2.578 18514 2.375 18562 2.367 18632 2.284 18820 2.588 18930 2.426 19030 2.829 19075 2.741 19111 2.771 19241 2.224 19325 2.341 19412 2.045 19560 2.443 19590 2.385 19690 2.091 19760 2.139 19830 2.099 19870 2.172 19920 2.101 20000 2.395 20055 2.520 20090 2.299 20160 2.335 20220 2.110 20325 2.113 20385 1.942 20406 1.896 20520 1.912 20580 2.102 20715 1.944 20808 2.222 20909 2.071 21007 2.192 21205 1.829 21230 1.928 21325 1.918 21430 2.273 21580 2.055 22612 2.049 22670 2.190 22715 2.199 22800 2.011 22880 2.040 22960 1.979 23040 2.020 23136 1.866 23230 1.939 23330 2.050 23395 2.005 23460 2.070 23580 1.839 23740 2.249 23850 2.293 23980 1.989 24105 2.010 24185 1.879 24375 2.243 24458 2.281 24620 2.064 24790 2.184 24910 2.081 25040 2.116 25150 1.959 25270 2.133 25380 2.090 25499 2.212 25620 2.017 25730 2.113 25858 1.855 25950 1.887 25980 1.989 26130 2.121 26225 2.250 26330 2.106 26420 2.152 26560 2.035 26660 2.142 26850 2.040 27000 2.274 27120 2.137 27250 2.213 27410 2.035 27488 2.028 27590 2.296 27724 2.233 27890 2.416 27990 2.345 28080 2.360 28270 2.142 28390 2.289 28475 2.228 28605 2.396 28730 2.162 28980 2.410 29070 2.375 29240 2.451 29395 2.162 29520 1.979 29660 2.060 29890 1.837 29910 1.847 29955 1.908 30000 2.040
---
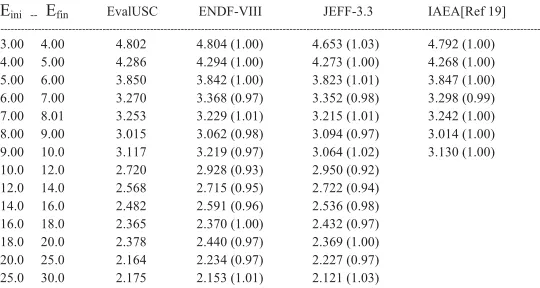
Table 2. Integral mean values compared with last evaluated libraries.
En is in keV and the cross section in barn.
In brackets are the ratios of the USC-Eval to the evaluated libraries
Eini -- Efin EvalUSC ENDF-VIII JEFF-3.3 IAEA[Ref 19]
3.00 4.00 4.802 4.804 (1.00) 4.653 (1.03) 4.792 (1.00)
4.00 5.00 4.286 4.294 (1.00) 4.273 (1.00) 4.268 (1.00)
5.00 6.00 3.850 3.842 (1.00) 3.823 (1.01) 3.847 (1.00)
6.00 7.00 3.270 3.368 (0.97) 3.352 (0.98) 3.298 (0.99)
7.00 8.01 3.253 3.229 (1.01) 3.215 (1.01) 3.242 (1.00)
8.00 9.00 3.015 3.062 (0.98) 3.094 (0.97) 3.014 (1.00)
9.00 10.0 3.117 3.219 (0.97) 3.064 (1.02) 3.130 (1.00)
10.0 12.0 2.720 2.928 (0.93) 2.950 (0.92) 12.0 14.0 2.568 2.715 (0.95) 2.722 (0.94) 14.0 16.0 2.482 2.591 (0.96) 2.536 (0.98) 16.0 18.0 2.365 2.370 (1.00) 2.432 (0.97) 18.0 20.0 2.378 2.440 (0.97) 2.369 (1.00) 20.0 25.0 2.164 2.234 (0.97) 2.227 (0.97) 25.0 30.0 2.175 2.153 (1.01) 2.121 (1.03)

![Table 1. USC-Eval [Energy in eV – Cross section in barn]](https://thumb-us.123doks.com/thumbv2/123dok_us/8006136.1330354/7.482.102.370.165.535/table-usc-eval-energy-ev-cross-section-barn.webp)