Distributional Features for Text Categorization
Based on Weight
CH.GOWTHAMI, P.RAJA SEKHAR
Department of CSE, Avanthi College of Engg & Tech, Tamaram, Visakhapatnam, A.P., India.
Abstract— Text categorization is the task of assigning
predefined categories to natural language text. With the widely used “bag-of-word” representation, previous researches usually assign a word with values that express whether this word appears in the document concerned or how frequently this word appears. Although these values are useful for text categorization, they have not fully expressed the abundant information contained in the document. This paper explores the effect of other types of values, which express the distribution of a word in the document. These novel values assigned to a word are called distributional features, which include the compactness of the appearances of the word and the position of the first appearance of the word. The proposed distributional features are exploited by a tfidf style equation, and different features are combined using ensemble learning techniques. Experiments show that the distributional features are useful for text categorization. In contrast to using the traditional term frequency values solely, including the distributional features requires only a little additional cost, while the categorization performance can be significantly improved. Further analysis shows that the distributional features are especially useful when documents are long and the writing style is casual.
Index Terms— Text categorization, text mining, machine learning, distributional feature, tfidi.
1. INTRODUCTION
N the last 10 years, content-based document management tasks have gained a prominent status in the information system field, due to the increased availability of documents in digital form and the ensuring need to access them in flexible ways [30]. Among such t a s k s , T e x t Categorization assigns predefined c a t e g o r i e s to natural language text according to its content. Text categorization has attracted more and mo r e attention from researchers due to its wide applicability. Considering the following example, “Here you are” and “You are here” are two sentences corresponding to the same vector using the frequency-related values, but their meanings are totally different. Although this is a somewhat extreme example, it clearly illustrates that besides the appearance and the frequency of appearances of a word, the distribution of a word is also important. Therefore, this paper attempts to design some distributional features to measure the characteristics of a word’s distribution in a document. The first consideration is the compactness of the appearances of a w o r d . Here, the compactness measures whether the appearances of a word concentrate in a specific part of a document or spread over the whole document. In the former situation, the word is considered as compact, while in the latter situ atio n , the word is considered as less compact. This consideration is motivated by the following facts.
A do cu men t usually contains several parts. If the appearances of a word are less compact, the word is more likely t o appear in different parts and m o r e l i k e l y t o be related to the theme of t h e document.
The contribution of this paper is the following:
1) Distributional features for text categorization a r e designed. Using these features can h e l p improve the performance, w h i l e requiring only a little additional cost.
2) How to use the distributional features is answered. Combining traditional term frequency with the distributional f e a t u r e s results in improved performance.
3) The f a c t o r s affecting the p e r f o r m a n c e of t h e distributional features are discussed.
4) The benefit of the distributional features is closely related to the length of documents in a corpus and t h e writing style o f documents.
2.HOW TO EXTRACT DISTRIBUTIONAL FEATURES
Recall that the definitions of the two proposed distributional features are both based on the analysis of a word’s distribution; thus, modelling a word’s distribution becomes the prerequisite for extracting the required features.
2.1. Modeling a Word’s Distribution
In this paper, a word’s distribution is modeled by two steps: First, a document is divided into s e v e r a l parts; then, the
Fig. 1. The distribution of “corn.”
Distribution of a word is modeled as an array w h e r e each element records the number of appearances of this word in the corresponding part. The length o f this array is the total number of the parts.
2.2 Extracting Distributional Features
Given a word’s d i s t r i b u t i o n , this s e c t i o n c o n c e n t r a t e d on implementing the t w o i n t u i t i v e l y proposed distributional features.
For the compactness of the appearances of a word, three
Implementations are shown as follows (note that under the word distribution model mentioned above, the position of a word’s a p p e a r a n c e is just the i n d e x o f the corresponding part):
ComPactPartNum .The number of parts where a word appears can b e u s e d to m e a s u r e the c o n c e p t of compactness. This is a natural implementation of the idea p r o p o s e d in the introduction part. As what i s mentioned, a word is less compact if it appears in different parts o f a document.
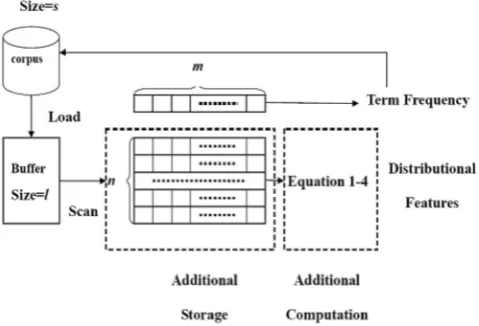
Fig. 2. The process of extracting t h e term frequency and distributional features
3.HOW TO UTILIZE DISTRIBUTIONAL FEATURES
The term frequency in tf idf can be regarded as a value that measures the i m p o r t a n c e of a wor d in a document. As
TABLE1 - Weighting Functions
discussed , the importance of a word can be measured not only by its term frequency but also by the compactness of its appearances and the position of its first appearance. Therefore, the standard tf idf equation can be generalized as follows:
tf idf (t,d)=importance(t,d)*idf(t)
Fig. 3. The trends for different weighting functions.
normalized position. The first three functions assume that the importance decreases with the increase of position, while the last function, LocalVLinear, assumes that the beginning and the end of a document have more importance than the body. Fig. 3 shows t h e trends of these f o u r functions in a document with 1 0 parts. Note t h a t i n this figure, f o r each f u n c t i o n , the w e i g h t is normalized by its maximum weight to facilitate comparison. From this graph, it is clear that LocalVLinear is given such name due t o its “V”-like shape.
4. EXPERIMENTS
SVM and k N N are t w o c l a s s i f i e r s that a c h i e v e d the best performance in a previous comparative study [35]. Thus, in this s e c t i o n , all e x p e r i m e n t s a r e based on these two classifiers.
4.1 Data Sets
The Reuters-21578 corpus [19] contains 21,578 articles taken
TABLE 2:
The Contingency Table for Category Ci
occur in at least two have at least one document in both the training set and the test set are extracted. After eliminating documents that do not belong to any category, there are 7,770 documents in the training set and 3,019 documents in test set. After stemming and stop-word removal, the vocabulary contains 12,158 distinct words that d o c u m e n t s of the corpus. 4.2 Performance Measure and Experimental Configuration.
For evaluating the performance on these three corpora, the standard precision, recall, an d F 1 measure is used. Given the contingency table of category Ci (Table 2), the precision(pi) , recall ri , and F1 measure F1 of category Ci are calculated as follows:
Pi=TPi/TPi+FPi,ri=TP1/TPi+FNi,F1=2pi/(pi+ri)
recall, and F1. This method is called macro averaging. The other is based o n the global c o n t i n g e n c y table ( Table 3 ), which i s called m i c r o - averaging.
The summarization of the reported combination:
Parameters are optimized for T F (“bag-of-word” baseline) according to miF1 v alu e. Then, t h i s s e t o f parameters is used f o r the distributional features.
4.3Effect of Distributional Features
The experiments in this section are designed to explore the effect of the d i s t r i b u t i o n a l features. The question that w e attempt to answer is: are the distributional features useful for text categorization? For eight features (TF+3 CP features+4 FA features). These features are organized into seven groups: TF, CP, F A , TF + CP, TF + FA, CP + FA a n d TF + CP + FA. For example, all possible combinations of features from C P and features from FA form t h e g r o u p CP + FA. Due t o the l i m i t o f the l e n g t h , t h e results are reported for a part of combinations of each group, which is summarized in Table 4. Note that TF is the “bag-of- word” baseline.
For other f e a t u r e s , the g a i n o f performance compared to the baseline i s reported. Suppose the performance of the ith feature (feai) and the baseline i s pf (feai ) and pf (base) respectively, the gain (Gain) of feai is calculated as follows:
Gain (feai)-pf(base)/pf(base)(100%)
Average Rank of Different Candidates
The smaller the rank is, the better the performance is.In Table, it is shown that TF + CPPV + FAGI perform the b e s t . In order to show the gap between the selected group of features, i.e., TF,
CPPV , and FAGI , and the possible best performance, we also extract the results of different combinations of TF, CPPV , and FAGI from below table and list them in results of distributional features to facilitate comparison
4.4 Factors Influencing the Performance of Distributional Features
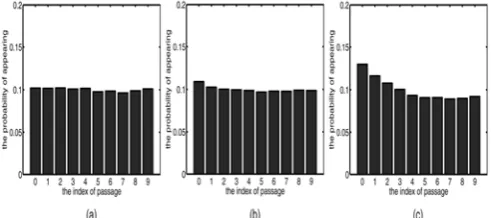
As o b s e r v e d , when the d i s t r i b u t i o n a l features are introduced, there i s no obvious improvement on Reuters but a significant improvement on 2 0 Newsgroup and WebKB. Recall that when the compactness of the appearances of word is introduced, it is assumed that a document contains several parts and the word that only appears in one part is not closely related to the theme of the document. Also, when the position of the first appearance of a word is introduced, it is assumed that the word mentioned late by the author is not closely related to the theme of the document. Intuitively, these two assumptions are m o r e likely to b e s a t i s f i e d when a d o c u m e n t contains s om e loosely related content. After r e po r t in g the results of the distributional features using the d i s c o u r s e passage, the window-passage-based distributional features are also tried. For each data s e t , the maximum l e n g t h among the 80 p e r c e n t s h o r t e r d o c u ments is e x t r a c t e d . Then,five window sizes are tried, from 20 percent to 100 percent of this maximum length, with a gap of 20 percent.11 The influence of different passages on the performance of the distributional features is shown in Fig. 4. In these figures, the y-axis is the percentage improvement over TF, and the x-axis is the window size (in percentage of the extracted maximum length). The performance o f the discourse passage i s plotted as the point corresponding to the window size of 0 percent. In t h e s e graphs, “CP” corresponds to CPPV, and “ FA” c o r r e s p o n d s to FAGI.
The first exploration is about t h e length o f a document.
of documents. For each data set, the Short data set contains documents with length no more than 100, and the Long data set contains documents with length more than 100. Experiments are repeated for these six new generated data sets
discourse-passage-based distributional features.
(l) maF1 Co mp arison of the distributional features using the discourse passage and the window passages with different sizes. The x-axis denotes the window size (in percentage) of the window passage. The zero position on the x-axis corresponds to the
discourse passage. The y-axis denotes the performance
improvement (in percentage) over TF. (a) miF1 of kNN on Reuters. (b) miF1 of kNN on 20 Newsgroup. (c) miF1 of kNN on WebKB. (d) maF1 of kNN on Reuters. (e) maF1 of kNN on 20 Newsgroup. (f) maF1 of kNN on WebKB. (g) miF1 of SVM on Reuters. (h) miF1 of SVM 20 Newsgroup. (i) miF1 of SVM on WebKB. (j) maF1 of SVM on Reuters. (k) maF1 of SVM on 20 Newsgroup of SVM on WebKB
According to Table , the distributional features brought more significant improvement on the Long data set than on the Short data set, although there were some exceptions indicated by “ ” in Table . It seems that t h e exceptions concentrate on the Reuters data set. We notice that there is a big gap between the baseline of the Short part and the baseline of the Long part on the Reuters data set. In this situation, comparing RGain on the Short and Long parts cannot reflect the effect of the distributional features categorization tasks on Short and Long parts differs significantly.
Results of the Distributional Features on Three Short Data Sets (Discourse Passage)
The Influence of Document Length on the Results of the Distributional Features Reporting R e l a t i v e Gain (Discourse Page)
Baselines on the Short and Long parts are comparable; thus, the comparisons on these two data sets are more convincing. Below Fig. shows that on Reuters, the distribution of the topical words is uniform, while on 20 Newsgroup and WebKB, the topical words are more likely to appear at the beginning of a document. These differences partly explain
4.5 Further Analysis of the FA Features
Since the FA features proposed in this paper consist of two parts: the weighting function f and the strategy of only considering the first appearance of a word, it is necessary to further analyse which part brings the effect of FA features. In order to separate the influence of the weighting function, a group of weighted term frequency (WET) features are generated by using the weighting function f to weight each appearance of a word. Below table s h o w s that FA p e r f o r m s better than w e t , especially on 20 Newsgroup and WebKB. The cases where FA performs worse t h a n W E T are indicated by “.” Since WET still improves the baseline, it is believed that the effect of FA on 20 Newsgroup and WebKB isbrought by both the weighting function and the aggressive strategy that throws all appearances of a word except the first one.
5. CONCLUSION
Previous researches on text categorization usually use the appearance or the frequency of appearance to characterize a word. These features are not enough for fully capturing the information contained in a document. The research reported here extends a preliminary research [33] that advocates using distributional features of a word in text categorization. The distributional features encode a word’s distribution from some aspects. In detail, the compactness of the appearances of a word and the position of the first appearance of a word are used. Three types o f compactness-based features and four position-of-the-first-appearance-based features are implemented to reflect the different considerations. A tfidf style is constructed, and the ensemble learning technique is used to utilize the distributional features.
The comparisions between the FA Feature and the WET Feature with Discourse Passage Reporting G a i n
Frequency or combined together. Further analysis reveals that the effect of the distributional features is obvious when the d o c u m e n t s are l o n g and when the writing style i s informal.
ACKNOWLEDGMENT
The authors want to thank the anonymous reviewers for the helpful comments and suggestions. This research was supported by the National Science Foundation of China (under Grants 60505013, 60635030, and 60721002), the Jiangsu Science Foundation (under Grant BK2008018), and the
National High Technology Research and
Development Program of China (under Grant 2007AA01Z169).
REFERENCES
[1] L.D. Baker and A.K. McCallum, “Distributional Clustering of Words for Text Classification,” Proc. ACM SIGIR ’98, pp. 96-103, 1998.
[2] R. Bekkerman, R. Elaine, N . T i s h b y , and Y.Winter, “Distributional Word Clusters versus Wo rd s for Text Categorization,”J. Machine Learning Research, vol. 3, pp. 1182-1208, 2003.
[3] D.CAI, S.P. Yu, J.R. Wen, and WY. Ma, “VIPS: A Vision-Based Page Segmentation Algorithm” Technical Report MSR-TR-2003-79, Microsoft Seattle, Washington, 2003.
[4] J.P. Calan, “Passage Retrieval Evidence in Document Retrieval,”Proc. ACM SIGIR ’94, pp. 30310, 1994.
[5] M.F. Caropreso, S. Matwin, and F. Sebastian, “A Learner- Independent Evaluation of the Usefulness of Statistical Phrases for Automated Text Categorization,” Text Databases and Document Management: Theory and Practice, A.G. Chin, ed., pp. 78-102, Idea Group Publishing, 2001.
MS.Ch.Gowthami received the B.Tech degree from the Department of Information Technology, A.I.E.T, JNTUniversity, Kakinada in 2009 and She is currently pursuing M.Tech in the Department Of Computer Science and Engineering, Avanthi Institute of Engineering and Technology, Vishakhapatnam, JNTUniversity. Her research interests include DataMining And Association Rules.