Journal of
Volume 15, Number 1
January, 1962
RANGE
MANAGEMENT
The Effect Of Range Condition And Intensity
Of Grazing Upon Daily Intake And Nutritive
Value Of The Diet On Desert Ranges
C. WAYNE COOK, KENT TAYLOR, AND LORIN E. HARRIS
Research Professor and Graduate Assistant, Department of
Range Management; and
Professor, Department of Animal Husbandry; Utah State Agricultural Experiment Station.The desert ranges of the Inter-
mountain area furnish forage for
about nine million head of cat-
tle and sheep for five to six
months each winter. Many of
these ranges are in good condi-
tion, but many are in poor condi-
tion.
When ranges are overgrazed,
grazed during unsuitable sea-
sons, grazed by the wrong kind
of livestock, or otherwise used
improperly, they deteriorate. Ob-
vious results from grazing abuse
are changes in plant density and
species composition (Klemmed-
son, 1956; Short and Woolfolk,
1956; Stewart et al., 1940; Parker,
1954; Reid and Pickford, 1946).
Ranges in supposedly good con-
dition produce at maximum po-
tential, whereas ranges in poor
condition produce less than their
potential (Humphrey, 1949; Goe-
be1 and Cook, 1960).
A few investigators
have
stated that poor ranges support
a greater number of plants low
in nutritive value compared to
good ranges (Renner and John-
son, 1942; Hutchings, 1954). How-
ever, Goebel and Cook (1960)
found that many species that be-
come abundant on poor ranges
were as nutritious as dominants
on good ranges, and in some
cases were higher in nutrient
content.
Studies by Cook et al. (1953)
and Pieper et al. (1959) showed
that increased intensity of graz-
ing reduced daily forage intake
and digestibility of the nutrients.
On ranges producing a single
species, increased intensity of
grazing decreased the nutrient
content of the diet; but on ranges
supporting mixtures, change in
use from one species to another
accompanying increased inten-
sity of grazing actually increased
the nutrient intake in some
cases.
Cook et al. (1950) found that
forage remaining on good ranges
following grazing was lower in
nutrient content than originally
and that continued use caused
still greater reductions in nutri-
ent value.
The present study was carried
out on typical salt-desert ranges
in southwestern Utah during two
winter grazing seasons, 1957 and
1959, from November to March,
to determine the effect of range
condition and intensity of graz-
ing on the daily intake and nutri-
tive value of the diet.
Description of the Area
Vegetation in the study
area1
included the shrubs big sage-
brush
(Artemisiu trident&u),bud sage
(Artemisiu spinescens),winterfat (Eurotiu
Zunutu),four-
wing saltbush
(Atriplex canes- tens),and yellowbrush (Chryso-
thamnus StenophyZZus). Grasses
included needle-and-thread grass
(Spa comuta),
squirreltail (Si-
tunion
hystrix),galleta grass
(Hilariu jumesii), sand dropseed
(Sporobolus cryptandrus),
blue
grama (Bouteloua
gracilis),In-
dian ricegrass
(Oryzopsis hy- menoides),three-awn grass
(Ar- tistida Zongiseta),and downy
bromegrass
(Bromus tectorum).Forbs included globemallow
(Spaerulcea grassulariaefoliu)
and Russian-thistle
(SuZsoZa kalivar. tenuifolia).
The region is used primarily
as winter range for livestock.
Overgrazing in many areas has
resulted in marked changes in
vegetation cover compared to
protected areas.
The average annual precipita-
tion for the area is about 9 inches
with maximum temperatures
reaching 102°F in summer and
as low as -26°F during the win-
ter.
2 COOK, TAYLOR AND HARRIS
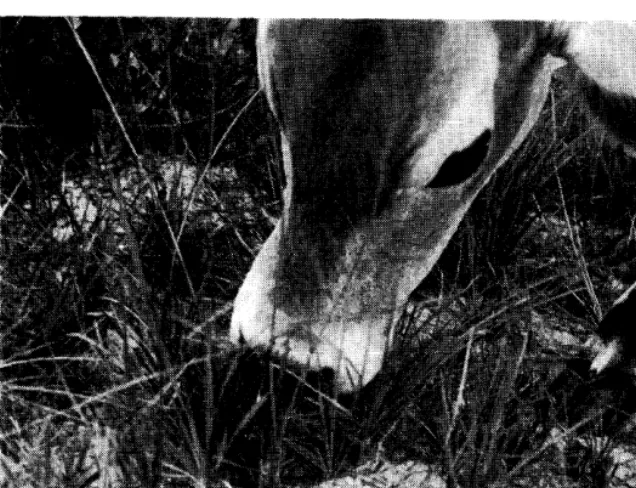
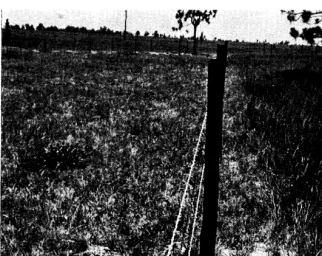
FIGURE 1. Experimental sheep grazing desert range judged to be in good condition.
selected where browse was more abundant than grass on good ranges and grass was more abun- dant than browse on adjacent poor ranges. Ranges on the pro- tected side were termed “good” range and those on the deterio- rated side, “poor.” Classification of range condition followed the procedure outlined by the two- phase method currently being used by the Bureau of Land Management (1957).
The size of the paddocks was such as to allow equal volume of herbage on each side of the fence. Six wether sheep equipped with fecal collecting bags and three w i t h esophageal-fistula cannulae were grazed in each paddock for collecting fecal and forage samples (Figure 1) . Herb-
age production and diets were determined by the method out- lined by Edlefsen et al. (1960). The fistulated sheep were penned each evening and turned out to graze with the other ani- mals at daybreak the following morning. It required from 2 to 3 hours to obtain forage samples. The remainder of the day the fistulated animals were allowed to graze for themselves with the other experimental animals.
Sheep were grazed for a pre- liminary period of six days on similar range adjacent to the trial paddocks. Each trial area was grazed for two five-day col- lection periods. In the first five-
day period the animals used the forage only lightly, whereas the second five-day period was con- sidered heavy use.
Forage samples were collected daily from each fistulated sheep in each area. The first forage samples were collected the day before fecal samples were col-
lected and forage collection was terminated the day before fecal collection ended. A composite forage sample for each sheep was taken for each period on each area.
Fecal bags were emptied twice daily, in the early morning and at nightfall. The feces of each sheep were stored in separate containers and weighed at the end of each five-day trial pe- riod. A composite sample for each period from each sheep was taken for chemical analyses. All data are presented on an oven- dry basis.
Daily forage intake and diges- tion coefficients were deter- mined by the lignin-ratio tech- nique (Cook et al., 1951).
Results and Discussion Producfion
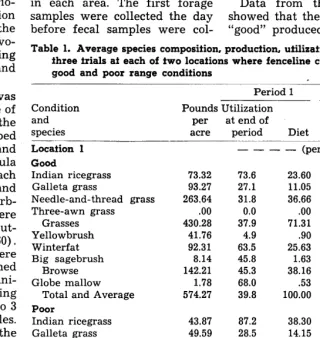
Data from the study areas showed that the paddocks rated “good” produced from 59 to as Table 1. Average species composifion, producfion, ufilizakion, and diet from
fhree trials af each of two locations where fenceline conkasfs presented good and poor range condifions
Condition and species
Period 1 Period 2
Pounds Utilization Utilization
per at end of at end of
acre period Diet period Diet
Location 1 Good
Indian ricegrass Galleta grass
Needle-and-thread grass Three-awn grass
Grasses Yellowbrush Winterfat Big sagebrush
Browse Globe mallow
Total and Average Poor
Indian ricegrass Galleta grass
Needle-and-thread grass Three-awn grass
Grasses Yellowbrush Winterfat Big sagebrush
Browse Globe mallow Russian thistle
Total and Average
73.32 93.27 263.64 .oo 430.28 41.76 92.31 8.14 142.21 1.78 574.27 43.87 49.59 .88 .75 95.09 157.41 40.54 41.76 239.71 .44 2.79 338.03
_-_- (percent) - - - -
Location 2 Good
Indian ricegrass Squirreltail Three-awn grass Galleta grass
Needle-and-thread grass Sand dropseed
Grasses Yellowbrush Winterfat Big sagebrush
Browse Globe mallow Russian thistle
Forbs
Total and Average Poor
Indian ricegrass Squirreltail grass Three-awn grass Galleta grass
Needle-and-thread grass Sand dropseed
Grasses Yellowbrush Winterfat Big sagebrush
Browse Globe mallow Russian thistle
Forbs
Total and Average
RANGE CONDITION AND INTENSITY OF GRAZING 3
31.27 35.0 7.08 78.9 16.47 .91 21.9 .13 38.7 .17
1.90 0.0 .oo 1.7 .04
65.37 20.8 4.23 53.3 25.49 34.50 50.4 11.25 83.4 13.66
1.90 1.5 .02 12.0 .24
135.85 25.8 22.71 60.2 56.07 76.60 2.9 1.44 26.6 21.77 125.33 88.7 71.95 97.7 13.53 28.50 4.7 .87 24.5 6.77 230.43 49.9 74.25 65.1 42.07 4.35 68.0 1.91 90.1 1.15 5.73 30.3 1.12 40.6 .71 10.08 46.6 3.04 62.0 1.86 376.36 41.1 100.00 63.2 100.00
16.57 82.0 11.16 91.3 3.05
.oo 0.0 .oo 0.0 .oo
3.46 13.3 .38 19.8 .44 125.10 37.9 38.95 59.6 53.77 7.73 80.8 5.13 90.9 1.54 1.83 15.0 .22 56.0 1.49 154.69 43.9 55.85 63.6 60.29 97.53 15.3 12.26 27.3 23.17 24.83 88.3 18.01 98.3 4.91 30.30 39.2 9.76 53.2 8.40 152.66 31.9 40.03 44.0 36.48 2.00 94.3 1.55 97.0 .lO 8.10 38.7 2.57 58.2 3.13 10.10 49.7 4.12 65.8 3.23 317.45 38.3 100.00 54.2 100.00
much as 136 pounds more herb- age per acre than those in poor condition (Table 1). Good ranges produced considerably more In- dian ricegrass, needle-and-thread grass, and winterfat, whereas poor ranges produced more three-awn grass , yellowbrush, and in some cases galleta grass.
Utilization and Diet Even though the same quantity of herbage was available for the experimental animals on both good and poor ranges, the over- all use of forage was never as high on poor ranges as on good ranges. This difference was gen- erally greater during the second grazing period than the first
(Table 1).
In some areas in good condi- tion where species of secondary palatability were sparse, the use was higher on these secondary plants than on poor ranges where
they were abundant. This was true of both yellowbrush and
big sagebrush where they pro- duced less than 0.3 percent of the herbage on good ranges. It appears that under these condi- tions animals ate them for va- riety. This suggests that some plants invade an area in rather large quantities in order to be- come established on ranges in downward trend. On all ranges in poor condition, the species which were more palatable on good ranges were consumed ex- tremely heavily before the less palatable species were eaten even moderately.
With increased utilization-pe- riod 2 compared to period l- intensity of use generally in- creased more on grasses than on browse. This was more pro- nounced on good than on poor ranges (Table 1).
The average diet from the three study areas at Location 1 during the first grazing period contained more grass than browse under both good and poor
range conditions. However, dur- ing the second grazing period the diet on poor ranges contained twice as much browse as grass, and the diet on good ranges con- tained seven times more grass than browse (Table 1).
The average diet from the three study areas at Location 2 during the first grazing period contained more than three times as much browse as grass on good ranges, but on poor ranges the diet during the first period con- tained only slightly more grass than browse. During the second grazing period, the diet on good ranges contained slightly more grass than browse, and the diet on poor ranges contained almost twice as much grass as browse
(Table 1).
Thus, the quantity of the var- ious forage classes on the range is not an index to the quantities of each in the diet.
Chemical Content of Diet The changes in nutrient con- tent of the diet with increased intensity of use is a result of changes in species and portions of plants consumed.
The ingested forage on poor ranges from the three areas at Location 1 was higher in protein, lignin, and ash, whereas ingested forage on good ranges was higher in cellulose and gross energy (Table 2). This might be ex- pected since grass made up ma- terially more of the diet on good ranges and browse made up more of the diet on poor ranges. Grasses on desert winter ranges are generally higher in cellulose and other carbohydrates than browse; however, browse species are higher than grasses in pro- tein, ash, and lignin (Cook et al., 1954).
4 COOK, TAYLOR AND HARRIS
Table 2. Average nufrieni confeni of ingested material from fence-line con- trasts displaying good and poor conditions, grazed at two intensifies af two separate locations shown in Table 1.1
Location Other
and Utiliza- Ether Total Cellu- carbo- Gross condition tion extract protein Ash Lignin lose hydrates energy --- (percent)- - - kcal/lb Location 1
Good 39.8 2.7 8.0 9.3 12.0 25.8 42.2 1722 69.9 2.9 7.3 9.7 12.7 23.6 43.8 1717 Average 2.8 7.6 9.5 12.4 24.7 43.0 1720 Poor 29.5 2.9 9.2 11.5 12.1 22.2 42.1 1678 45.1 3.1 9.6 11.6 14.3 20.0 41.4 1634 Average 3.0 9.4 11.5 13.2 21.1 42.7 1656 Location 2
Good 41.1 3.2 8.6 9.9 12.4 23.5 42.4 1791 63.2 2.1 7.6 10.3 11.9 24.2 43.9 1804 Average 3.6 8.1 10.1 12.2 23.8 43.2 1797 Poor 38.3 2.7 7.4 11.2 11.3 23.7 43.7 1787
- 54.2 2.4 7.0 11.9 12.9 23.2 42.6 1737 Average 2.5 7.2 11.5 12.1 23.5 43.2 1762 IForage material was collected from esophageal fistulae and chemical con-
tent was corrected for ash content of the saliva.
creased intensity of use. The effect of increased intensity of utilization resulting f r o m the consumption of coarser material counteracted the influence of in- creased grass in the diet some- what, since both ash and lignin increased (Table 2).
On poor ranges at Location 1 the diet increased in protein, ash, and lignin and decreased in cel- lulose, other carbohydrates, and gross energy with increased util- ization. The increase in protein was a result of the increase of browse in the diet. Other changes in nutrient intake were a result of both increased consumption of coarse material and increased browse in the diet.
At Location 2, under light use, the average diet on good ranges was higher in protein and lignin compared to diets on poor ranges which were higher in cellulose and other carbohydrates. How- ever, with heavy use-period 2- the average diet on good ranges was higher in protein, cellulose, and other carbohydrates, where- as diets on poor ranges were higher in lignin and ash.
The increase of cellulose and other carbohydrates and the de- crease of lignin with increased utilization on good ranges at the
second location was largely a re- sult of the marked change from a high percentage of browse in the diet during period 1 to a high percentage of grass during pe- riod 2 (Table 1). There was a slight increase of grass in the diet on poor ranges during the second period. However, in- creased consumption of coarser material with increased intensity of utilization apparently offset the effect of increased grass in the diet, since all nutrients ex- cept ash and lignin decreased with increased use (Table 2).
Digestibility
The average digestibility coef- ficients from the three areas at Location 1 showed that the di- gestibility of protein and ether extract was higher on poor range than on adjacent good range, but the digestibility of cellulose, other carbohydrates, and gross energy was higher on good range
(Table 3) .
The digestibility of protein de- creased and the digestibility of cellulose, other carbohydrates, and gross energy increased with increased intensity of use on good ranges as a result of in- creased grass in the diet. How- ever, on poor ranges where
browse increased in the diet with increased grazing intensity the digestibility of protein increased slightly, but the digestibility of cellulose, other carbohydrates, and gross energy decreased.
On the three areas at Location 2 digestibility of protein was ma- terially higher on good ranges compared to poor ranges for both periods. The digestibility of other chemical constituents in the diet was not consistently high or low on good or poor ranges because it was affected differently by in- tensity of grazing (Table 3).
Digestibility of protein de- creased and digestibility of cel- lulose, other carbohydrates, and gross energy increased with in- creased intensity of grazing on good ranges where grasses re- placed browse in the diet as de- gree of use increased. However, on poor ranges where forage classes remained about the same percentage in the diet during both grazing periods, the digest- ibility of all constituents de- creased with increased intensity of utilization (Table 3).
Daily Intake
In all cases daily intake of for- age was less on poor ranges than on adjacent good ranges (Table 3). Intensity of utilization de- creased daily consumption of for- age in all study areas. This was more pronounced on poor ranges than on good.
Conclusions
The nutrient content of herb- age on good compared to poor ranges depends upon the species composition. This is especially true of the quantity of herbage produced by browse species com- pared to grass species. If pala- table browse herbage predom- inates, the diet will be higher in protein, ash, lignin, and ether extract; but if palatable grass herbage predominates, the diet will be higher in cellulose, other carbohydrates, and metaboliz- able energy.
RANGE CONDITION AND INTENSITY OF GRAZING 5
Table 3. Average daily infake of dry maffer and digesfibilify of forage maferial from adjacenf good and poor range af fwo separafe locafions when grazed af fwo intensifies.
Digesfibilify Digest- Metabo-
Location Other Digest- ible Metabo- lizable
and con- Daily Ether Total carbo- Gross ible protein lizable energy dition utilization intake extract protein Cellulose hydrates energy protein intake energy intake
(percent) Location 1 Good 39.8
69.9 Average
Poor 29.5 45.1 Average
Locaiion 2 Good 41.1
63.2 Average
Poor 38.3 54.2 Average
(lbs/day) --- - (percent) - - __---- (lb) (kcal/lb) (kcal)
3.21 5.9 37.9 50.2 60.0 38.1 3.03 .097 501 1608
3.03 20.1 37.1 50.3 65.6 41.4 2.71 .082 576 1745 3.12 13.0 37.5 50.2 62.8 39.7 2.85 .089 538 1679 3.01 20.7 41.8 44.1 59.1 37.5 3.85 .116 497 1496 2.53 30.1 42.9 43.4 54.8 36.0 4.12 .104 423 1070 2.77 24.4 42.4 43.8 36.9 36.8 3.99 .lll 460 1274
3.09 29.8 51.0 42.1 47.6 36.0 4.39 .136 567 1752
2.93 30.1 43.6 49.9 63.4 41.0 3.31 .097 604 1770
3.01 29.9 47.3 46.0 55.5 38.5 3.83 .115 586 1764 2.63 33.5 35.5 45.0 56.1 37.2 2.63 .070 512 1347
2.23 26.8 32.0 34.3 54.7 33.3 2.24 .050 431 894
2.43 30.2 33.8 39.6 55.4 35.2 2.44 .060 472 1147
gested as nutrients in herbage on good ranges when degree of utilization is similar. However, light grazing on relatively un- palatable species may be associ- ated with extremely heavy use of the more palatable ones.
Increased use on both good and poor ranges results in decreases in the daily intake of forage. Generally, more intensive graz- ing decreases the content of the more desirable nutrients in the forage, and furthermore, de- creases the digestibility of these nutrients because of forced utili- zation of the coarser plant ma- terial. However, decreased nu- trient content and digestibility with increased utilization may be compensated for when the diet changes from one forage class to another or from heavily used species to species only lightly or not previously used.
Summary
During two winter grazing seasons-1957 and 1959-a study was conducted on typical desert ranges in southwestern Utah to determine the effect of range condition and intensity of graz- ing upon the daily intake and nutritive content of the grazing animals’ diet.
At each of two locations three areas displaying fence-line con-
trasts of good and poor range were selected and fenced so that areas on each side included equal herbage for the same number of experimental animals. Three sheep with esophageal fistula and six wethers equipped with fecal collecting bags were grazed on each side of the fence. Daily intake and digestibility were de- termined by the lignin-ratio technique. Each paddock was grazed for two five-day periods, the first representing light use and the second, heavy use.
Ranges in good condition pro- duced more herbage than those in poor condition.
Even though the same quan- tity of herbage was available on both good and poor ranges, the use was lighter on poor ranges.
Diets showed that animals ate more grass in some areas and more browse in others. Likewise, diets changed from a large per- centage of one forage class to a large percentage of another with increased intensity of use.
The nutrient content of the diets on good and poor ranges depended upon the species com- position and the intensity of util- ization. When browse was high in the diet, the nutrient intake was generally high in protein, ash, lignin, and ether extract; but when grass was high in the
diet, the nutrient intake was generally high in cellulose, other carbohydrates, and metaboliz- able energy.
The digestibility of nutrients in diets on both poor and good ranges was about the same if use of similar species was not too different. Increased utilization decreased digestibility of forage unless the diets changed substan- tially in percentages of grass or browse.
Daily intake was less on poor ranges than on good ranges, and increased intensity of grazing re- duced daily intake on both good and poor ranges.
LITERATURE CITED
COOK, C. WAYNE, AND LORIN E. HARRIS. 1950. The nutritive content of the grazing sheep’s diet on sum- mer and winter ranges of Utah. Utah Agr. Exp. Sta. Bul. 342. COOK, C. WAYNE, L. A. STODDART, AND
L~RIN E. HARRIS. 1951. Measuring consumption and digestibility of winter range plants by sheep. Jour. Range Mangt. 4: 335-346. COOK, C. WAYNE, L. A. STODDART, AND /
LORIN E. HARRIS. 1953. Effects of grazing intensity upon the nutri- tive value of range forage. Jour. Range Mangt. 6: 51-54.
COOK, C. WAYNE, L. A. STODDART, AND LORIN E. HARRIS. 1954. The nutri- tive value of winter range plants in the Great Basin. Utah Agr. Exp. Sta. Bul. 372.
6
COOK, TAYLOR AND HARRIS
mined by hand plucked and esoph-
ageal fistula samples. Jour. Ani- range conditions induced by graz- ma1 Sci. 19: 560-567. ing. Jour. Range Mangt. 9: 134-138. GOEBEL, CARL J., AND C. WAYNE MARKER, KENNETH W. 1954. Applica-
COOK. 1960. Effect of range condi- tion of ecology in the determina- tion of range condition and trend. tion on plant vigor, production,
and nutritive value of forage. Jour. REID, E. H., AND G. D. PICKFORD. 1946. Jour. Range Mangt. 7: 14-23. Range Mangt. 13: 307-313.
HUMPHREY, R. R. 1949. Field com- ments on the range condition method of forage survey. Jour. Range Mangt. 2: l-10.
Judging mountain meadow range condition in eastern Oregon and eastern Washington. U. S. Dept. Agr. Cir. 748.
HUTCHINGS, S. S. 1954. Managing PIEPER, REX, C. WAYNE COOK, AND LORIN E. HARRIS. 1959. Effect of winter sheep range for greater ,.’
J
intensity of grazing upon nutritive profit. U. S. Dept. Agr. Farmer’s content of the diet. Jour. Animal Bul. 2067.
KLEMMEDSON, JAMES 0. 1956. Inte*- RENNER, F. G., AND E. A. JOHNSON. Sci. 18: 1031-1037. relations of vegetation, soils, and 1942. Improving range conditions
for wartime livestock production. U. S. Dept. Agr. Farmer’s Bul. 1921.
SHORT, L. R., AND E. J. WOOLFOLK. 1956. Plant vigor as a criterion of r an g e condition. Jour. Range Mangt. 9: 66-69.
STEWART, GEORGE, W. P. COTTAM, AND S. S. HUTCHINGS. 1940. Influence of unrestricted grazing on northern salt-desert plant association in western Utah. Jour. Agr. Res. 60: - 289-316.
UNITED STATES DEPT. INTERIOR, BUREAU OF LAND MANAGEMENT. 1957. Range condition criteria for two phase method surveys (Re- vised Mimeo.)
Forage Intake By Cattle Grazing
Wiregrass Rangel
0. M. HALE, R. H. HUGHES, AND..F. E. KNOX Respectively, Associate Animal Husbandman, the Uni- versity of Georgia, College of Agriculture Experiment Stations, Coastal Plains Experiment Station; Range Con- servationist, Southeastern Forest Experiment Station, Forest Service, U. S. Department of Agriculture; and Chemist, Animal Husbandry Research Division, Agricul- tural Research Service, IT. S. Department of Agricul- ture, Tifton, Georgia.
In the South, range herds that
are not given feed supplements
usually lose weight during a
partof the year, even though ample
amounts of wiregrass forage are
available. Whether or not
nutri-tive value, intake of forage, or
both, are limiting factors has not
been demonstrated. This paper
reports a test designed to an-
swer the question.
The degree to which nutritive
value, intake of forage, or both,
contribute to cattle performance
cannot be measured directly.
Established procedures are avail-
able for determining chemical
composition and digestibility of
wiregrass forage (Halls et al.,
1957). Indirect methods employ-
ing an index substance provide
an opportunity for estimating in-
take (Kane et al., 1950). Animal
nutritionists have shown that if a
completely indigestible
index
material such as chromic oxide is
incorporated in the diet, the
amount of feed from which the
feces was derived can be calcu-
lated (Schiirch et al., 1950). This
method avoids the necessity of
total measures on either food in-
take or feces output.
Accordingly, the study re-
ported here was undertaken to
estimate daily intake of native
forage by cattle grazing wire-
grass-pine range using chromic
oxide as the index material. In
addition to intake, chemical
analyses and digestibility coef -
ficients of the cattle diet and
weight changes by the test cows
were obtained.
Materials and Methods
Tests were conducted in April,
June, September, and December
1956, in the wiregrass-pine graz-
ing type of range (Williams et
al., 1955) at the Georgia Coastal
Plain Experiment Station’s Ala-
paha Experimental Range
in
south Georgia. Principal forage
species were pineland threeawn
(Aristida stricta),
Curtiss drop-
seed (Sporobolus
curtessii),bluestems
(Andropogon spp.) ,carpetgrass
(Axonopus affinis),panicums
(Panicum ssp.) ,and
paspalums
(Paspalum spp.) .In
previous digestibility trials at
Alapaha (Halls et al., 1957))
these grasses comprised the bulk
of the cattle diet.
Five mature grade Hereford
and Brahman-Hereford c o w s
with calves grazed a single range
unit from March 15 through
December 1956. Ample forage
was available throughout t h e
year on range burned over in
January 1956. Cows had continu-
ous access to a complete mineral
mixture. From October 15 to
December 31, cows were fed 2
pounds cottonseed meal per head
daily, expect for the period
December 8 to December 22.
Calves were weaned October 16.
For each test, chromic oxide
was placed in a large gelatin
capsule and given orally during
a 14-day period. One capsule con-
taining 7.5 grams of the index
substance was given each cow
daily about 6: 00 a.m. and another
about 6:00 p.m.
Herbage samples approximat-
WIREGRASS RANGE 7
FIGURE 1. Gentle cows enabled close observation of exact kind and portion of plant eaten.
ing the cattle diet were obtained on the 11th and 12th days of each trial in accordance with procedures devised by Halls (1954). Two collectors, working separately, followed the cows and sampled the forage on sepa- rate days. Gentle cattle enabled close observation and selection of plant portions actually grazed
(Figure 1). Collections w e r e cornposited and dried for 24 hours at 70” C.
Fecal samples were taken on 2 successive days beginning on the second day of the forage collec- tion period. A small portion of feces from each cow was taken when grazing began in the morn- ing and again in the afternoon. All samples were cornposited, oven dried at 70” C., ground, and stored in airtight jars at room temperature.
Plant and fecal samples were analyzed for ash, crude protein, and ether extract as outlined by the Association of Official Agri- cultural Chemists (1950). Lignin was determined by the method suggested by Davis and Miller (1939) 7 and percent of carbo-
hydrates other than lignin was obtained by difference. Chromic
oxide content of feces was deter- mined by the method of Dansky and Hill (1952). The lignin ratio technique described by Kane et al., (1949) was used to calculate digestion coefficients.
With values for the indigesti- bility of the forage determined by the lignin ratio technique and the total fecal output calculated from the chromic oxide content of a representative fecal sample, the amount of forage consumed was computed by use of the formula:
Total forage intake = Total weight of feces/Percent indi- gestibility of forage.
Results and Discussion Grasses furnished a major por- tion of the cattle diet on winter- burned wiregrass-type f o r e s t range. Cattle exhibited a strong preference for pineland three- awn and bluestems in the spring, various bluestems in summer and fall, and Curtiss dropseed in winter (Table 1). Shrubs includ- ing saw palmetto (Serenoa re- pens) and a wide variety of other browse plants contributed about one-third of the total diet in win- ter. Grasses averaged 77 percent of the total forage collections, broad-leaved herbs 6 percent, and shrubs 17 percent.
Chemical analysis of diet sam- ples was unusually high in ash content in April and September collections, and the lowest in December (Table 2). Raindrop spatter of mineral soil apparent- ly contributed a considerable amount of ash in addition to the amount contained in the vegeta- tion itself.
As the grazing season ad- vanced, crude protein declined gradually to critically low levels in September a n d December. Ether extract, which comprised only a small fraction of total dry matter, followed the same trend until winter, when it increased due probably to greater con- sumption of highly resinous browse. Lignin was high, even in April, but did not increase sharp- ly until December after grasses had matured and large amounts of browse plants were consumed.
Table 1. Seasonal components of herbage samples from wiregrass range representing the caffle diet.
Plant species
Grasses: Total Pineland threeawn Curtiss dropseed Florida dropseed Bluestems Toothachegrass Carpetgrass Panicum spp. Misc. grasses Broad-leaved herbs Shrubs
April June September December --- (Percent by weight) - - -
83 80 87 59
24 3 6 12
7 1 4 23
7 10 6 4
22 35 35 8
4 6 3 1
1 3 11 3
7 7 8 1
11 15 14 7
7 3 8 6
8
HALE, HUGHES AND KNOX
Table 2. Chemical composition of native forage, by season@
Components April June September December
Ash
Crude protein Ether extract Lignin Carbohydrates
---_ (Percent) - - - -
8.27 6.84 8.60 4.88
8.65 8.23 5.28 5.13
2.35 1.94 1.78 2.09
10.26 12.92 11.75 15.38
60.47 60.07 62.59 62.52
1 Based on 90 percent dry matter content.
Carbohydrates, other
than
lignin, were only slightly greater
in fall and winter than in spring
and summer.
Seasonal decline in nutritive
value of forage (Table 3) was
accompanied by a consistent de-
clining forage intake (Table 4)
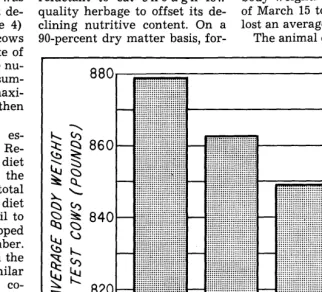
and body weight of test cows
(Figure 2). Both daily intake of
forage and of total digestible nu-
trients declined during the sum-
mer and fall from their maxi-
mums in the spring, and then
dropped abruptly in winter.
According to standards es-
tablished by the National Re-
search Council (1958), the diet
w a s deficient throughout the
trials (Table 3). Percent total
digestible nutrients in the diet
decreased from 44.48 in April to
42.64 in September, then dropped
sharply to 32.16 in December.
Other digestible nutrients in the
animal diet followed a similar
seasonal pattern. Digestion co-
efficients for c r u d e protein,
ether extract, and carbohydrates
showed a gradual decline from
April through September, and a
rather noticeable decline
in
December. Digestible p r o t e i n
was deficient yearlong and the
deficiency became more serious
as the grazing season advanced
(Figure 3)‘.
The study demonstrates con-
clusively that feed supplements
are necessary for maximum beef
production
in wiregrass-pine
ranges. Cattle apparently were
reluctant to eat en o u g h low
quality herbage to offset its de-
clining nutritive content. On a
go-percent dry matter basis, for-
age intake dropped from a high
of 20.46 pounds in April to a low
of 11.66 pounds in December
(Table 4). According to the Na-
tional Research Council (1958))
28 pounds dry matter containing
5-percent digestible protein and
60-percent total digestible nu-
trients is needed to meet daily
requirements of beef cows dur-
ing the first 3 or 4 months of lac-
tation. That cows were forced to
draw on body reserves to satisfy
their needs is evidenced by fail-
ure of test animals to maintain
body weight. During the period
of March 15 to October 16, cows
lost an average of 59 pounds.
The animal diet apparently de-
UWW
MAR. I5 JUNE IO AUG.2
OCT.16
FIGURE 2. The five test cows lost an average of 59 pounds between March 15 and Oc-
tober 16.
Table 3. Digestion coefficients, total digestible nutrients, and nutritive ratio of native forage as determined by lignin ratio medhod.1
Digestion coefficient
Date of Crude Ether Carbohy- Nutritive
collection protein extract drates T.D.N. ratio --- (Percent) - - - -
April 36.00 39.87 62.01 44.48 1:13
June 29.16 19.62 60.84 44.12 1:16
September 23.67 6.12 58.95 42.64 1:30
December 9.99 Negative 45.45 32.16 1:55 1 Based on 90 percent dry matter content.
WIREGRASS RANGE 9
BISWELL, H. H., B. L. S~UTHWELL, J. W. STEVENSON, AND W. 0. SHEP- HERD. 1942. Forest grazing and beef cattle production in the Coastal Plain of Georgia. Ga. Coastal Plain Expt. Sta. Cir. 8, 25 pp.
DANSKY, L. M. AND F. W. HILL. 1952. Application of the chromic oxide indicator method to balance stud- ies with growing chicks. Jour. Nutr. 47: 449-459.
DAVIS, R. E., AND C. C. MILLER. 1939. Partition of the less easily digested carbohydrate complex of forages. Indus. and Engin. Chem. Analyt. Ed. 11: 651-652.
HALLS, L. K. 1954. The approxima- tion of the cattle diet through diet sampling. Jour. Range Mangt. 7: 269-270.
, AND B. L. SOUTHWELL.
1956. Supplemental feeding of range cattle in wiregrass-pine ranges of Georgia. Sot. Amer. For- esters Proc.: 58-61.
, 0. M. HALE, AND F. E. KNOX. 1957. Seasonal variation in grazing use, nutritive content and digestibility of wiregrass forage. Ga. Agr. Expt. Sta. Bul. (n. s.) 11. 28 PP.
KANE, E. A., W. C. JACOBSON, AND FIGURE 3. Native forage was deficient in digestible protein (crude protein based on 90
percent dry matter x percent of digestibility).
L. A. MOORE. 1949. Digestibility studies on dairy cattle: a compari- son of the total collection methods; limited to the fall-winter period even then was less than the conventional versus chromium with good results (Halls and suggested amount for optimum oxide and lignin techniques. Jour. Southwell, 1956). performance of lactating cows. Animal Sci. 8: 623.
Summary By December, forage intake had NATIONAL RESEARCH COUNCIL. 1958.
Chromic oxide was used as an dropped to less than one-half the
Recommended nutrient allowances for beef cattle IV (Rev.) Wash- index substance to estimate for- suggested amount. Feed supple- ington, D.C. 28 pp.
age intake in April, June, Sep- ments high in digestible protein tember, and December, 1956, by and energy were needed to off-
SCH~RCH, A. F., L. E. LLOYD, AND E. W. CRAMPTON. 1950. The use of five test cows grazing wiregrass- set nutrient deficiencies and low chromic oxide as an index for de- pine range in Georgia. Forage intake of native forage. terming the digestibility of a diet. Jour. Nutr. 41: 629. s a m p 1 e s approximating t h e LITERATURE CITED
cattle diet were used to deter- ASSOCIATION OF OFFICIAL AGRICUL- WILLIAMS, R. E., J. T. CASSADY L. K. HALLS, AND E. J. WOOLFOLK. 1955. mine chemical composition and, TURAL CHEMISTS. 1950. Official Range resources of the South. Ga. with fecal samples, to determine methods of analysis. Ed. 7, 910 pp. Agr. Expt. Sta. Bul. (n. s.) 9, 31 digestibility of the native forage. ’ Washington, D.C. PP.
The data revealed a rather
clearcut relationship between Table 4. Daily infake of forage and of digestible nufrienfs by cows grazing seasonal trend in nutritive value native range.
of the animal diet, amount of
forage consumed, and weight Digestible nutrients’
changes of cows. Chemical com- Ether
position of diet was influenced Date of Green forage Dry extract Carbohy-
by season as well as kind of collection (as fed basis) forage Protein X 2.25 drates T.D.N. plants consumed. Digestion co- __---_ (Pounds) - - - -
efficients decreased gradually April 56.40 20.46 .65 .43 7.76 8.84
from April through September June 50.91 19.58 .48 .17 7.21 7.86
The Relationship Between Depth Of Planting
And Maximum Foliage Height Of Seedlings
Of Indian Ricegrass’
FLOYD E. KINSINGER
Associate Plant Ecologist,2 Nevada Agricultural Experi- ment Station, University of Nevada, Reno
Indian ricegrass (Oryxopsis
hymenoides Roem. and Schult.)
is a component of the deserts and
plains flora. It is found through-
out Nevada principally on well-
drained soils at elevations from
4,000 to 7,000 feet but is most
common on arid winter ranges in
the southern part of the state. In
some areas, it is an important
constituent of the plant popula-
tion and provides abundant nu-
tritious forage w h e n growing
conditions are favorable (Figure
1).
Conservationists have recently
shown an increasing interest in
the use of Indian ricegrass in
attempts at seeding arid ranges
where crested wheatgrass is not
well adapted. However,
the
literature reveals that little ex-
perimental seeding has b e en
done with Indian ricegrass, per-
haps because the hard, imperme-
able seed coat makes large-scale
seedings with this species an un-
certainty. Until a commercial
seed source is available and the
impermeable seed coat can be
eliminated by the plant breeders
or scarified in sufficient quan-
tity, large scale seedings with
this species will probably not be
attempted.
Information concerning depth
of planting as related to foliage
IData contained herein were collec- ted as a part of Nevada Agricul- tural Experiment Station Project 4 with land and facilities made avail- able through the cooperation of the Truckee-Carson Irrigation District, Agricultural Research Service, and the Bureau of Land Management.
2Present addre8s: Division of Bio- logical Science, Fort Hays Kansas State College, Hays, Kansas.
height of Indian ricegrass seed-
lings seems particularly impor-
tant before attempts are made to
seed any sizeable acreage. Dur-
ing the spring of 1956, 1957, 1958,
and 1960 excellent reproduction
of Indian ricegrass occurred on
deep sandy soil and provided an
opportunity to study natural
germination and growth of seed-
lings.
Procedure
The principal study location
was 2 miles north of Fernley,
Nevada, on a beach remnant of
prehistoric Lake Lahonton. The
soil is gravelly sand of very low
fertility. Measurements of the
depth of seed germination and
maximum foliage height of the
seedlings were recorded for ap-
proximately 250 seedlings each
spring at the Fernley site. An-
other 250 seedlings growing on
active sand dunes 25 miles east
of Fallon, Nevada, were meas-
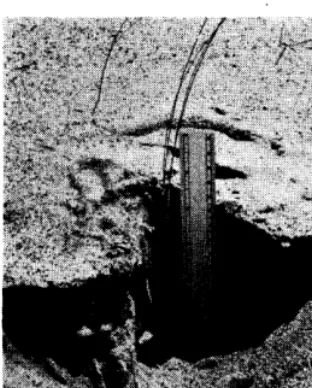
ured in 1958. The germinated
seeds were exposed by careful
excavation (Figure 2) and the
depth of the seed below the soil
surface and the maximum height
of foliage was recorded for 1125
seedlings during
4 years of
study.
One-hundred seedlings were
located with small iron stakes
and measured periodically to de-
termine any changes occurring
in the relationship of foliage
height and depth of seed, and
also, to determine longevity of
seedlings.
In order to determine if in-
creased soil moisture at deeper
soil depths influenced quicker
germination and m o r e rapid
elongation of the seedling, the
following experiment was con-
ducted. Seeds of Indian ricegrass
were planted in the greenhouse
at depths ranging to 80 mm. in
a container 2 ft. by 10 ft. by 1
foot deep filled with sand from
the Fernley site. The sand was
kept moist throughout to deter-
mine if the same relationship
between f o 1 i a ge height and
depth of seed existed when mois-
ture was not limiting.
Correlation and regression co-
effecients and statistical signifi-
cance for linearity of regression
were determined for the meas-
FIGURE 1. Large areas of arid western grazing lands support an abundance of Indian
ricegrass when conditions are favorable.
FIGURE 2. Seedlings were excavated to the depth of seed germination by carefully re- moving the sand or soil.
urements made each spring and for the total of all measurements.
Results and Discussion Average depth at which seed germinated and height of foliage for all seedlings was 59.0 and 181.2 mm., respectively (Table 1). Height of foliage varied ac- cording to the particular grow- ing conditions d u r i n g early spring and the time of measure- ment and had no particular im- portance in the study reported here except as it related to the depth at which the seed germi- nated.
The correlation coefficient be- tween depth of seed and height of foliage for the total of 1125 observations was r = 0.508 and was highly significant (Table 1, Figure 3). The positive correla- tion indicates t h a t the most deeply planted seed produced foliage of g r e a t e r maximum height and suggests that mois- ture in the deeper soil provides an advantage for deeper germi- nating seeds. However, a green- house experiment in which mois- ture was not a limiting factor at any depth showed also a signifi- cant and positive correlation be- tween depth of seed and height of foliage. Moisture, therefore, apparently has little influence on the relationship between depth
INDIAN RICEGRASS
of seed and foliage height of seedlings but undoubtedly plays an important role in growth of Indian ricegrass after the seed- ling becomes established.
Seedlings from seed which germinated at lower depths in the sand had longer, more slen- der and delicate stems and leaves, such as etiolated seed- lings might have, than the thick sturdy stems and more tillers of the seedlings from s h a 11 o w planted seeds (Figure 4). The possibility that light or heat may inhibit the germination of seeds nearer the soil surface was not investigated. However, germina- tion of seeds of some species is retarded or even prevented by light (Curtis and Clarke, 1950; Meyer and Anderson, 1952). Ger- mination of lettuce seed is in- hibited by light of certain wave lengths and is favored by light of other wave lengths (Flint and McAlister, 1935 and 1937). Ger- mination of seeds of many mem- bers of the lily family is in- hibited or retarded by exposure to light (Cracker, 1936). The possibility that germination of even the most shallow seeds (19 mm.) of Indian ricegrass was in- fluenced by light appears doubt- ful. Perhaps some of the growth responses of Indian ricegrass were due to the phytochrome pigment which is known to in- f 1 u e n c e photoperiodism and many other aspects of plant growth resulting in a general control of growth by light (Borthwick and H e n d r i c k s,
11
1960). These authors state that
“in nature, the shoot from a deeply planted seed elongates until the food reserves are ex- hausted or until it reaches the surface and is exposed to light, which inhibits further lengthen- ing.”
In 1957, the depth of germinat- ing seed and maximum foliage height of 100 seedlings were measured and marked with near- by iron stakes so that measure- ments might be taken periodical- ly. Measurements made on April 26, 1957, of seed depth and foliage height were highly sig- nificantly correlated, r = 0.397
(Figure 5). Measurements were again made on May 27, 1957, but only 88 seedlings survived since the 1 as t measurement. Seed depth was assumed to be the same and foliage height in- creased from 171.8 mm. to 191.3 mm. The correlation coefficient for the May 27 measurements was r = 0.562 (Figure 5). Measurements of foliage height made a year later, April 30, 1958, of 71 surviving seedlings showed an even greater correlation, r = 0.736, with depth of germi- nating seed as measured earlier. In 1960, only 8 of the original plants remained alive. Increas- ing r valves with successive measurements suggest that those seedlings in which seed depth and foliage height are best cor- related are the surviors. Sixteen, 32, and 54 percent of the varia- tion in foliage height was due to variation in depth of seed of
TABLE 1. Average depth of seed and maximum height of foliage of Indian ricegrass when measured on dates indicaied and correlation coefficients (r) between depth of seed and maximum height of foliage.
Date Depth of Height of Correlation measured seed, mm. foliage, mm. coefficient
___-__ __~ _______~.
May 26, 1956 51.9 (22-7911 144.1 (70-206) 0.431”’ April 26 to May 10, 1957 53.1 (19-97) 187.1 (78-305) 0.588* * April 30, 1958 57.7 (25-92) 170.3 (74-252) 0.591** May 10, 19582 77.0 (28-141) 207.6 (95-361) 0.565** May 12, 1960 ____ 62.3 (28-115) 150.8 (80-231) 0.478** Average of all observations 59.0 181.2 .508** **Indicates significance at the 1 per cent level of probability.
iRange of measurements in parenthesis.
KINSINGER
Maximum foliage height, m m
FIGURE 3. Regression line of maximum foliage height of Indian ricegrass seedlings as
related to depth of germinating seed.
measurements made on April 26
and May 27, 1957, and April 30,
1958, respectively. The da t a
suggest that depth of germinat-
ing seed has an increasing influ-
ence on foliage height as the
seedlings become older.
Of the 1125 seedlings measured
since 1956, 62.4 percent of the
seed germinated at depths rang-
ing from 41 to 70 mm. or from
1.6 to 2.8 inches (Table 2). Ap-
proximately 20 percent of the
seed germinated in each of the
ranges from 41 to 50, 51 to 60,
and 61 to 70 mm. Below 41 mm.
and above 70 mm. seed depth,
TABLE 2. Various depths and per-
cenf of fofal of germinating seed of Indian ricegrass under natural condifions on sandy soil.
Depth of
Percent
of totalgermination, mm. germinating seeds
10 o? less 0
11-20 0.4
21-30 3.2
31-40 11.2
41-50 20.0
51-60 22.0
61-70 20.5
71-80 11.0
81-90 6.3
91-100 2.4
100 or more 3.0
germination and emergence were
greatly reduced.
Summary and Conclusions
The depth of germinating seed
and maximum foliage height of
1125 seedlings of Indian ricegrass
has been measured since 1956.
The seedlings were growing on
sandy soils of low fertility under
natural climatic conditions at
Fernley and Fallon, Nevada.
Correlation and regression co-
efficients and statistical signifi-
cance for linearity of regression
were determined to learn the in-
fluence of depth of germinating
seed on maximum
foliage
growth.
A positive and highly signifi-
cant correlation was found to ex-
ist between depth of seed and
maximum foliage height. Re-
sults indicate that deeper seeds
have an advantage, perhaps bet-
ter moisture, for germination and
growth over seeds planted shal-
low. However,
greenhouse
studies indicate the same rela-
tionship exists when moisture is
ample at all soil depths. The
presence or absence of soil mois-
ture undoubtedly plays a promi-
nent role in growth after the
seedling becomes established.
The long, slender,
delicate
seedlings from seed at deeper
depths suggested that light or
FIGURE 4. Three seedlings on the left illustrate the growth response to deeply planted
seeds; seedlings on the right developed from seed planted shallow. Short horizontal lines
indicate the soil surface. Average depth of seedlings on the right was 41 mm. and
average maximum height of foliage was 172 mm. ; on the left, average depth was 80 mm.
INDIAN RICEGRASS
/’
---
May 27. 1957809 -- - - April 30. 1958
70 - / / ,’
0 /
60 -
IO -
. L I I I I I I I I I I 1
140 150 160 170 180 190 200 210 220 230 240 250 260
Maximum foliage height, mm
FIGURE 5. Regression lines of maximum foliage height of 100 marked Indian ricegrass seedlings as related to depth of germinating seed when measured on April 26 and May 27, 1957, and April 30, 1958.
heat may inhibit germination at
shallow depths. However, this
assumption was not investigated.
Correlation coefficients
of
depth of seed and height of foli-
age of 100 marked seedlings
measured on April 26 and May
27, 1957, and again on April 30,
1958, were r= 0.397, 0.562, and
0.736, respectively. Of the 100
original seedlings, 88 percent
survived on May 27 and 71 per-
cent on April 30.
As the seedlings became older,
depth of seed had more influ-
ence on maximum foliage height.
For instance, when the seedlings
were first measured on April 26,
16 percent of the variation in
foliage height was due to varia-
tion in depth of seed. On May
27, 1957, and April 30, 1958, the
values were 32 and 54 percent,
respectively. Seedlings in which
depth of seed and foliage height
were best correlated were the
survivors of the original 100
seedlings.
Average depth of seed of all
seedlings measured was 59.0 mm.
or 2.3 inches. Sixty two percent
of the seed germinated between
depths ranging from 1.6 to 2.8
inches. When seeding Nevada’s
arid southern rangelands to In-
dian rice grass, planting the seed
at this range of depths has dis-
tinct advantages: (1) the seed is
placed nearer the limited soil
moisture and (2) away from
high soil surf ace temperatures
common on southern
desert
13
ranges. However, seedlings from
seed planted deep are slender
and delicate compared to more
tillers and thick, sturdy stems of
seedlings of shallow
planted
seed.
Recommendations for most
grass species state the seed
should be planted at depths of
one-fourth to one-half inch. Few
grass species can be planted
deeper than 1 inch and produce
a crop. Indian ricegrass seed is
unique in that the majority of
seed will germinate and emerge
from depths up to 3 inches in a
sandy soil providing distinct ad-
vantages in seeding arid ranges
which have loose, sandy, well-
aerated soils.
LITERATURE CITED BORTHWICK, H. A., AND S. B. HEN-
DRICKS. 1960. Photoperiodism in plants. Science 132: 1223-1228. CROCKER, W. 1936. Effects of the
visible spectrum upon the germi- nation of seeds and fruits. In Bio- logical Effects of Radiation. II. Edited by B. M. Duggar: McGraw- Hill Book Co., Inc. pp. 791-827. CURTIS, OTIS F. AND DANIEL G. CLARK.
1950. An Introduction to Plant Physiology. McGraw-Hill B o o k Co., Inc., 752 pages.
FLINT, LEWIS H., AND E. D. Mc- ALISTER. 1935. Wave lengths of radiation in the visible spectrum i n h i b i t i n g the germination of light-sensitive seed. Smithsonian Misc. Collect. 94(5) : l-11.
__..___._.._____.__.___. and ___.____________________. 1937. Wave lengths of radiation in the visible spectrum promoting the germination of light-sensitive lettuce seed. Smithsonian Misc. Collect. 96 (2) : l-8.
MEYER, BERNARD S. AND DONALD B. ANDERSON. 1952. Plant Physiology, 2nd edition. D. Van Nostrand Co., Inc., 784 pages.
RANCH *
Management Service * Consulting and Appraisals* Reaeeding Contractore * Ranch Loans Throughout the Western States and Canada, Call or Write:
R. B. (Dick) Peck, WESTERN RANCHING SERVICES