Biome Composition in Deforestation
Deterrence and GHG Emissions
in Brazil
CoPS Working Paper No. G-274, July 2017
The Centre of Policy Studies (CoPS), incorporating the IMPACT project, is a research centre at Victoria University devoted to quantitative analysis of issues relevant to economic policy. Address: Centre of Policy Studies, Victoria University, PO Box 14428, Melbourne, Victoria, 8001 home page: www.vu.edu.au/CoPS/ email: [email protected] Telephone +61 3 9919 1877
Joaquim Bento de Souza Ferreira Filho
Escola Superior de Agricultura “Luiz de Queiroz”,
University of São Paulo, Piracicaba, SP, Brazil
And
Mark Horridge
Centre of Policy Studies, Victoria University
Biome composition in deforestation deterrence
and GHG emissions in Brazil
Joaquim Bento de Souza Ferreira Filho
Escola Superior de Agricultura “Luiz de Queiroz”, University of São Paulo, Piracicaba, SP, Brazil.
Mark Horridge
Centre of Policy Studies, Victoria University, Melbourne, Australia
Abstract
We analyze the Brazilian commitments to COP21 under different scenarios, with a
general equilibrium model of Brazil developed for land use change and GHG emissions
analysis. The model is dynamic, inter-regional and bottom-up, and here distinguishes 16
regions and 6 biomes. We simulate different scenarios of future deforestation, including
the halt of illegal deforestation, the restoration of 12Mha of forests, and replacing
deforestation in the Amazon biome by deforestation in the Cerrado biome. Our analysis shows that the restoration of 12 Mha of forests would be enough to meet Brazil's 2025
commitments with no other extra GHG savings efforts, but would not meet 2030
commitments. Exchanging deforestation in the Amazon biome for deforestation in the
Cerrado biome would seriously compromise the accomplishment of the targets. We note
that emissions in the general economy are increasing in Brazil, suggesting that other
efforts must be made to meet the COP21 targets.
Keywords: Brazil, deforestation, CO2, Cerrado, Amazon
JEL Codes: C68, D58, E47, Q53, Q54, R14.
Contents
1. Introduction and motivation 1
2. Objective 3
3. Methodology 4
4. Scenarios and simulation strategy 4
5. Emissions in the baseline 8
6. Results 9
7. Final remarks 13
Biome composition in deforestation deterrence
and GHG emissions in Brazil
1Joaquim Bento de Souza Ferreira Filho2
Mark Horridge3
1. Introduction and motivation
Brazil has committed to ambitious targets in the United Nations Conference on Climate
Change in Paris (COP21). The proposed targets represent emissions of 1.32 GtCO2 in
2025 (target) and 1.2 GtCO2 in 2030 (reference), and fall in the range determined by the
Climate Change National Policy of 2010 (PNMC), where the targets for 2020 were set
between 1.168 and 1.259 GtCO2 (MCTI, 2014). The targets represent reductions of
37% in total emission in 2025, and 43% in 2030. With this, Brazilian per capita
emis-sions reduce from 14.4 tCO2 eq in 2004 to 6.2 tCO2 eq in 2025 and 5.4 tCO2 eq in
2030 (MCTI, 2014).
The accomplishment of the Brazilian intended Nationally Determined Contribution
(iNDC) relies heavily on deforestation reduction. Brazil has made enormous progress in
curbing deforestation in the tropical Amazon, mostly from years of investment in
sur-veillance methods, and command-and-control policies. But deforestation has increased
again in recent years, due to poor law enforcement: deforestation in the Amazon biome
reached an estimated 0.8 million hectare (Mha) in 2016, after a low of 0.46 Mha in
2014. Although still less than the 1995 peak of 2.9 Mha, this raises concerns about
fu-ture deforestation.
The figures presented above, however, refer only to deforestation in the Amazon
biome. Most of the economic literature on deforestation in Brazil concentrates on this
biome, reflecting worldwide concern about tropical deforestation. But this concern
overshadows deforestation in other very important biomes in Brazil, especially the
Cer-rado (savannah) biome4. The Cerrado comprises an area of approximately 203 Mha
(IBGE, 2004), located mostly in central Brazil. It is the second largest biome in South
America, and occupies 25% of Brazil, spread over many different states. Most of the
1
The authors are grateful to Instituto Escolhas and Vinicius Guidotti de Faria, from Imaflora, for invalu-able support on data compilation. Errors and omissions are author´s own responsibility.
2
Professor, Escola Superior de Agricultura “Luiz de Queiroz”, University of São Paulo, Piracicaba, SP, Brazil. Corresponding author. Email: [email protected]
3
Professor, Centre of Policy Studies, Victoria University, Melbourne, Australia.
4
grain (soybeans and corn) and cotton production areas in center-west and west regions
in Brazil are located in this biome.
Deforestation policies have focussed much less on the Cerrado biome than the
Amazon. Consequently the rate of deforestation in the Cerrado has increased rapidly,
reaching a peak of 0.75 Mha in 2012 — higher than the annual area deforested in the
Amazon biome in some years (Table 1). Although there is less information on
defor-estation in this biome, it is well known in Brazil that agriculture is spreading rapidly in
Cerrado areas.
Table 1. Annual deforestation in the Amazon and Cerrado biomes. Brazil. Million Hectare.
2005 2006 2007 2008 2009 2010 2011 2012 2013 2014 2015
Amazon 2.337 1.383 1.310 1.292 1.113 0.637 0.558 0.435 0.534 0.506 0.604
Cerrado 0.476 0.347 0.437 0.370 0.294 0.364 0.729 0.752 0.418 0.447 0.341
Source: LAPIG (Laboratório de Processamento de Imagens e Geoprocessamento) (2015) SIAD-Cerrado; and PRODES.
This has important environmental consequences, since the rate of GHG emissions is
higher in the Amazon biome than in the Cerrado. Since the surveillance and
enforce-ment of deforestation control is much weaker in the Cerrado, it is possible to observe a
spillover effect of deforestation from the Amazon biome to the Cerrado biome. Indeed
compensation for a halt of deforestation in the Amazon biome through more
deforesta-tion on the Cerrado biome has been advocated as a way to keep Brazilian agriculture
and rural income growing5.
Note that the Brazilian compromise in COP21 refers to the elimination of illegal
deforestation, and not of total deforestation. Although it is not possible to know the
ex-act amount of illegal deforestation (since part of it is located on privately-owned land),
it is possible, using satellite imagery techniques, to observe the part located on public
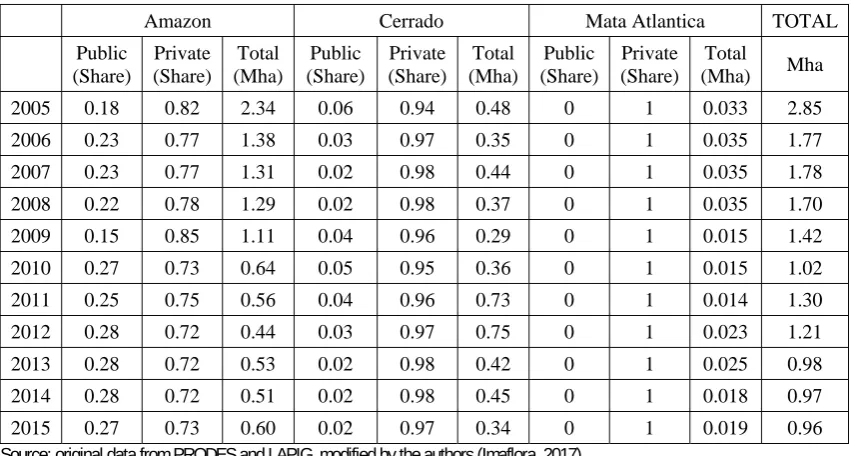
and protected land6 (Table 2).
The amount of illegal deforestation in public land is consistently higher in the
Amazon biome than in the Cerrado. This reflects in part the fact that most of the
pro-tected land is Amazon biome, a consequence of the previously-mentioned lack of
con-cern about deforestation in Cerrado. The observed share of total deforestation on public
land in the Amazon biome (which, as pointed out above, is a floor for total illegal
de-forestation) is consistently above 0.25 in the last five years and increased in the recent
period, while almost all deforestation in the Cerrado area is on private land.
5
See, for example, a newspaper article by Jank (O Estado de São Paulo, July 17, 2013).
6
Table 2. Share of deforestation in public and private lands, by biome, and total deforestation (Mha). Brazil.
Amazon Cerrado Mata Atlantica TOTAL
Public (Share) Private (Share) Total (Mha) Public (Share) Private (Share) Total (Mha) Public (Share) Private (Share) Total (Mha) Mha
2005 0.18 0.82 2.34 0.06 0.94 0.48 0 1 0.033 2.85
2006 0.23 0.77 1.38 0.03 0.97 0.35 0 1 0.035 1.77
2007 0.23 0.77 1.31 0.02 0.98 0.44 0 1 0.035 1.78
2008 0.22 0.78 1.29 0.02 0.98 0.37 0 1 0.035 1.70
2009 0.15 0.85 1.11 0.04 0.96 0.29 0 1 0.015 1.42
2010 0.27 0.73 0.64 0.05 0.95 0.36 0 1 0.015 1.02
2011 0.25 0.75 0.56 0.04 0.96 0.73 0 1 0.014 1.30
2012 0.28 0.72 0.44 0.03 0.97 0.75 0 1 0.023 1.21
2013 0.28 0.72 0.53 0.02 0.98 0.42 0 1 0.025 0.98
2014 0.28 0.72 0.51 0.02 0.98 0.45 0 1 0.018 0.97
2015 0.27 0.73 0.60 0.02 0.97 0.34 0 1 0.019 0.96
Source: original data from PRODES and LAPIG, modified by the authors (Imaflora, 2017).
This means deforestation will not stop completely as a result of the Brazilian
com-mitments to COP21, since there is still a significant amount of land available for legal
deforestation in Brazil. Imaflora (2017, personal communication) estimates that there
are still around 36 Mha of land under natural forests, with high and very high
agricul-tural potential, sitting in private lands which can be legally cleared7. This trade-off
be-tween deforestation in the Amazon versus Cerrado biomes must be taken into account to
properly assess the COP21 Brazilian commitments.
2. Objective
In this paper, we evaluate the Brazil´s commitment to COP21, with a particular focus on
deforestation and land use targets. The trade-off between deforestation in the Amazon
versus the Cerrado biomes is central to the discussion.
This paper contributes to the existing literature in bringing new information from
satellite imagery to the analysis, in order to highlight the role of deforestation in the
Cerrado biome in the adjustment. This updates and extends results presented in Ferreira
Filho and Horridge (2016), which considered only deforestation in the Legal Amazon in
the baseline, by including deforestation in the Cerrado biome both in the baseline and in
different deforestation scenarios. We use new satellite imagery data (Imaflora, 2017) on
deforestation by biome, as well as on private vs. public land to perform the analysis.
7
3. Methodology
We use a multi-period computable general equilibrium model of Brazil, based on
previous work by Ferreira Filho and Horridge (2014, 2015, and 2016) to analyze the
consequences of different scenarios of deforestation for Brazilian commitments to
COP21. The model includes annual recursive dynamics and a detailed bottom-up
regional representation of Brazil, with up to 27 states, 110 products and 110 activities,
10 household types, and 10 labor grades.
The model has a matrix to track emissions in the economy, where emissions in each
region are associated with each productive sector and final demand, and can be of two
broad types: emissions from fuel use and emissions associated with the level of activity
of each sector (like fugitive emissions in mining, or CH4 emissions in livestock, for
example). All emissions of original GHG gases are transformed to CO2 equivalents
using the Global Potential Warming for 100 years (GPW-100) coefficients from the
IPCC Second Assessment Report –SAR (IPCC, 1996).
Emissions from land use change (LUC) are tracked by two additional matrices:
(1) A transition matrix for LUC tracks land use transitions in each state, observed from
satellite imagery data of Brazilian land use changes between 1994 and 2002. We
processed this data to distinguish land areas used for three broad types of agriculture,
Crop, Pasture, and Plantation Forestry, and one residual type referred as 'Unused', which
is mainly natural forest. We distinguished regional land use by state, and within each
state by six soil/vegetation zones (biomes): Amazon (Amazon forest), Cerrado
(Savannahs), Caatinga, Mata Atlantica (Atlantic Forest), Pampa, and Pantanal. The data
shows how many hectares of, say, the Cerrado biome in Mato Grosso state, was Unused
in 1994, and also how much of that 1994 Unused area was used in 2002 for, say, Crops,
or was still Unused. Thus the data comprises, for each of six biome zones within each
state, a full transition matrix between the four broad land uses.
(2) A GHG emissions matrix associated with the LUC matrix, which shows observed
emissions on transitions, by state and biome. This allows a detailed accounting of
emissions from LUC, and the computation of sinks on forest restoration.
4. Scenarios and simulation strategy
We start with a historical simulation to update the database from 2005 (the calibration
year) to 2016. In this period, observed macroeconomic data, as well as aggregated data
on agriculture and land use, are imposed on the model, replicating the observed
evolu-tion pattern. After the historical period, we develop a baseline until 2030, using
change, both in the historical and in the forecast period, are by state and biome,
captur-ing regional differences in Brazil (Table 3). We used a GDP growth of 2.5% per year in
the projections, as well as population growth rates by state projected by IBGE (2016)8.
Of particular importance, both in the historical period and in the baseline
projec-tions, is the evolution of deforestation in different biomes. We obtained data for
defor-estation in three out of six biomes of Brazil: Amazon, Cerrado and Mata Atlantica.
Those three biomes (notably the Amazon and Cerrado) currently account for most
de-forestation in Brazil. The projected rates of dede-forestation follow the observed rates in
the last five years for Amazon and Mata Atlantica, and the last three years for the
Cer-rado9.
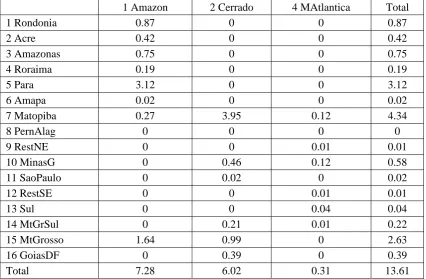
Table 3. Projected deforestation in the simulations, total 2016-2030 (forecast period). Mha.
1 Amazon 2 Cerrado 4 MAtlantica Total
1 Rondonia 0.87 0 0 0.87
2 Acre 0.42 0 0 0.42
3 Amazonas 0.75 0 0 0.75
4 Roraima 0.19 0 0 0.19
5 Para 3.12 0 0 3.12
6 Amapa 0.02 0 0 0.02
7 Matopiba 0.27 3.95 0.12 4.34
8 PernAlag 0 0 0 0
9 RestNE 0 0 0.01 0.01
10 MinasG 0 0.46 0.12 0.58
11 SaoPaulo 0 0.02 0 0.02
12 RestSE 0 0 0.01 0.01
13 Sul 0 0 0.04 0.04
14 MtGrSul 0 0.21 0.01 0.22
15 MtGrosso 1.64 0.99 0 2.63
16 GoiasDF 0 0.39 0 0.39
Total 7.28 6.02 0.31 13.61
OBS: (1) Maranhão, Tocantins,Piauí and Bahia. (2) Pernambuco and Alagoas; (3) Rest of Northeast states; (4) Rest of Southeast states.
We can see from Table 3 the result of our hypothesis regarding deforestation in the
baseline. The Amazon and Cerrado biome would have most of the land clearing in the
period, respectively 7.28 Mha and 6.02 Mha. Deforestation in the Mata Atlantica biome
is very low presently, due to depletion of stocks and protection policies, but this biome
will play an important role in forest recovery, one of the Brazilian targets in the iNDC.
8
The Brazilian iNDC considers a much higher, GDP growth projection, around 4% per year until 2030. Our estimates of emissions, then, are conservative, although probably more realistic, compared to the original iNDC.
9
In the baseline projections, we considered that the rate of illegal deforestation in
public lands would be the same (average) as in the observed period, since the Brazilian
targets for COP21 entail stopping this kind of deforestation in 2030. For private land,
however, projections took into account the amount available for legal deforestation
(Imaflora, 2017), stopping land clearing in states where and when this stock depleted.
This happened in the Amazon biome in the states of Maranhão and Tocantins in 2022,
and Rondonia in 2023. In the Cerrado biome the limit was only reached in the state of
Parana (in the RestSE region), in year 2021.
Next, we implement policy simulations comprising the land use targets in the
Bra-zilian commitments to COP21, namely:
Scenario1 (SCEN1): The deterrence of illegal deforestation until 2030. In this sce-nario 2.25 Mha of forests would be spared from clearing.
Scenario 2 (SCEN2): Includes Scenario 1 plus the restoration of 12.3 Mha of forests until 2030.
Scenario 3 (SCEN3): The exchange of deforestation in the Amazon biome by defor-estation in the Cerrado biome. The amount of Amazon biome cleared in SCEN2 is
transferred to Cerrado biome, keeping total deforestation at the same level as in
SCEN2. This comprises a transfer of 7.3 Mha of forest clearing from the Amazon
biome to the Cerrado biome.
We now discuss the criteria used in each scenario. Scenario 1 just considers the
elimi-nation of deforestation in public areas, one of the Brazilian iNDC targets. We consider
only illegal deforestation in public (protected) areas, since it is not possible presently to
calculate how much illegal deforestation occurs in private areas, as mentioned above.
We expect that it will be possible in the near future, as registration of protected areas in
private properties becomes mandatory (the Cadastro Ambiental Rural: CAR). Our
es-timates in this scenario, then, are a lower limit for illegal deforestation, and represent a
“least effort” scenario in terms of enforcement.
Scenario 2 represents a more complete execution of the Brazilian commitments to
COP21, in terms of land use targets. The restoration target of 12 Mha until 2030 is a
general goal in the Brazilian iNDC, but lacks implementation details, especially
re-gional details. All the policies, measures and actions to implement the iNDC are under
the disciplines of the National Policy on Climate Change, the Native Forests Protection
Law (the Brazilian Forest Code) and of the Law of the National System of Conservation
Units (Brasil, 2015). We can use the estimates of natural vegetation debts (NVD) by
vege-tation. For that, we use estimates from satellite imagery (Imaflora, 2017) for the
differ-ent parts of NVD in the Forest Code, namely the Legal Reserves (RL) and Permandiffer-ent
Protected Areas (APP), to locate regionally the required afforestation. The hypothesis
used to build this scenario then are:
Illegal deforestation stops in 2030, starting to decrease linearly from 2020.
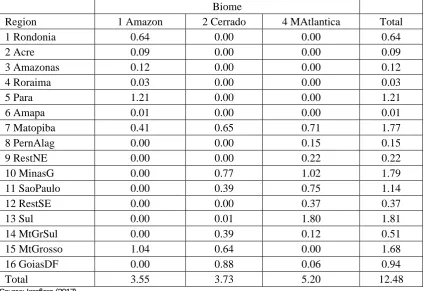
The restoration of NVD will start in 2016, and comprises all the APP and 50% of the RL deficits, giving total deforestation around 12.3 Mha (Table 4).
Following Soares-Filho et al (2014), and Ferreira Filho, Horridge and Diniz (2015), we assume that all land restoration would occur over pasture, instead of over crops.
Table 4. Scenario 2. Increase in natural vegetation stocks due to the Forest Code, in relation to the baseline, accumulated in 2030. Mha.
Biome
Region 1 Amazon 2 Cerrado 4 MAtlantica Total
1 Rondonia 0.64 0.00 0.00 0.64
2 Acre 0.09 0.00 0.00 0.09
3 Amazonas 0.12 0.00 0.00 0.12
4 Roraima 0.03 0.00 0.00 0.03
5 Para 1.21 0.00 0.00 1.21
6 Amapa 0.01 0.00 0.00 0.01
7 Matopiba 0.41 0.65 0.71 1.77
8 PernAlag 0.00 0.00 0.15 0.15
9 RestNE 0.00 0.00 0.22 0.22
10 MinasG 0.00 0.77 1.02 1.79
11 SaoPaulo 0.00 0.39 0.75 1.14
12 RestSE 0.00 0.00 0.37 0.37
13 Sul 0.00 0.01 1.80 1.81
14 MtGrSul 0.00 0.39 0.12 0.51
15 MtGrosso 1.04 0.64 0.00 1.68
16 GoiasDF 0.00 0.88 0.06 0.94
Total 3.55 3.73 5.20 12.48
Source: Imaflora (2017).
Table 4 shows that in the region called Matopiba (states of Maranhão, Tocantins,
Piauí and Bahia), for example, the Forest Code requirements would entail the
afforesta-tion of 0.41 Mha in the biome Amazon, 0.65 Mha in the biome Cerrado, and 0.71 Mha
in the biome Mata Atlantica, totaling 1.77 Mha of recovered forests. The Sul (South)
region would require 1.81 Mha of afforestation, mostly in the Mata Atlantica biome.
The model accommodates these changes by equivalent falls in the pasture areas in the
respective regions.
Finally, in Scenario 3 we examine the consequences of transferring deforestation
in the Amazon biome (in the baseline) to the Cerrado biome, distributed regionally in
proportion to the deforestation trend in the Cerrado.
5. Emissions in the baseline
As stated above, the Brazilian iNDC takes 2005 as the reference year for emissions.
This is a very favorable year for comparison, considering that the iNDC relies heavily
on deforestation control: as can be seen in Table 2, deforestation in Brazil considerably
reduced after 2005, causing a strong reduction in emissions associated to land use
change (LUC, Table 5). Emissions associated with general economic activity increased
by 37.1% from 2005 to 2015, while emissions associated to LUC reduced by 83.0% in
the same period, causing total emissions in Brazil to fall by 38.2% from 2005 to 2015.
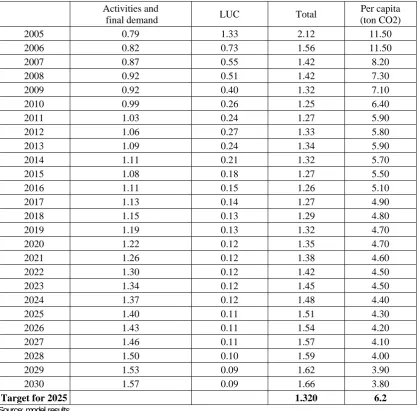
We see in Table 5 that the projected emissions in the Brazilian economy in the
baseline would come close to the targets for 2025 for total emissions, and would meet
the targets for “per capita” emissions. This, of course, depends a lot on the projected
deforestation trend, as well as on the projected GDP growth rate, since emissions from
other sources (economic activities and energy use) would still increase with our
pro-jected 2.5% increase in GDP in the baseline10. Our estimates show that total emissions
in 2025 would be 7.9% above the target in 2025, but below the target in terms of per
capita emissions. To reach the total emissions target would require extra efforts in other
parts of the economy.
We next analyze how different scenarios will change the baseline results.
10
Table 5. Emissions in the baseline, Gt CO2eq. General sources, Land Use Change (LUC) and Per capita.
Activities and
final demand LUC Total
Per capita (ton CO2)
2005 0.79 1.33 2.12 11.50
2006 0.82 0.73 1.56 11.50
2007 0.87 0.55 1.42 8.20
2008 0.92 0.51 1.42 7.30
2009 0.92 0.40 1.32 7.10
2010 0.99 0.26 1.25 6.40
2011 1.03 0.24 1.27 5.90
2012 1.06 0.27 1.33 5.80
2013 1.09 0.24 1.34 5.90
2014 1.11 0.21 1.32 5.70
2015 1.08 0.18 1.27 5.50
2016 1.11 0.15 1.26 5.10
2017 1.13 0.14 1.27 4.90
2018 1.15 0.13 1.29 4.80
2019 1.19 0.13 1.32 4.70
2020 1.22 0.12 1.35 4.70
2021 1.26 0.12 1.38 4.60
2022 1.30 0.12 1.42 4.50
2023 1.34 0.12 1.45 4.50
2024 1.37 0.12 1.48 4.40
2025 1.40 0.11 1.51 4.30
2026 1.43 0.11 1.54 4.20
2027 1.46 0.11 1.57 4.10
2028 1.50 0.10 1.59 4.00
2029 1.53 0.09 1.62 3.90
2030 1.57 0.09 1.66 3.80
Target for 2025 1.320 6.2
Source: model results
6. Results
Our purpose in this paper is to analyze how different scenarios will affect the Brazilian
targets, as proposed in the iNDC, focusing on the LUC issues. We first notice that the
macroeconomic effects on the whole economy are small (Table 6).
Table 6. Model results. Selected macroeconomic variables. Percent variation from baseline, accumulated to 2030.
SCEN1 SCEN2 SCEN3
Real Household consumption -0.11 -1.10 -0.02
Export Volume (index) 0.32 2.90 0.1
Real GDP -0.12 -1.10 -0.03
Aggregate employment 0 0 0.01
Real wage -0.25 -2.50 -0.07
Agriculture and livestock (primary) production account for 5.3% of Brazilian GDP
in 2013 (last year of published Brazilian National Accounts), making policy impacts
small in the whole economy. The most severe impacts appear in SCEN2, where a larger
amount of forests (12.3 Mha) would have to be restored. GDP loss in this case would be
1.10%, accumulated in 2030, and we refer to this value as the “shadow price” of
defor-estation, a social (partial)11 evaluation of deforestation values.
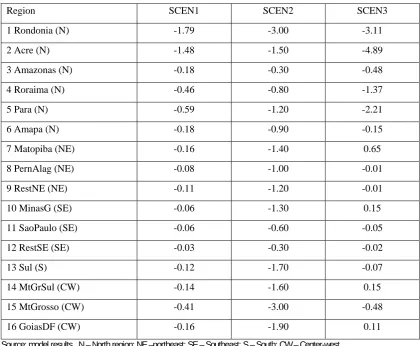
Strong differences, however, appear in regional economic losses (Table 7).
Table 7. Model results. Regional real GDP. Percent variation from baseline, accumulated to 2030.
Region SCEN1 SCEN2 SCEN3
1 Rondonia (N) -1.79 -3.00 -3.11
2 Acre (N) -1.48 -1.50 -4.89
3 Amazonas (N) -0.18 -0.30 -0.48
4 Roraima (N) -0.46 -0.80 -1.37
5 Para (N) -0.59 -1.20 -2.21
6 Amapa (N) -0.18 -0.90 -0.15
7 Matopiba (NE) -0.16 -1.40 0.65
8 PernAlag (NE) -0.08 -1.00 -0.01
9 RestNE (NE) -0.11 -1.20 -0.01
10 MinasG (SE) -0.06 -1.30 0.15
11 SaoPaulo (SE) -0.06 -0.60 -0.05
12 RestSE (SE) -0.03 -0.30 -0.02
13 Sul (S) -0.12 -1.70 -0.07
14 MtGrSul (CW) -0.14 -1.60 0.15
15 MtGrosso (CW) -0.41 -3.00 -0.48
16 GoiasDF (CW) -0.16 -1.90 0.11
Source: model results. N – North region; NE –northeast; SE – Southeast; S – South; CW – Center-west.
Note that, even though SCEN1 and SCEN3 caused very little (negative) GDP
im-pact at national level, their outcomes can be bigger than SCEN2 for some states.
SCEN1 is the elimination of illegal deforestation in Brazil that, as explained before,
refers to deforestation in publicly protected areas (natural parks and indigenous land).
As part of the Brazilian government strategy to protect the Amazon forest, almost all
such areas are located in the Amazon biome (North region of Brazil), and were created
as a “security belt” isolating the Amazon region from the advances of the arch of
defor-estation. Most of this scenario, then, affects states in the North region of Brazil, such as
11
Rondonia and Acre. Even though SCEN1 implies a reduction of only 2.25 Mha of
cleared forests compare to the baseline, most of it is concentrated on those states.
SCEN3, on the other hand, implies an economic trade-off between states in the
north region (Amazon biome) with states in the Center-west region (mostly Cerrado
biome), sparing 7.3 Mha of forests in Amazon biome matched by an equivalent amount
of extra Cerrado clearing. Thus this scenario implies a transfer of the agricultural
fron-tier from the North toward the Center-west, which would gain more in economic terms.
The states of Rondonia, Acre, Roraima and Para lose the most in terms of GDP, and
more than in SCEN2.
SCEN2 is the one that causes the larger GDP loss. In this scenario, 12.3 Mha of
forests must be recovered, the most among the three scenarios. But this is not the only
factor causing the higher impact. The regional distribution is very important, and can be
inferred from the higher losses of states in the Southeast, South and Center-west regions
when compared with the other scenarios. Apart from the land distribution in the shocks
(Table 4), higher land productivity in those states reinforce the higher economic losses
in those regions. As will be seen below, the biome composition in different states have
further implications for emissions.
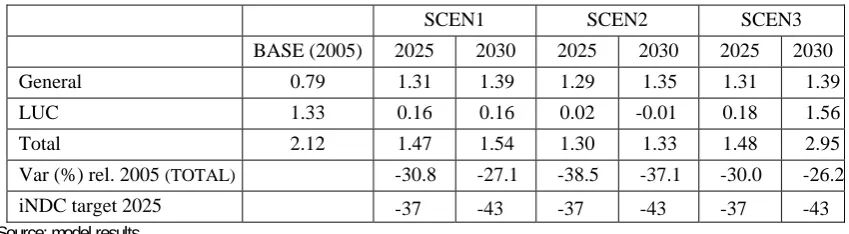
As explained before, Brazil committed to absolute targets for emissions in COP21.
As seen in Table 5, emissions in the model baseline would be 7.9% above the targets in
2025. Table 8 displays the results for the different scenarios.
Table 8. Emissions in the scenarios (Gt CO2 eq) and variation (percentage) in relation to 2005.
SCEN1 SCEN2 SCEN3
BASE (2005) 2025 2030 2025 2030 2025 2030
General 0.79 1.31 1.39 1.29 1.35 1.31 1.39
LUC 1.33 0.16 0.16 0.02 -0.01 0.18 1.56
Total 2.12 1.47 1.54 1.30 1.33 1.48 2.95
Var (%) rel. 2005 (TOTAL) -30.8 -27.1 -38.5 -37.1 -30.0 -26.2
iNDC target 2025 -37 -43 -37 -43 -37 -43
Source: model results.
Model results in Table 8 indicate that only SCEN2 meets the target for 2025, and
none would meet the target for 2030. We glean several insights related to the evolution
of emissions in Brazil.
First, we can see that merely curbing illegal deforestation (SCEN1) will not be
enough to meet the targets. Additional efforts will be required in order to save extra
emissions, either in LUC or in the other actions for the general economy, eg, improving
Second, SCEN2 would, by itself, reach the 2025 targets, with no extra effort from
the rest of the economy, but would not meet 2030 targets. Remember that SCEN2
en-tails the 12.3 Mha afforestation target. It is a rather aggressive scenario, especially
con-sidering the present Forest Code discussion, still under debate in the congress. Yet as
the economy grows in time, the gains from avoiding deforestation reduces in relative
terms12, leading to an increase in overall emissions after 2030, above the targets.
Results in the third scenario (SCEN3) are also very interesting. As explained
pre-viously, in this scenario we examine the argument that the avoided deforestation in the
Amazon biome should be compensated by more deforestation in the Cerrado biome.
Results show that from a purely economic standpoint this is, indeed, a less costly
ap-proach (see Table 6), even though the preference for preserving the Amazon biome to
the Cerrado is dubious, since the Cerrado is one of the world´s biodiversity hotspots.
However, from an emissions standpoint this scenario is even worse than SCEN1, where
only illegal deforestation is curbed. In our view, this is one important reason why this
argument should not be taken seriously. Even though the average emissions rate in the
Amazon biome are higher than in Cerrado, the emissions arising in Cerrado
deforesta-tion are also very important, and will certainly contribute decisively to the total results.
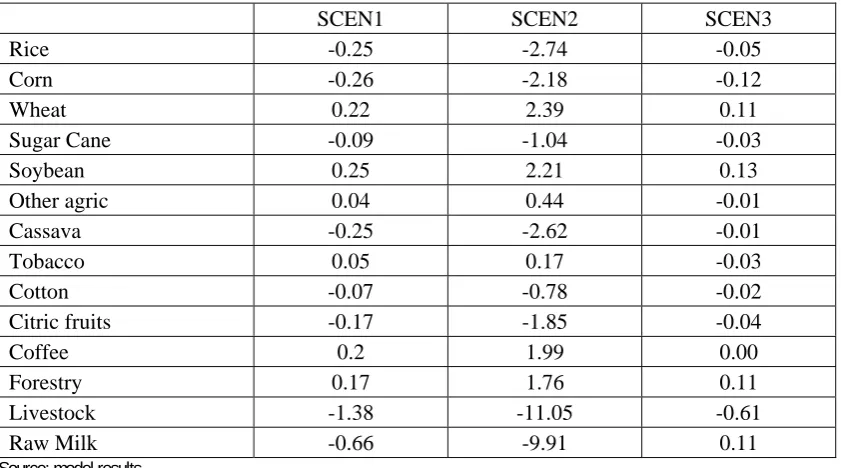
The fall in pasture areas will lead to a rearrangement of crop production, depending
on the regional composition of production. At the same time, the fall in primary factor
prices (notably labor and capital) lead to an expansion of some crops (Table 9).
Table 9. Model results. Production, percent variation from the baseline. Accumulated to 2030.
SCEN1 SCEN2 SCEN3
Rice -0.25 -2.74 -0.05
Corn -0.26 -2.18 -0.12
Wheat 0.22 2.39 0.11
Sugar Cane -0.09 -1.04 -0.03
Soybean 0.25 2.21 0.13
Other agric 0.04 0.44 -0.01
Cassava -0.25 -2.62 -0.01
Tobacco 0.05 0.17 -0.03
Cotton -0.07 -0.78 -0.02
Citric fruits -0.17 -1.85 -0.04
Coffee 0.2 1.99 0.00
Forestry 0.17 1.76 0.11
Livestock -1.38 -11.05 -0.61
Raw Milk -0.66 -9.91 0.11
Source: model results.
12
Notice that soybean production would increase in all scenarios, and more in
SCEN2. This happens because the model generates an exchange rate devaluation, which
pushes exports in general. Soybean is an important export product “in natura” in Brazil,
as well as an important feedstock for other important exported meat products, like
poultry. Combined with the fall in primary factor prices, substitution in production
would benefit soybean, generating a further expansion in its area and production.
We see, then, that LUC reduction, as predicted in the Brazilian commitments to
COP21, would be enough to meet the targets in 2025. This would require the restoration
of 12.3 Mha of forests, an uncertain prospect at this point, to say the least. There is little
doubt, then, that the adjustment will require extra effort by the rest of the economy,
es-pecially from agriculture and energy, the second and third most important sources of
emissions. But those two sources are currently increasing their emissions. Total
emis-sions net of LUC emisemis-sions increased by 10.9% in the period 2005-2010. In the same
period, agriculture increased emissions by 3.7% and energy by 18.65%.
7. Final remarks
Our results show that meeting afforestation targets in the Brazilian commitments to
COP21 would be enough to reach the emissions targets in 2025, although not in 2030.
This however depends crucially on the afforestation of 12.3 Mha of land, following the
Brazilian Forest Code provisions. How far this will be possible remains an open
ques-tion, given the present economic uncertainties, as well as uncertainties about the final
form of the Forest Code itself. Our simulation shows that this afforestation target would
be essential for Brazil to be able to meet its commitments with less effort from the rest
of the economy.
Likewise, our simulations show that exchanging deforestation in Amazon for
Cer-rado would not be an option in terms of emissions, and would be disastrous in terms of
the commitments to COP21.
The prospects for Brazil to meet its commitments in the Climate Convention, then,
will very likely depend more on efforts to reduce energy emissions than was believed at
first. On this front, however, the likely prospects are poor. The share of emissions of
agriculture and energy increased respectively by 18.6% and 3.7% between 2005 and
2010, and there is not much reason to believe that this trend has changed since.
Agri-culture has been the resilient sector in the Brazilian economy since the beginning of the
present economic crisis, and is even expanding, unlike the manufacturing sector. In
spite of present efforts to reduce emissions in agriculture (eg. the ABC Plan, a low
Finally, a note must be added regarding the emissions database. Our model
data-base is from the Second National Communication of Brazil to the United Nations
Framework Convention on Climate Change. As noticed by Rittl (2017), the Third
Communication, released in 2016 (too late to allow updating our database) updated the
emissions in the base period (2005) from 2.1 MtCo2 eq used as the reference in this
paper to 2.73 MtCO2 eq. With this, the iNDC 37% reduction in 2025 would imply an
emissions level of 1.7 MtCO2 eq, above the level obtained in the baseline. The Third
Communication, then, considerably reduces the severity of the commitments, in
abso-lute terms. Indeed, without a revision of the absoabso-lute targets, the commitments represent
an increase, instead of a decrease, of emissions in Brazil.
8. References
Ferreira Filho, J.B.S; Horridge, M. 2016. Reductions in land use change and agriculture GHG emissions in Brazil: the Brazilian commitment to COP21. In: 19th Conference on Global Economic Analysis, 2016, Washington, DC. Conference Papers, 2016.
Ferreira Filho, J. B.S; Ribera, L; Horridge, M. 2015. Deforestation Control and Agricultural Supply in Brazil. American Journal of Agricultural Economics, v. 97, p. 589-601. Ferreira Filho, J.B.S; Horridge, M. 2014. Ethanol expansion and indirect land use change in
Brazil. Land Use Policy. 36(1).
IBGE. Projeção da População do Brasil por sexo e idade: 2000-2060. Agosto de 2013. Available at
http://www.ibge.gov.br/home/estatistica/populacao/projecao_da_populacao/2013/default_ta
b.shtm.
IPCC, 1996. Climate Change 1995: The Science of Climate Change. Contribution of Working Group I to the Second Assessment Report of the Intergovernmental Panel on Climate Change [Houghton, J. T., L. G. Meira, A. Callander, N. Harris, A.Kattenberg and K. Maskell (eds.)]. Cambridge University Press, Cambridge, United Kingdom and New York, NY, USA, 572 pp.
Ministério da Ciência, Tecnologia e Inovação – MCTI. 2014. Estimativas anuais de emissões de gases de efeito estufa no Brasil. 2ª. Ed. Brasilia.
Ministério da Ciência, Tecnologia e Inovação – MCTI. 2016. Third National Communication of Brazil to the United Nations Framework Convention on Climate Change. Brasilia.
Rittl, C. 2017. Por que o novo inventário de emissões cria um bom problema para Michel Temer. Available at http://www.ghgprotocolbrasil.com.br/