Centre for Advanced Spatial Analysis University College London
1-19 Torrington Place Gower Street
London WC1E 6BT
Tel: +44 (0) 20 7679 1782 Fax: +44 (0) 20 7813 2843 Email: [email protected] http://www.casa.ucl.ac.uk
http://www.casa.ucl.ac.uk/visualcities.pdf
Date: October 2000
ISSN: 1467-1298
© Copyright CASA, UCL.
Paper by
Michael Batty† David Chapman¶, Steve Evans†, Mordechai Haklay†, Stefan Kueppers‡, Naru Shiode†, Andy Smith†, and Paul M. Torrens†
Abstract
There are now a wide array of new digital tools that are able to support the generic activity of planning and design. In urban design, these tools support different stages of the planning process which involve rapid and effective storage and retrieval of information, various kinds of visualization which inform survey and analysis as well as design itself, and different strategies for communicating information and plans to various publics from design professionals to the affected community. In this paper, we begin by noting the activities that such digital tools can support, emphasizing methods of visualization, and specifically focusing on integrated 2d mapping and 3d block modeling. We then review the state-of-the-art, world-wide, suggesting that there are rapid changes taking place in how such visualizations are being developed. We note developments in remotely sensed survey and in the development of 3d models integral to spatial databases as reflected in geographic information systems (GIS) in contrast to computer–aided design (CAD). We illustrate these ideas with respect to developments in world cities, specifically London, where we review initial attempts at the design of virtual cities. We then show two related but different ways of constructing such models: first in ad hoc fashion by linking various proprietary software based on internet GIS, rapid photorealistic CAD, and panoramic imaging; and second through a tighter coupling between 2d and 3d GIS which is highly suited to the new digital data from remote sources such as LIDAR (LIght Detection And Ranging). We conclude with a discussion of different ways in which these visualizations might be automated and delivered to users, in stand-alone manner or over the net.
Acknowledgements
1 Digital Tools to Support Urban Design
Design begins with the definition of a problem context that is informed by data collection, and subsequently supported through analysis. This problem context is successively defined and re-defined as the problem becomes better understood, and in highly intuitive design, these insights gradually merge the problem into its solution. In more self-conscious design, where solutions depend upon mobilizing the expertise of several diverse professionals and knowledge bases, the design process is usually constructed around a formal sequence of stages which are followed often in cyclic fashion. In urban design, the traditional sequence of survey – analysis – plan originally accredited to one of the founding fathers of town planning, Patrick Geddes, has been made explicit following models in systems engineering and decision theory. These begin with problem definition which involve the parallel activities of data collection and goal formulation, are followed by analysis, thence the generation of alternative plans or solutions, their evaluation against criteria emanating from the initial set of goals, and finally the choice of one plan which is elaborated and then implemented. Such formal planning processes are nested within the more routine process of implementing and monitoring plans, which in turn may involve many such cycles of design and decision at different levels (Batty, 1979). What makes these cycles converge is often some governmental mandate or in the case of commercially orientated decision-making, the need to produce viable and profitable solutions or products.
These various stages need to be communicated to a wide variety of affected parties. Communicating urban design ideas to professionals themselves is required throughout the process where the knowledge involved is never the prerogative of any single expert. Communicating ideas to clients, whether they be political decision-makers or the wider public, are key activities to the success or otherwise of the process. In urban design, the products or solutions – the plans – are ultimately visual in form, and the most effective way of communicating such ideas is inevitably visual too, notwithstanding the need to unpack such visualizations in functional, economic, and social as well as aesthetic terms. As visualization takes place at any and every stage of the design process, we must develop some rudimentary classification. A useful one is to distinguish between forward and backward visualization. Backward visualization involves developing visual tools and imagery which support experts and professionals, while forward visualization supports a less informed constituency, the public at large but more specifically particular interest groups. The same technologies might be used but as we will see, these need to be closely adapted to their context (Batty, Dodge, Jiang, and Smith, 1999).
access computers and networks currently is visual, it is not surprising that there are a wide array of digital tools which support specific visualizations relevant to urban design. Information of course is central to all stages of design, and as most information is now digital, then software tools to add value to this information for the purpose of design, are key to all planning processes. Spatial information systems in the form of GIS are thus critical to the initial stages of design when an understanding is being built of the problem context. But tools for converting spatial information into mathematically related models which inform analysis, prediction and optimization are also critical to good formal problem-solving and to the generation and evaluation of alternative plans. Developing systems which query and extract subsets of information in routine fashion are often a part of these tools, as in GIS, but it is in visualization – in converting information into visual products – that these new digital tools have the widest appeal. Frequently such visualizations are through maps and models, and it is important to be clear about this usage. Discussions of models identify different types from iconic through to symbolic with mathematical and computer models being closely associated with each other (Lowry, 1965). However, in the digital age, this no longer suffices for computer models may be closer to iconic – as in 3d visualizations of cityscapes – than to symbolic models built around urban processes which are simulated mathematically.
The models we refer to here are digital icons rather than simulations of urban processes and structures. In essence they are the digital form of the architect’s block model, traditionally made of balsa wood. But they are more than this in that as their form is built on a digital geometry, this geometry can be tagged with attributes that comprise spatial databases that can be interrogated and analyzed. In short, these models can be fashioned as GIS equivalents which move them beyond iconic form (Teicholz, 2000). Various functions can be embodied within them to the point of using their form and data as the geometric structure or skeleton on which the more symbolic models can be built. The way such visualizations are communicated, forward to the general public or backward to the professional, is equally varied. The desktop, laptop and palmtop are the traditional media but in the future, 2d maps with some 3d content will certainly appear on WAP (Wireless Applications Protocol) phones. At the high end, virtual reality (VR) displays such as those enabled through large screen theatres as well as the more esoteric media of the headset, CAVE (Cave Automatic Virtual Environments), and holobench are all being used to engage decision-makers (Batty and Smith, 2001).
large scale visualization in London. Most of these involve forward visualization – visualizations that have been produced for popular rather than professional audiences and which emphasize visual rather than functional attributes. We will then illustrate two somewhat different projects for developing backward visualization for professionals, the first based on ad hoc adaptations of existing software that we refer to as a loose coupling between CAD, GIS and multimedia; the second based on a stronger coupling in which 3d GIS with all the functionality of 2d GIS is the main platform for development.
2 The State-of-the-Art: Techniques for Constructing 3d City Models
2.1 The World-Wide Review
The GIS revolution has been intimately associated with our ability to visualize data in map and related statistical form and it might seem an obvious consequence that 3d visualization, which is a little more complex, is developing in its wake. But the extension to 3d is somewhat deeper in that our ability to render complex geometries has now become routinely embedded in standard hardware, while techniques for rendering based on new methods of digital photography have added to the kinds of realism that are now possible. Added to this is the increasing supply of remotely sensed data concerning the 3d environment, and 3d visualizations of cities are thus becoming feasible and popular. Games have added to this spin just as developments in areas such as robotics are finding their way into electronic toys.
The increasing momentum in this field was confirmed by our comprehensive review of projects world-wide which we carried out in March 2000 for the City (Corporation) of London, the borough which includes the financial quarter of the city. Using email targeted at the expert community, searches of the web, and surveys of the literature, we identified 63 serious applications. 38 of these being developed in cities with greater than one million population, in contrast to 25 for cities of lesser population. The larger, more complex, and wealthier the city, the more likely that such visualizations were being developed, with the most elaborate being New York, Tokyo, and Los Angeles (Delaney, 2000). For example, in Tokyo, we identified some at least 15 different applications although we only examined 8 in detail. We will review two of these in the next section but a list of all the million plus cities with web sites which illustrate some these projects, is reproduced in the Appendix.
• Emergency services: such as applications to problems of policing, security, fire access, and ambulance access. These kinds of applications largely dwell on the intricate geometry of the urban fabric and the need to understand how different locations can be accessed quickly.
• Urban planning: problems of site location, community planning and public participation all require and are informed by 3d visualization but detailed design reviews still form the main applications. The focus is upon aesthetic considerations and daylighting as well as upon issues involving landscaping and line-of-sight.
• Telecommunications: in particular the siting of towers for mobile and fixed communications is problematic in environments dominated by high buildings.
• Architecture: as in urban planning, site location and design review, in particular aesthetic issues and massing, are important factors as well as issues involving conservation and disruption to the urban environment.
• Facilities and utilities management: water, sewerage, and electricity provision as well as road and rail infrastructure all require detailed 2d and 3d data for their maintenance and improvement.
• Marketing and economic development: 2d and 3d models provide extremely rapid ways of visualizing the environment of the city, the locations of cognate uses, and the availability of space for development.
• Property analysis: related to economic development but also to the general development of the city. Methods for visualizing cities enable detailed data to be computed concerning floorspace and land availability as well as land values and costs of development.
• Tourism and entertainment: 3d models provide methods for displaying the tourist attractions of cities as well as ways in which tourists and other newcomers might learn about the geography of the city.
• Environment: 2d and 3d models enable various kinds of hazard to be visualized and planned for, in particular ways of visualizing the impact of local pollutants at a fine scale such as those associated with traffic.
• Education and learning: these kinds of visualization enable users at different levels of education to learn about the city as well as enabling other virtual experiences through the metaphor of the city.
• City Portals: using 2d and 3d models as the entries to urban information hubs
What we found was that the traditional methods of designing such models based on computer aided architectural design where detailed measurement of the geometry is the central activity and where geometric methods were employed to produce as detailed a rendering of the superficial structure as possible, are giving way to techniques based on spatial data analysis and GIS. The use of such models for analysis in the same way as GIS, for querying spatial data structures, and visualizing the results of such queries in 3d, requires GIS-like functionality. At the same time, rendering techniques based on new methods of imaging involving on the one hand, remotely sensed imagery and on the other, photorealism, are being incorporated into such visualizations. These are emerging from developments in geomatic engineering (Fuchs, 1996). All these approaches are now being supplemented by various ad hoc forms of multimedia which are developing as much in response to the dictates of visual content on the web as to intriniscally different ways of representing such media.
Finally, methods for delivering these visualizations are changing. Different types of desktop and workstation CAD and GIS are appearing which enable different scales of model to be displayed with much visualization shifting from the desktop to the web, In particular web-based visualization technologies such as VRML (Virtual Reality Markup/Modeling Language) are being used. The Planet9 examples which have been developed for many cities, use such technologies (http://www.planet9.com/). Finally, there is multimedia visualization based on various kinds of animation and photorealistic display which again support different types of application. We can summarize the examples which we present below as involving
• Different proprietary software systems involving 2d GIS, 3d CAD, and multimedia methods
• Different levels of spatial abstraction from high to low geometric content.
• Different types of data capture from detailed manual-based construction and rendering to fully automatic methods based on LIDAR
• Different methods for delivering visualization capability from the desktop to the web
2.2 Techniques of Construction: Capturing Heights and Facades
Against this background a spectrum of mapping solutions is appearing. These can be characterized in terms of their geometric content and range from 2d topographic mapping through to full 3d volumetric models which we can present as follows:
2d digital maps and digital orthophotographs Low geometric content
Image based rendering (including panoramic
imaging techniques and 2.5D image draping) ↓
Prismatic building models by building footprint
extrusion (Block modeling) ↓
Block modeling with image based texture mapping ↓
Modeling of architectural details including roof
morphology ↓
Full volumetric CAD modeling High geometric content
very detailed representation of an urban area complete with many of the features often omitted in 3d CAD models (people, vehicles, street furniture etc.). It is possible to generate geometrical models from sets of panoramic images but this is still a manual process and thus is rarely undertaken. One of the most advanced examples of such models is to be found in the MIT City Scanning project shown below (http://city.lcs.mit.edu/city/city.html) in Figure 1:
Figure 1: Panoramic Image from MIT City Scanning Project
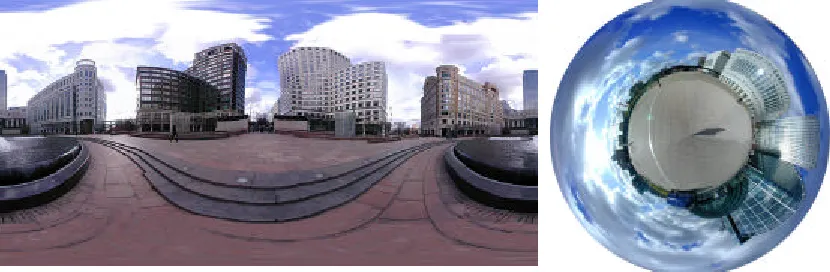
We have developed similar panoramics for Canary Wharf in London’s Docklands which will provide an important element of the visualization methodology that we develop later in this paper (Smith, 2000). We show these in Figure 2 in stretched panorama form as in Figure 1 above
Figure 2: Stretched Panorama of Canary Wharf Square (a: left) and as a Bubble Panorama from Above (b:
right): Note the Central Position of Camera and Viewer
possible to automatically segment such range images to deliver full 3d models, although this is an area of very active research and commercial concern.
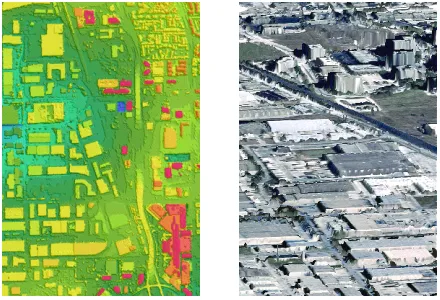
Figure 3: LIDAR-Based City Models (http://www.globalgeodata.com/bldgdata.html)
These models often arise from the fusion of 2d building footprints with range image data or other height data sources. Using simple GIS technology, it is possible to overlay 2d building footprints on airborne LIDAR range images and determine the spatial characteristics of the range image within each building footprint. This enables the extrusion of the map data to yield a crude 3d model such as that for Berlin in Figure 4(a) but at present, this does not enable the automatic generation of roof morphology. Moreover some simplification of the outline of building geometry is likely to be required if a model of a manageable size is to be produced.
Figure 4: Prismatic Models: LIDAR-based Berlin (a: left) and Texture mapped Piccadilly Circus, London
(b: right)
At present the automated extraction of roof morphology from digital image data remains a formidable research task. Modern digital, or soft-copy, photogrammetric systems enable an operator to recover 3d surface details more efficiently than previous generations of photogrammetric equipment. Detailed models of either individual buildings or small city blocks are frequently derived from a combination of aerial and terrestrial digital photogrammetry. Leading players in this field use automated search techniques to identify corresponding locations (points, edges and regions) in multiple, overlapping images and then generate a number of possible ‘geometries’ which can be tested against templates. Even the best of such methods require significant operator intervention in complex areas where buildings do not conform to a limited number of characteristic templates. Thus the current state-of-the-art demands manual interpretation of roof and other architectural details as we show again for the Canary Wharf development in Figure 5.
Figure 5: Building Canary Wharf as a Prismatic Model with Roof Shapes
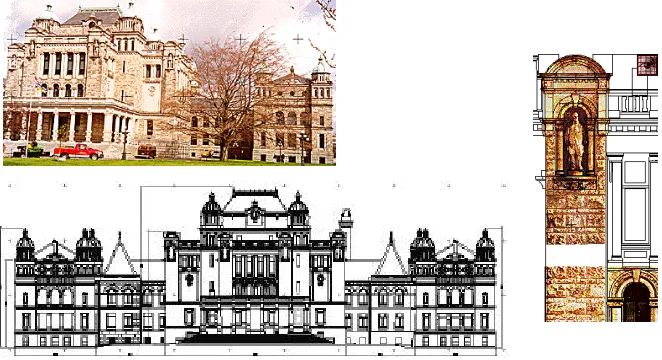
range from digital ortho-photographs (in which images are rectified and combined to remove perspective effects) to full architectural detailing. Whilst there are a large number of specialist photogrammetric companies offering such services to architectural clients, it is likely that the cost of such products would be prohibitively expensive for full city coverage. An example is shown in Figure 6.
There is a complete class of models now emerging which essentially extrude the third dimension from the 2d plan form. These models are usually based on extensions to proprietary GIS, a good example being 3d Analyst which is an Extension to the desktop GIS ArcView. The great advantage of these models is that they extend the functionality of GIS to the third dimension in that the attributes associated with the 2d map can also be queried in the 3d model. These models also have the ability to be generalized in that aggregating the 2d map is considerably easier and more logical a basis for generalization than directly approaching such scaling within 3d. In fact most of these models do not render the 3d geometry in any detail whatsoever but for functional purposes this may not be necessary and such models do provide a useful basis for an appreciation of massing and even crude daylighting calculations. An example of such generalization at the level of the small administrative areas is given in Figure 7 below where we show population density in enumeration districts for the Isle of Dogs and for the entire area of inner London.
Figure 6: Full Architectural CAD Modeling by Terrestrial Photogrammetry
Figure 7: 3d GIS: Population Density in Docklands and in Inner London
There have been several attempts at developing models which link to GIS but which are composed of special adaptations of proprietary software. Several of the city models which we note below, in New York for example, are based on CAD-like software but have rudimentary GIS functionality. Unlike the London models above which are quite abstracted, these models are based on building plots with some rendering detail. An example for downtown Manhattan is shown below in Figure 8
Figure 8: Skyscrapers (in dark grey) Greater than 8000 Sq.Ft Floorspace from http://www.simcenter.org/
We are integrating many of these techniques in building various models of central London but before we illustrate these, we will return to our review of the field, noting developments in New York and Tokyo, before returning to London and to the prototypes that we are currently developing.
3 The Most Developed Applications: Tokyo and New York
purpose software apart from the 3d extensions to desktop GIS such as ArcView’s 3d Analyst. However where very extensive models have been developed such as in New York and Los Angeles for example, the software systems themselves which are composed of various more specialist proprietary products, appear to be in the vanguard of the development of general purpose systems for 3d modeling (Smith, 1999). That is to say, these software are being developed with a view to more extensive generalization, probably as much around the particular approaches of the companies involved, as around any specific city modeling project.
Another feature that should be noted is the move to ortho-photos and LIDAR type systems for recording height data. Most of the models we examined no longer use manual methods for measuring and recording height data. Various kinds of photogrammetry are now judged to be essential in the construction of such models and therein lies the route to automation of the entire process which is on the horizon. Another interesting characteristic of some model developments is the continued use of physical iconic models, usually constructed from balsa. For example, the City of London rely extensively on their elaborate wooden model which is ported to many places by the economic development unit for marketing purposes. They have some digital imagery associated with it, but the ‘hands-on feel’ that the model gives is still important to its use. In Jerusalem, a digital model has been built alongside the traditional wooden model and there is interaction between the two in usage to evaluate development proposals. One of the main applications in Tokyo by the Mori Corporation is based around the extension of a physical model to various kinds of digital display while at the time of writing, the authors have learned of an effort in Liverpool, UK to build a digital model of the city center from detailed scanning of the traditional wooden model, thus by-passing the need for digital photogrammetry (Padmore, 2000). In fact, the notion of developing 3d models using VR displays acknowledges this role; the idea of building such a model and displaying it within a holobench, implies that users would interact with the model using digital simulations of the physical movement of objects such as buildings within it.
3.1 Tokyo: Many Varied Applications
are many models of its various parts at different levels of detail and the impression is one of great diversity of modeling efforts with little coordination or even recognition that so many competing applications exist.
Asian Air Survey is one of the leading data surveillance companies in Japan. Its model covers the entire area of Greater Tokyo, and is based on an original aerial photo data base produced by the company and a highly interoperable proprietary 3d GIS with non standard interfaces. It has been used for various 3d planning applications which comprise full aerial data linked to GIS attributes. Other uses for landscape planning, telecommunication base station location-allocation, transportation and disaster simulation have been developed. The application has extensive GIS-type functionality but it needs to be adapted to each particular application. Despite the popularity of its data, it is unlikely that the software could ever be promoted as standard in the Japanese market.
The Tokyo CAD Center has developed 12 different applications in parts of Tokyo as well as the downtown. These models are essentially 3d CAD with good VR but limited GIS functionality. They are largely used for design review in the architectural and urban design domain but lack interoperability in a GIS environment, and are thus difficult to link to spatial data. Many of their models have good photorealism in that they have exploited recent developments in digital photography and related media. On the other hand, the Mori Corporation have developed the hybrid digital-physical model referred to earlier which although useful in traditional terms has limited portability and cannot be extended to embrace spatial data base technologies, other than those that relate to photorealistic media.
The Ministry of Posts and Telecommunications have a very recent project that is developing 3d visualization for all cities in Japan designed for telecommunications applications. Some of the data used has been taken from aerial data produced by the Nakanihon Air Service which indeed has its own visualizations and digital mapping software. A particularly interesting example is their use of 3d models to simulate the spread of fire although the prime focus of the company is on proprietary software and data for digital mapping. Other models are worthy of note such as the Planet9 Shinjuku model which like all Planet9 models is a VRML based application for virtual tourism. There are applications to Shibuya using Superscape, while finally digital panoramas but with some 3d content have been developed by Webscape for parts of downtown Tokyo. These applications are all very diverse and we do not have time to examine them in any real detail. Readers are referred to the Appendix which list the web sites that contain more content. The range of visualization for three of these examples is shown below in Figure 9.
3.2 New York: Applications with Strong Spatial Database Structure
(a) (b)
(c)
Figure 9: Tokyo: (a) The Asian Air Survey Model, (b) Zenrin’s Fire Spread Model, and (c) Webscape’s Digital
Panoramic Visualization
The first of these is Analytical Surveys Inc (ASI) Technologies which is a large surveying, GIS and photogrammetric company that has been developing GIS and orthophotography resources for the New York City Department of Environmental Protection (NYCDEP) for the last two years. A by-product of this work has been a 3d model that has been developed for part of Manhattan. This has been constructed using building height data generated during GIS production and by draping orthophotos using ArcView 3d Analyst. So far this model is a promotional venture for ASI and is not yet used by NYCDEP, although there are plans to develop a full model for a variety of services.
be converted into apartments. Most of their more recent models however have been largely to view planned buildings in context and hence improve the planning process, and they see their effort encouraging more discussion and public participation in planning and design through 3d models.
The ESC modeling approach is principally used as a community planning support tool: for site selection (locating proposed developments) and design review. Here the models are used as interactive design tools to visualize developments and to bring the design review process to community groups in a bid to foster citizen participation in the planning process. The ESC see their models as “an environment that people can instantly relate to and move around in.” They are also linking their visual 3d interfaces with predictive simulation models, using their models to predict changes in communities over time. The ‘CommunityViz’ project combines an agent-based simulation with their 3d visualization model with the agent-based model (The ‘Policy Simulation Tool’) being developed by PriceWaterhouseCoopers’ Emergent Solutions Group. The project is being applied to a small town – Ascutney, Vermont – which has a population of roughly one thousand. The agent-based model simulates the socio-economic evolution of every individual in the population, building up an incredibly detailed composite profile of the community in terms of ethnic diversity, tax revenue base, growth and decline, cohort survival, etc. (ESC, 2000).
The fourth effort is in many ways the most impressive. Urban Data Solutions (UDS) started as a commercial venture in 1997, have grown rapidly since then, and are now experts in the provision of 3d GIS and integrated CAD models for several cities, mainly in the US. They pride themselves in their ‘smart models’ and have pioneered work in this area with detailed models of Manhattan, Chicago and Washington DC which are all commercially driven. The founding members worked in CAD modeling for the architectural firm of Skidmore, Owings and Merrill which pioneered CAD and fly throughs of cityscapes as far back as the late 1970s (Deken, 1983). Since then the applications context has changed and the wireless telecommunications industry has provided a major commercial drive to develop the models for line-of-sight analysis in locating antennae in cities.
telecommunications), and the shadow effects of buildings. Once again as in Tokyo, the range of applications is impressive and to provide some sense of what is being achieved, we show three examples from the commercial ventures in New York City in Figure 10.
4 Ad hoc Attempts to Visualize Central London’s Urban Landscape
(a) (b)
© (d)
Figure 10: New York City: (a) Urban Data Solutions – Floorspace in Downtown Manhattan (b) The
Environmental Simulation Center- Floorspace again (c) ASI – Draping Orthophotos on 3d Block Models and (d)
ASI –Utility Lines beneath the Floorspace Blocks
Figure 11: Scenes from the London Track of Metropolis Street Racer
Street Racer includes three cities within the game: London, Tokyo and San Francisco. Each city has been accurately modeled using photogrammetric techniques, allowing a realistic driving course to be constructed covering 2 square miles in each city. The preview version of London is particularly well implemented, running in real time at 60 frames per second. The games industry is becoming a major player in the modeling of built form as demand from the consumer for realistic environments is met by the increase in processing power of the latest gaming consoles. With gaming exceeding cinema in the United Kingdom in terms of consumer spending, developers have a mass-market appeal, allowing games to be developed on budgets often exceeding £2 million. Such budgets allow realistic cities to be modeled, although it should be noted that Metropolis Racer is only available on the Dreamcast console, making it unusable for the range of applications identified in this paper. It may however be possible to port the game to other computing platforms and thus enable use for a much wider range of applications.
Level of Detail (LOD) Description
A Detailed architectural model including fenestrations B Detail equivalent to 1:100 measured building survey C Detailed elevations
D Major details of building elevations E Accurate building volumes
F Roofscape
G Prismatic Block models - Coarse massing
The city has been divided into city blocks with OS (Ordnance Survey) 1:1250 building footprints heighted (using aerial photogrammetry) to provide a prismatic model corresponding to LOD G in their system. Incremental upgrading of the model has been undertaken on a project by project basis with a significant number of sites now being held at LOD A and B. The model is maintained within a package called Navisworks (http://www.navisworks.com/) with multiple versions of the model being managed through a file-naming convention. Typical views of the model are shown in Figure 12 which illustrates the superb degree of detail of the parcels but also indicates a complete absence of photorealistic rendering.
Figure 12: Views of the City of London from the Miller-Hare Model
photography and an integrated database providing information about contemporary urban design and the Foundation's work - past, present and future. It offers the public, practitioners and politicians a dynamic vision and a growing archive of the Capital. The first layer of London Interactive was entitled ‘New London Architecture’ … The second layer of London Interactive is London 2000 which reviews more than 50 projects which will change the public face of London over the next ten years … In London 2000 photographs fade into visual-izations to show how schemes will alter the familiar landscape of London … digital video and computer animations provide vivid simulations of the exterior and interiors of buildings currently being planned or under construction across the Capital …" (from http://www.architecturefoundation.org.uk/project2a.htm).
Figure 13: The UCL Computer Science Fly-Through of Central London
http://www.cs.ucl.ac.uk/staff/A.Steed/london-demo/vrst99/index.htm
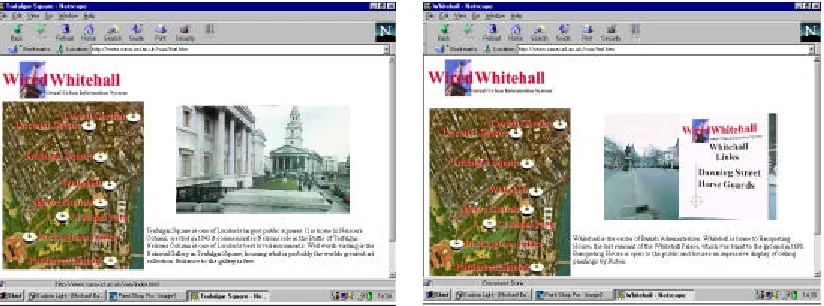
In CASA, we have developed many different visualizations of parts of central and inner London, largely as part of Andy Smith’s work on online planning and community participation (Batty, Dodge, Doyle, and Smith, 1998). More recently we have begun to merge some of these ideas with the more professional spatial data base technologies being developed by Dave Chapman. Worth noting here is the initial virtual tour which makes heavy use of panoramic imaging called “Wired Whitehall” which is net based, and enables access to related web sites through maps and panoramas. A section from this tour is illustrated below in Figure 14.
Application Web Address
Wired Whitehall – Virtual Tour
http://www.casa.ucl.ac.uk/vuis/
http://www.casa.ucl.ac.uk/olp/panoramic/
Hackney Building Exploratory Interactive
http://www.casa.ucl.ac.uk/hackney/
Shared Architecture – Notable Landmark Sites
http://www.casa.ucl.ac.uk/olp/3d/
http://www.casa.ucl.ac.uk/public/meta.htm
London Bridges http://www.casa.ucl.ac.uk/londonbridges/ The VENUE Project – GIS
for Urban Design
http://www.casa.ucl.ac.uk/newvenue/newvenue.htm
http://www.casa.ucl.ac.uk/venue/venue.html
These techniques have been further developed for the Hackney Building Exploratory and for the Museum of London, while prismatic rendering techniques are being developed for block modeling as we showed earlier in Figure 5 for Canary Wharf and for the Tottenham Court Road area of London. The table above shows a list of these examples and the web sites from which users can access the content and the movies, but as in all these examples, the focus is not really on experts and professionals, nor is it on spatial data analysis but on the community and more general interest groups. The CASA work is noteworthy in that all the examples are delivered over the web.
Figure 15: A View of Tower Bridge and Environs from the City University Model
The City University model like the Miller-Hare model has no spatial data functionality, and was mainly intended for problems involving aesthetic impact, particularly high buildings. Our last example is more of a 3d map than a model but it has been developed by Alan Day’s group at Bath University which has considerable computer graphic expertise in this areas, as developed through their state-of-the-art CAD model of the town of Bath (Day, 1994). They have developed a simple model of the Soho area of central London which they bill on their web site as “The Map of the Future”. In essence this is a 3d map through which users can fly and which provides “… a tool for analyzing the relationships between built form and various kinds of data…” as well as a “… publicly accessible interface to a wide range of urban information”. There are various VRML versions of the map through which users can fly at http://www.bath.ac.uk/Centres/CASA/. as illustrated in Figure 16.
Figure 16: ‘The Map of the Future’ from the University of Bath Group
5 Loose to Strongly Coupled GIS and CAD: The Virtual London Project
developing a prototype application for Central London which is based on the view that GIS is essential to such developments but also that new functionality should be developed to deal with the geography of the third dimension. Our focus is thus on developing a GIS base which is robust enough to incorporate other kinds of media, in particular panoramic imagery as well as rapid CAD based on photorealism. We are following two strategies: an ad hoc process in which we are using a state-of-the-art internet GIS as the base to deliver spatial data, multimedia, and 3d imagery across the net, and a more traditional approach in which we are using 3d extensions to proprietary GIS. In the first case, we are strongly reliant on developing our own functionality for analysis of the third dimension whereas in the more traditional case, we are able to use the established functionality of the GIS to undertake analysis.
5.1 Virtual London: IMS, Rapid CAD, and Panoramic Imaging
In our first prototype, we are using the ArcIMS server to store, retrieve and deliver information across the web for central London. We have a wide range of data layers which link geometry to geography and progress from the scale of census tracts – enumeration districts that we illustrated in Figure 7 above – down to parcel level data which we have culled from a variety of sources such as OS Landline, Cities Revealed data and so on. We have various raster data on which this geometric and geographic data sits and we are intending to develop query systems that enable us to intersect geometric with geographic land units. So far we do not have any movement data within the base and the data is largely cross-sectional being compiled from diverse time slices beween 1991 and 1999. With internet map servers, we can customize the query system within limits, and in the first instance we intend the product to be an example of forward visualization, useful to end users and interest groups rather than planning professionals per se. We have some experience of internet map servers for related projects (Doyle, Dodge, and Smith, 1998) and an early version was demonstrated for both travel and pollution problems in London. One of the key features of the interface we are developing is that it will be interactive and widely available.
One of the key issues in 2d mapping and 3d modeling is that the same product may look forward to the end user base or back to professional use. This will certainly be a feature of Virtual London. The way the various CAD and mulitmedia products are woven into the IMS
is quite innovative. The map server does not serve 3d geometric information in terms of height data to the CAD visualization for this is preprocessed using the rapid CAD package
Figure 17: Constructing the CAD Model with Movable Buildings as Objects
This shows a portion of Tottenham Court Road which was photographed from the BT Tower and then turned into object form using Canoma. The object highlighted in red in the left image is an example of such a block object and as the right image shows, this can be moved to another position in the street. When this process takes place on the web but outside the IMS, then positional information is sent back to the server and input to the data base. At the end of a session, these changes to the original data base are stored.
The panoramic imagery is simply activated from the CAD model and in Figure 18 below we show a mock-up of the prototype. The panorama are produced as we indicated earlier in Figure 2. In Figure 18, we show the map server in the upper left-hand window, the CAD model – in this case of the Palace of Westminster (The Houses of Parliament) in the upper right window, with the panorama of this area below. The various buttons at the bottom of the screen, enable the user to operate some rudimentary navigation controls which allow zooming and panning and movement within the various visualizations. We also show a search capability that directs the user to find particular sites and building complexes through the
Figure 18: The Virtual London Prototype Integrating Internet GIS, Rapid CAD, and Digital Panoramics
This interface is much more suggestive of virtual tourism than of considered professional use but the power and flexibility of adding 2d and 3d maps, models, and multimedia is clear.
5.2 Desktop GIS with 3d Capabilities
Our second approach is more classic and this is based on developing the entire model within a proprietary GIS – in this case in ArcView with Extensions, particularly 3d Analyst. In fact, we consider that this model will eventually be worked up in ArcInfo but for the moment to simply demonstrate what is possible we are using quite basic desktop software. It is quite easy to code and import height data into ArcView directly from LIDAR data produced in this case for the City of London from the UK National Remote Sensing Centre. Figure 19 shows a typical screen shot of the 2d map alongside the 3d model, with a special import of St. Paul’s Cathedral in LIDAR form. This shows how problematic it is to work with remotely sensed data for irregular objects that are composed of non standard polygons. In fact, the geometric integrity of the cathedral is captured by LIDAR but the distortions produced simply illustrate the state-of-the-art. This will of course change – rapidly.
is that the array of different media and data base systems now enables us to construct many different kinds of virtual model. In some senses, the diversity that we found in our world-wide review is even greater than we originally anticipated for there are many new techniques that have not been developed in practice as yet, some of which we have hinted at above.
Figure 19: 3d Block Modeling of the City of London from LIDAR
6 Next Steps: Automated Visualizations and Remote Delivery
Spatial data base technologies and remotely sensed geometric data are the two features of 3d city modeling that are forcing the pace. It is entirely conceivable that 3d models will be produced on-the-fly as data is sensed remotely and downloaded into standard packages that generate effective and useful models. In fact, this is not to be doubted but what is unclear is the extent to which such automation will extend to bespoke applications, particularly those that address professional concerns. In this domain, specialist and unique adaptations of general principles are likely to remain the norm. However, software packages are likely to emerge that will be capable of generating good, standard models. In a sense, this is already the case with the plug-ins and extensions to desktop GIS such as ArcView, and the Evans and Sutherland rapid 3D modeling package. More elaborate systems incorporating software such as Multigen Paradigm which features in many models will also become more generally available as will software and data systems for producing good remotely sensed data such as LIDAR (Snyder and Jepson, 1999).
bandwidth begin to disappear as optical fiber takes over (Gilder, 2000). Desktop will give way to internet as software such as IMS and VRML-like browsers become standard. Remote access of data and software as well as the generation of content on-the-fly over the net will become the norm in the next 5 years. This will open an entirely new way in which users can interact with such models, and it will herald new ways in which the wider public will be able to participate. Our Virtual London prototype is largely designed for such forward visualizations, for community participation across the net. What we have demonstrated is here is simply a snapshot of what is going on. We have not sought to present a learned treatise on such models but have attempted to paint an impressionistic picture of the field of planning support which is rapidly developing and which will clearly aid the planner and public alike in ways that are surprising, exciting and novel.
6 References
Batty, M. (1979) On Planning Processes, in B. G. Goodall and A. M. Kirby (Editors) Resources and Planning, Pergamon Press, Oxford, UK, pp. 17-45.
Batty, M., and Smith, A. (2001) Virtuality and Cities: Definitions, Geographies, Designs, in P. F. Fisher, and D. B. Unwin (Editors) Virtual Reality in Geography Taylor and Francis, London, forthcoming.
Batty, M., Dodge, M., Doyle, S., and Smith, A. (1998) Modelling Virtual Environments, in P. Longley, S. Brooks, R. McDonnell, and B. Macmillan (Editors) Geocomputation: A Primer, John Wiley and Sons, Chichester, UK, pp. 139-161.
Batty, M., Dodge, M., Jiang, B., and Smith, A. (1999) Geographical Information Systems and Urban Design, in. J. Stillwell, S. Geertman, and S. Openshaw (Editors) Geographical Information and Planning, Springer, Heidelberg, Germany, pp. 43-65.
Day, A. (1994) From Map to Model, Design Studies, 15, 366-384;
Deken, J. (1983) Computer Images: State of the Art, Thames and Hudson, London.
Delaney, B. (2000) Visualization in Urban Planning: They Didn’t Build LA in a Day, IEEE Computer Graphics and Applications, May/June 2000, 10-16.
ESC (2000) http://www.wenet.net/~shprice/Kwart1.htm, Environmental Simulation Center, New York.
Fuchs, C (1996) OEEPE Study on 3D-City Models, Proceedings of the Workshop on 3D-City Models, OEEPE (Organisation Europeenne d'Etudes Photgrammetriques Experimentales), Institute for Photogrammetry, University of Bonn, Bonn, Germany, 37 pp. (with appendices).
Gilder, G. (2000) Telecosm: How Infinite Bandwidth Will Revolutionize Our World, The Free Press, New York.
Jepson, W. (2000) http://www.aud.ucla.edu/~bill/UST.html, School of Architecture, UCLA, Los Angeles, CA.
Leavitt, N. (1999) Online 3D: Still Waiting After All These Years, Computer, July 1999, 4-7.
Liggett, R. and Jepson, W. (1995) An Integrated Environment for Urban Simulation, Environment and Planning B, 22, 291-302.
Lowry, I. S. (1965) A Short Course in Model Design, Journal of the American Institute of Planners, 31, 158-166.
Morgan, B. A. (2000) Evaluation of LIDAR Data for 3D-City Modelling, MSc Thesis in Remote Sensing, Department of Geomatic Engineering, University College, London.
Padmore, K. (2000) The Liverpool Project, The Centre for Virtual Environments, University of Salford, Manchester, UK.
Smith, A. (2000) Shared Architecture: Rapid-Modeling Techniques for Distribution via On-Line Multi User Environments, Arcadia, 19, 1, in press.
Smith, S. (1999) Urban Simulation: Cities of the Future, A/E/C/Systems (Architecture, Engineering, and Construction Automation), Summer, 1999
available at http://www.caenet.com/aec/artciels/993feature1.html
Snyder, L., and Jepson, W.(1999) Real-Time Visual Simulation as an Interactive Design Tool, ACADIA 99 Conference Proceedings, Snowbird Utah, October 28-31, pp. 356-357.
8 Appendix: Web Addresses for Visualization Projects in Cities with
Greater than One Million Population, Ranked by Size
City
Web addresses: append http://
Tokyo, Japan csis.u-tokyo.ac.jp/links-e.html
www.ajiko.co.jp/infocom/index.html
www.webscape.com/Worlds/tokyo.html www.zenrin.co.jp/products/Digital/L/Zi2HP/2/2.html www.oyo.co.jp/service/sentan/3d/index.html
www.seikabunka.metro.tokyo.jp/english/englishindex.html www.cadcenter.co.jp/01-CG-frame.html
www.planet9.com/earth/tokyo/index.htm www.cyber66.or.jp/ www.nnk.co.jp/skymedia/
New York, NY www.simcenter.org/
www.u-data.com/
www.3dmetric.com/cities/Manhatten.JPG www.planet9.com/earth/newyork/index.htm www.3dmetric.com/cities/New%20_York_City.JPG
www.esri.com/news/arcnews/summer98articles/03-av3danalyst.html
Mexico City, Mexico www.mexico-city-3d-map.com.mx/ETenoc.htm
London, UK www.cs.ucl.ac.uk/staff/A.Steed/Pictures/
www.cs.ucl.ac.uk/staff/A.Steed/london-demo/vrst99/index.htm www.bath.ac.uk/Centres/CASA/london/
www.millerhare.com/page0104.htm
www.architecturefoundation.org.uk/project2.htm
www.dome2000.co.uk/static/html/3d_dome/model/index.htm www.aerobel.co.uk/urbansim.html
Paris, France www.paris-france.org/VR/anglais/
www.paris-france.org/asp/carto2.asp webscape.com/Worlds/paris.html
Los Angeles, CA www.planet9.com/lacitymenu.htm
www.3dmetric.com/cities/LosAngeles.html www.gsaup.ucla.edu/bill/LA.html
www.aud.ucla.edu/~robin/ESRI/p308.html www.ust.ucla.edu/
www.multigen-paradigm.com/urbsimhm.htm
Chicago, IL www.3dmetric.com/cities/Chicago_downtown.JPG
home.digitalcity.com/chicago/
www.planet9.com/earth/chicago/index.htm www.uic.edu/cuppa/udv/
www.u-data.com/
Delhi, India www.thecpmall.com/virtualvision/VRML/CPvrml_aerial.htm
Saint Petersburg www.mapserv.com/new/e/index.htm
Hong Kong, PRC hkugis.hku.hk/campus/
www.hku.hk/cc/sp2/software/graphics/dx/html/pages/usrgu015.htm. www.centamap.com/cent/index.htm
Philadelphia, PA saturn.bentley.com/news/97q2/modelcity.htm
www.bentley.com/modelcity/
Berlin, Germany www.cyberlin.de/
www.cy-berlin.de/intro/cityframe.htm
www.multigen-paradigm.com/echtzeit/echtzeit_story.htm www.artcom.de/contacts/city-and-architecture/berlin.de.shtml www.echtzeit.de/e-berlin/index_e.html
Detroit., MI www.3dmetric.com/cities/Detroit_Downtown.JPG
San Francisco, CA www.abag.ca.gov/bayarea/eqmaps/eqmaps.html
www.planet9.com/sfnasa.htm www.planet9.com/sfcitymenu.htm
www-laep.ced.berkeley.edu/research/simlab/ www.planet9.com/bayarea.htm
webscape.com/Worlds/sanfrancisco.html www.zenrin.com/pr.html
Boston, MA www-ims.oit.umass.edu/~umassmp/intergraph/boston.html
www.planet9.com/earth/boston/index.htm
Toronto, Canada www.clr.toronto.edu/
www.clr.utoronto.ca/
Sydney, Australia www.cityofsydney.nsw.gov.au/vg_panoramas.asp
www.culture.com.au/virtual/
www.planet9.com/earth/sydney/index.htm www.bentley.com/biuc/awards/psnurban.htm
Washington, DC www.3dmetric.com/cities/Washington_NW.JPG
www.geocities.com/Pentagon/8215/digital.html www.planet9.com/earth/washdc/new/master.wrl
Singapore www.singapore.vrt.com.sg/sing-1/merlion_frame.htm
www.bizarts.com/ www.ura.gov.sg/
www.ura.gov.sg/corporate/gallery_main.html
Yokohama, Japan www.ymm21.co.jp/annai/as direction
Houston, TX www.transamerica.com/Business_Services/Real_Estate/TerraPoint/Te
chnology/demo.asp#
Warsaw, Poland andante.iss.uw.edu.pl/cgi-bin/modzel
Lisbon, Portugal ortos.cnig.pt/igeoe/ingles/
www.marconi-is.com/products/
Cleveland, OH www.3dmetric.com/cities/Cleveland.JPG
San Diego, CA www.sci.sdsu.edu/People/Jeff/newhome/phase4.html
www.planet9.com/earth/sandiego/index.htm
Seattle, WA www.wizards.com/rpga/vs/welcome.asp
www.download32.com/proghtml/18/1859.htm
Atlanta, GA www.planet9.com/earth/atlanta/index.htm
www-ims.oit.umass.edu/~umassmp/intergraph/atlanta.html webscape.com/Worlds/atlanta.html
Baltimore, MD www.planet9.com/earth/baltimore/index.htm
Vienna, Austria www.neonet.nl/itc/~oeepe/newsletters/let1_984.html
Amsterdam,
Netherlands
www.dds.nl/
www.xs4all.nl/%7Eavsas/index_v2.html www.xs4all.nl/~avsas/urban_3d_model.html www.zegelaar-onnekes.nl/home/zeno-3d.htm
Frankfurt, Germany www.centricsoftware.com/gallery/frankfurt.html
ipb1.ipb.uni-bonn.de/ipb/projects/semi-automatic.html www.frankfurt.de/panorama/deutsch/index.html www.khm.de/~jo/about/about_projekte.html
Glasgow, UK iris.abacus.strath.ac.uk/glasgow/ - or screen grab here
www.glasgow1999.co.uk/ www.glasgowdevelopment.co.uk/ www.glasgow.gov.uk/
Kyoto, Japan www.digitalcity.gr.jp/
Denver, CO www.planet9.com/earth/denver/index.htm
Vancouver, Canada www.planet9.com/earth/vancouver/index.htm
Portland, OR www.planet9.com/earth/portland/index.htm
www.pdx3d.com/Default.htm www.pdx3d.com/links.htm
New Orleans, LA www.virtualneworleans.com/Main.html