Route Optimization of Municipal Solid Waste
for Davangere City Using GIS
Hareesh K.B
1, Manjunath N.T
2, Nagarajappa D.P.
3PG Student, Department of Civil Engineering, UBDT College of Engineering, Davangere, Karnataka, India1 Professor & Director, Department of Civil Engineering, Center for Env. Sci. Engg. & Tech., University UBDT College
of Engineering, Davangere, Karnataka, India 2
Professor, Department of Civil Engineering, UBDT College of Engineering, Davangere, Karnataka, India1
ABSTRACT: The population growth in many urban cities and its activities in developing countries have resulted in an
increased solid waste generation rate, an important issue. In the process of solid waste management system; collection and transport play a leading role in waste collection and disposal in which, collection activities contributed the most of total cost that is paid for solid waste collection activities by city‟s citizen and transport activities are required 60-70% of total cost that is the total expenditures spent on the transport, transfer, disposal and treatment of municipal solid waste (MSW) by city authorities. Hence optimizations of routing system, systematization of collection, transport and transfer activities are the important components for an effective MSW management system. This project describes the current problems and the improvement of the waste management activities in a city of Davanagere. An integrated solid waste management assessment model is proposed and used as a decision support tool by municipal solid waste management authorities for daily efficient operations such as collection/transport path management, load balancing within vehicles, fuel consumption management by using GIS application. In addition, a simple optimal routing model is proposed to achieve the minimum cost/distance/time efficient collection and transport path for municipal solid waste management.
KEYWORDS: Municipal solid waste management, Waste collection, Route optimization, GIS.
I. INTRODUCTION
Solid wastes are being produced since the early stage of the civilization. During the early period solid wastes were conveniently and unobtrusively disposed off. As the density of population was low and large open land population explosion was available, disposal was not an acute problem. With the advent of industrialization and urbanization, problems of waste disposal increased. Generally the term “waste” implies that it is of no concern to anyone and is of no value. The intrinsic value of the material as a resource or as an object of further utility has not been fully recognized. The net result is to reduce the expenditure involved for its disposal by meager allocation of resources.
collection, transportation, treatment and disposal. About 60-70% of this amount is spent on collection, 20 to 30% on transportation and less than 5% on final disposal of waste. Therefore waste collection must be regarded as an important issue in order to increase the efficiency of waste management.
As in the case of many cities of Karnataka, Davangere city municipal council has adopted open transportation of the waste from the temporary storage to the disposal site. Waste collected from various secondary containers and open collection points were loaded to the collection vehicles manually. Manual loading was found to be time consuming and reduce the productivity of the vehicles. Solid waste stored in the secondary containers and the open areas along the route was transported to the disposal yard every day from the prime residential areas, commercial streets and markets. But in some wards, waste was transported to the disposal yard only in alternate days. The local body is clearing the waste in two shifts per day. It is necessary to optimize the collection route so as to minimize fuel consumption, labour requirement, in turn to function in an economical manner.
II. STUDY AREA
The study area Davangere city is situated in central part of of Karnataka located at around 260 km from Banglore on Pune Banglore National Highway No. 4. It is situated at longitude of 75°55ˈE and latitude 14°28ˈN with an altitude of 550m from mean sea level. The average rainfall is around 500mm. the temperature of the city is generally varies from maximum of 41°C to minimum 16°C to the west of the Davangere city River Thungabadhra flows at around 15km distance.
The city area is about 60.88 sq.kms and population of the city as per the 2011 census is 4,35,172 and an floating population of 10,000(Source: City Municipal Corporation). The city has been converted as district head quarters in 1997 and as Municipal Corporation from 2008.
The city is divide into 41 wards and the total number of houses 11,8352. In addition to these commercial complexes, hospitals and industries are established in and around the city which add up to solid waste generation.
III. METHODOLOGY
A. GIS WORKFLOW MODEL
A model using GIS technology is developed for selecting suitable locations for secondary containers in Davangere city. GIS analysis is used to show how proposed location of the waste bins can serve the entire area. However, the following steps have been considered developing this model.
The approach essentially involves database preparation, plotting secondary containers, service area covered by the containers, route mapping for vehicle movement and analyzing the routes for optimal path.
For the analysis of placement of secondary container and generating the optimal routes and for collection of solid waste, the following data are obtained from the City Municipal Council.
1. Study area boundary
2. Detailed urban plan of the municipality
3. Number and type of vehicles used and its capacity. 4. Road network of the study area
5. Number of secondary containers and their location. 6. Capacities of secondary containers.
7. Waste generation details at each container. 8. Existing collection routes for the dumper placers. 9. Time taken for collection and disposal of solid waste. 10. Vehicle speed, fuel consumption of the dumper placers.
spatial data such as secondary container number, secondary container type/capacity collection time, vehicle average speed and travel time.
A flowchart portraying the methodology involving GIS technology adopted present study is appended as figure 1 the data processing has been carried out in QGIS software has been used for the following activities.
1. Geo-referencing of Davanagere City Map 2. Digitization of Road Network
3. Plotting of Secondary container locations 4. Route mapping for vehicle movement. 5. Analysis for optimal path
6. Plotting service area covered by each container 7. Analyze the existing containers
8. Replacement & locating additional container. 9. Optimal path analysis II
Fig: 1 A flowchart describing the methodology adopted in the present study
City Map Data (Master Plan)
Data Source GPS
Geo-referencing
Digitization
Plotting Secondary Containers
Route Mapping
Plotting service area covered by each container
Analysis for the existing containers
B. DIGITIZATION
Davangere boundary, municipal boundary and road network was digitized using the geo-referenced master plan of the city to create the digital database.
C. EXISTING CENTRALIZED SYSTEM
There is an existing landfill site for treatment of municipal solid waste management at Avargolla with on 33.19 acres of land. At present all municipal solid waste collected in Davangere city is sent to this compost plant.
There are few lacunas existing in the present system, and they are,
The dust bins located do not serve the entire area, which has to serve.
They do not follow optimized route path.
Overlapping of routes persists
Due to overloading at the landfill site, at-site(s) time increases.
D. PROPOSED CENTRALISED SYSTEM
In this project we have identified the above lacunas, analyzed the present system and have proposed new optimal routes for centralized system.
Few steps are followed in laying the optimized routes,
1. The location of dustbins are determined keeping in mind, various factors such as
Population
Municipal solid waste generated
Location
Area to be served
2. Optimized routes are laid according to rules of CPHEEO manual 3. Time required for each trip is calculated using the formula
4. Finally cost analysis is done and comparison between the existing and proposed centralized system is done.
E. PROPOSED DECENTRALIZED SYSTEM
Since the existing landfill site far from the study area, therefore it is very difficult and uneconomical to move that all types of waste to the existing landfill site. Moreover it is understood that the selected areas contributing more organic waste, instead of transferring that organic waste to the landfill site, so it‟s better to make use of that organic waste into an onsite compost site is proposed at selected wards.
F. CALCULATIONS OF TIMES PER TRIP
The time required per trip, which also corresponds to the time required per container is equal to the sum of the pickup, at-site, and haul times, time is a factor accounting for off-route activities, and is given by the following,
Thcs =
P hcs + s+ h
(1−𝑤 ) ………. (1)
Where,
T hcs = time per trip for hauled container system, h/trip
P hcs = pickup time per trip for hauled container system, h/trip
S = at-site time per trip, h/trip H =haul time per trip, h/trip
W = off-route factor, expressed as fraction
Where,
H = total haul time, h/trip a= empirical constant, h/trip b = empirical constant, h/ml x= round trip-haul distance, ml/trip
Substituting equation-2, in equation -1, the time per trip can be expressed as follows:
T hcs = (P hcs + s+a+bx)
(1-w)
IV. RESULTS AND ANALYSIS
A. COMPUTATION OF WASTE GENERATION
The population of the study period (2011) was collected from the municipality, the records of 2011 senses. The base year 2011 is selected for the calculation of solid waste generation. Per-capita waste generation rate as done from the field study by the municipality is 0.47 kg, which is well between the ranges of generation rate in Indian cities.
The average waste generation rate in Davanagere city is 0.47 kg/capita/day. Waste generation = population *per capita waste generation
=4,35,172*0.47 = 204530.84kg/day
= 204.53 TPD
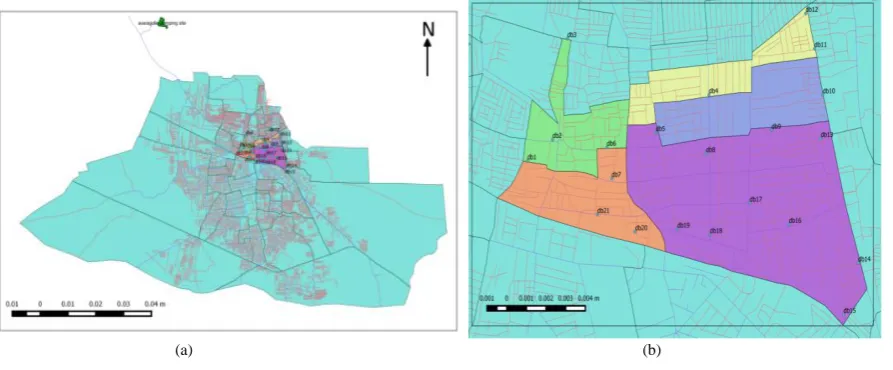
B. EXISTING CENTRALIZED SYSTEM
The existing centralized system consisted of 21 dust bins and individual route for each of the bins. The existing bin location is shown in figure 2. Two dumper placers were used for transportation of municipal solid waste..
(a) (b)
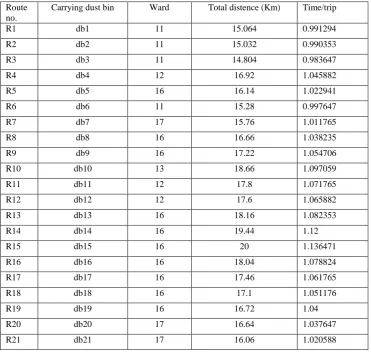
The distance and time calculations are tabulated in table 1
Table: 1Route details for existing centralized wards
Route no.
Carrying dust bin Ward Total distence (Km) Time/trip
R1 db1 11 15.064 0.991294
R2 db2 11 15.032 0.990353
R3 db3 11 14.804 0.983647
R4 db4 12 16.92 1.045882
R5 db5 16 16.14 1.022941
R6 db6 11 15.28 0.997647
R7 db7 17 15.76 1.011765
R8 db8 16 16.66 1.038235
R9 db9 16 17.22 1.054706
R10 db10 13 18.66 1.097059
R11 db11 12 17.8 1.071765
R12 db12 12 17.6 1.065882
R13 db13 16 18.16 1.082353
R14 db14 16 19.44 1.12
R15 db15 16 20 1.136471
R16 db16 16 18.04 1.078824
R17 db17 16 17.46 1.061765
R18 db18 16 17.1 1.051176
R19 db19 16 16.72 1.04
R20 db20 17 16.64 1.037647
R21 db21 17 16.06 1.020588
C. PROPOSED CENTRALIZED SYSTEM
Considering the lacunas in the existing centralized system, a new centralized system is being proposed by relocating the bins and laying new routes for a 5 wards. The details of the wards are as shown in table2 and their map is shown in figure3
.
Table 2: Features of 5 wards.
Ward No. Ward Name Area (sq km)
Population 2011
Fig 3: Optimal routes for proposed centralized system
D. OPTIMAL ROUTE
The optimal route for the secondary containers is laid starting from the centralized land fill site situated in Avargolla to each dustbin and is as shown in figure3.
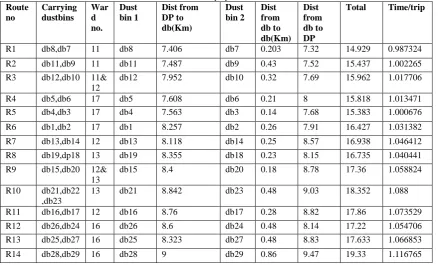
Table 3: Route details for proposed centralized wards Route
no
Carrying dustbins
War d no.
Dust bin 1
Dist from DP to db(Km)
Dust bin 2
Dist from db to db(Km)
Dist from db to DP
Total Time/trip
R1 db8,db7 11 db8 7.406 db7 0.203 7.32 14.929 0.987324
R2 db11,db9 11 db11 7.487 db9 0.43 7.52 15.437 1.002265
R3 db12,db10 11& 12
db12 7.952 db10 0.32 7.69 15.962 1.017706
R4 db5,db6 17 db5 7.608 db6 0.21 8 15.818 1.013471 R5 db4,db3 17 db4 7.563 db3 0.14 7.68 15.383 1.000676
R6 db1,db2 17 db1 8.257 db2 0.26 7.91 16.427 1.031382
R7 db13,db14 12 db13 8.118 db14 0.25 8.57 16.938 1.046412 R8 db19,dp18 13 db19 8.355 db18 0.23 8.15 16.735 1.040441
R9 db15,db20 12& 13
db15 8.4 db20 0.18 8.78 17.36 1.058824
R10 db21,db22 ,db23
13 db21 8.842 db23 0.48 9.03 18.352 1.088
R11 db16,db17 12 db16 8.76 db17 0.28 8.82 17.86 1.073529
R12 db26,db24 16 db26 8.6 db24 0.48 8.14 17.22 1.054706
R13 db25,db27 16 db25 8.323 db27 0.48 8.83 17.633 1.066853
E.
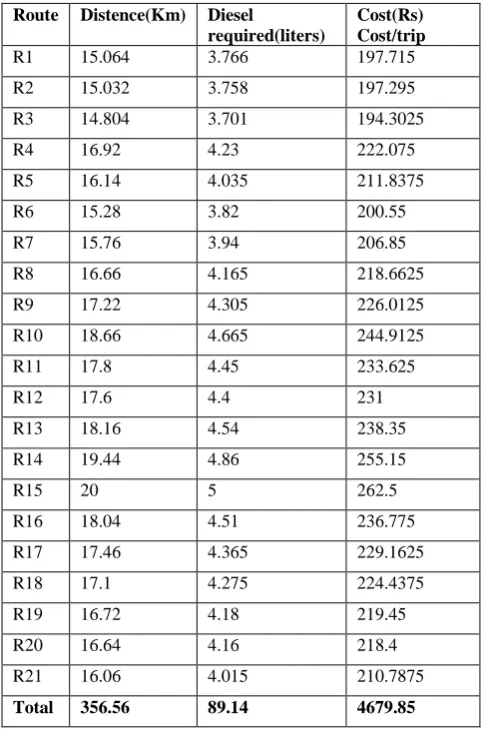
COMPARISON BETWEEN EXISTING AND PROPOSED CENTRALISED SYSTEM. COST ANALYSISThe cost analysis for the existing and proposed centralized system was carried out and is tabulated in table4 and table5
Table 4: Cost analysis for existing centralized routes
Route Distence(Km) Diesel
required(liters)
Cost(Rs) Cost/trip R1 15.064 3.766 197.715
R2 15.032 3.758 197.295
R3 14.804 3.701 194.3025
R4 16.92 4.23 222.075
R5 16.14 4.035 211.8375
R6 15.28 3.82 200.55
R7 15.76 3.94 206.85
R8 16.66 4.165 218.6625
R9 17.22 4.305 226.0125
R10 18.66 4.665 244.9125
R11 17.8 4.45 233.625
R12 17.6 4.4 231
R13 18.16 4.54 238.35
R14 19.44 4.86 255.15
R15 20 5 262.5
R16 18.04 4.51 236.775
R17 17.46 4.365 229.1625
R18 17.1 4.275 224.4375
R19 16.72 4.18 219.45
R20 16.64 4.16 218.4
R21 16.06 4.015 210.7875
Total 356.56 89.14 4679.85
Table 5: Cost analysis for proposed centralized routes
Route Distence(Km) Diesel
required(liters)
Cost(Rs) Cost/trip R1 14.929 3.73225 195.943125
R2 15.437 3.85925 202.610625
R3 15.962 3.9905 209.50125
R4 15.818 3.9545 207.61125
R7 16.938 4.2345 222.31125
R8 16.735 4.18375 219.646875
R9 17.36 4.34 227.85
R10 18.352 4.588 240.87
R11 17.86 4.465 234.4125
R12 17.22 4.305 226.0125
R13 17.633 4.40825 231.433125
R14 19.33 4.8325 253.70625
Total 235.384 58.84 3089.41
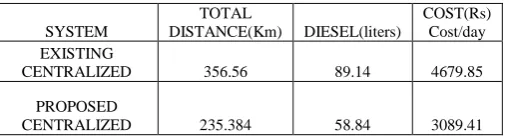
It is found that the cost of proposed centralized system is 1.5 times lesser than the existing centralized system as shown in table 6
Table 6- Comparison between existing and proposed centralized system
SYSTEM
TOTAL
DISTANCE(Km) DIESEL(liters)
COST(Rs) Cost/day EXISTING
CENTRALIZED 356.56 89.14 4679.85
PROPOSED
CENTRALIZED 235.384 58.84 3089.41
V.CONCLUSION
The collection efficiency was increased from 75% to 100%
A new concept called collection bins with lesser capacity was introduced in places where considerable amount of waste is not generated and does not require secondary bins.
The cost of proposed centralized system is 1.5 times lesser than the existing centralized system.
Waste generated from markets is purely organic instead of mixing with the other waste can be collected and transported separately to the vermi compost plant to produce good quality manure.
REFERENCES
[1] Alphone KYESSI and Victoria MWAKALINGA, Tanzania “GIS Application in coordinatind solid waste collection: The case of sinza Neighbourhood in Kinondoni Municipality, Dar es Salaam City, Tanzania”, Surveyors Key Role in accelerated Development, Eilat, Israel, 2009 [2] Ankit Verma and Bhonde B K “Optimisation of Municipal Solid Waste Management of Indore City using GIS”, International Journal on Emerging Technologies 5(1), ISSN No.2249-3255,pp.194-200, 2014
[3] Amirhossen Malakahmad, Putri Md Bakri, Munirah Radin Md Mokhtar, Noordina Khalil “Solid waste collection route optimization via GIS techniques in Ipoh city, Malaysia” , ELSEVIER, Procedia Engineering 77, pp.20-27, 2013
[4 ]Ashtashil Vrushketu Bhambulkar “Municipal Solid Waste Collection Route Optimized With ARC GIS Network Analyst”, International Journal of Advanced Engineering Sciences and Technologies, Vol No.11, Issue No.1, pp.202-207, 2011
[5] Bhambulkar.A.V Isha. P. Khedikar “Municipal Solid Waste (MSW) Collection Route for Laxmi Nagar by Geographical Information System (GIS)”, International Journal of Advanced Engineering Technology, vol 2, Issue 4, pp.48-53, 2011
[6] CPHEEO, 2000. Manual on Municipal solid waste management. Central public health and environmental engineering. New Delhi, India pp. 219-227.
[7] Christos Chalkias, Katia lasaridi “A GIS based model for the optimisation of municipal solid waste collection: the case study of Nikea, Athens, Greece”, WSEAS TRANSACTION on ENVIRONMENT and DEVELOPMENT, ISSN: 1750-5079, Issue 10, Volume 5, 2009
[8] Ghose.M.K, Dikshit.A.K, Sharma.S.K “A GIS based transportation model for solid waste disposal – A case study on Asansol municipality”, pp.1287-1293, (2004)
[10] Khajuria.A, Matsui.T and Machimura.T “GIS Application for Estimating the Current Status of Municipal Solid Waste Management System: Case Study of Chandigarh City, India”, Our nature 9, pp.26-33, 2011
[11] Thanh.N.P, Y. Matsui, N.V.C. Ngan, N.H. Trung, T.Q. Vinh and N.T.H. Yen “GIS application for estimating the current status and improvement on municipal solid waste collection and transport system: Case study at Can Tho city, Vietnam”, Asian Journal on Energy and environment ISSN 1513-4121, pp.108-121, (2009)
[12] Savitha A. L, Gyanen Takhelmayum, Maya Naik “Optimization Model for Integrated Municipal Solid Waste Management by Decentralized System in Mysore City”, IJRIME, ISSN:2249-1619, Volume2, Issue 12, pp.26-34, 2012